

 PDF
PDF ePub
ePub Citation
 Print
Print


INTRODUCTION
Oral hypoglycemic agents (OHA) have been a major modality for glucose control in patients with type 2 diabetes for over 50 years. However, OHA treatment failure is a common problem in the management of type 2 diabetes. Both patient- and disease-related factors can contribute to OHA failure. Poor compliance with lifestyle change is thought to be a major reason for poor responses to OHA treatment.1,2 Deterioration of beta-cell function is the strongest disease-related factor. In several longitudinal studies, beta-cell function of patients with type 2 diabetes declined continuously over time.3,4 At diagnosis, beta-cell function was already reduced by 50%, and further deterioration occurred regardless of therapy.3 The mechanisms of action of almost all OHAs are insulin-dependent, and they do not decrease the blood glucose level when beta-cell function has severely deteriorated. Thus, deterioration of beta-cell function is an important cause of OHA failure in patients with type 2 diabetes.
Diagnosis of beta-cell dysfunction in patients with type 2 diabetes plays an important role when OHA failure is suspected or new treatment modalities are used. Insulin, C-peptide, and proinsulin are secreted from pancreatic beta-cells and are the key protein hormones that reflect beta-cell function.5 However, insulin and C-peptide levels, as well as different indexes taking into account fasting plasma insulin in relation to fasting blood glucose, are not clear in measurements of insulin secretion and clinical decisions.
The aim of this study was to identify the most precise and clinically practicable parameters that predict future OHA failure in patients with type 2 diabetes, and to determine whether these parameters are valuable in various subgroups.
MATERIALS AND METHODS
Subjects
We recruited 267 patients with diabetes who were managed with oral hypoglycemic agents or insulin in the Endocrinology Department of Kwandong University Myongji Hospital, located in Goyang, Korea, between February and May 2009. Thirty-six of these patients were excluded for the following reasons: type 1 diabetes, pregnant or breast-feeding, acute or chronic infectious diseases, or general treatment with glucocorticoids. The ethics committee approved the study protocol. All patients provided informed consent.
The remaining 231 patients (115 women) gave fasting blood samples for laboratory data and the standard breakfast test for evaluation of pancreatic beta-cell function. We managed the study participants according to a consensus algorithm for the management of hyperglycemia in type 2 diabetes from the American Diabetes Association and The European Association for the Study of Diabetes.6 We were unable to maintain contact with 49 patients during follow-up period because 25 transferred to other hospitals, 10 withdrew their participation, and 14 were lost to follow-up without cause. For the remaining 182 patients, hemoglobin A1c (HbA1c) levels were tested and data regarding hypoglycemic medications at one year from the start date of the study were collected.
Standard breakfast test
Blood specimens for plasma insulin, C-peptide, and blood glucose levels were drawn after an overnight fast and 2 h after an individually composed breakfast meal. Plasma proinsulin was tested only from fasting blood specimens. In order to exclude the influence of previous oral hypoglycemic agents or basal insulin on laboratory test results, all subjects discontinued previous medications and were administered a short-acting insulin analog (glulisine, Aventis Pharma) with premeal subcutaneous injections during the three days before testing. The calorie counts of breakfast for each patient were calculated according to the following method:7,8 Carbohydrates, proteins, and fat comprised 60%, 20%, and 20% of the total calories, respectively. Breakfast accounted for 30% of each day's total calories.
Laboratory methods
Blood glucose concentrations were measured using a glucose oxidase technique (Beckman, Fullerton, CA, USA). HbA1c concentrations were analyzed using high-performance liquid chromatography (Variant II, Bio-Rad, Hercules, CA, USA). Insulin and C-peptide concentrations were measured by radioimmunoassay (Daiichi RI Co., Tokyo, Japan). Proinsulin concentrations were measured by radioimmunoassay (catalog no. HPI-15K; Millipore, St. Charles, MO, USA). This assay showed <0.1% cross-reactivity to both human insulin and C-peptide.
Data processing
Markers of insulin sensitivity and beta-cell function were determined by the quantitative insulin sensitivity check index (QUICKI) and homeostasis model assessment-beta (HOMA-B) index, respectively.9,10 Fasting beta-cell responsiveness (M0) represents the ability of fasting glucose to stimulate beta-cell secretion, and postprandial beta-cell responsiveness (M1) represents the ability of postprandial glucose to step up beta-cell secretion; these values were calculated using the formula of Hovorka, et al.11 with some modification: M0=100×fasting C-peptide (µg/L)/fasting glucose concentration (mg/dL), and M1=100×[postprandial 2-h C-peptide concentration (µg/L)-fasting C-peptide concentration (µg/L)]/[postprandial 2-h glucose concentration (mg/dL)-fasting glucose concentration (mg/dL)]. QUICKI was calculated as 1/[log fasting insulin (µU/mL)+log fasting glucose (mg/dL)], and HOMA-beta as [20×fasting insulin (µU/mL)]/[fasting glucose (mmol/L)-3.5].
Hypertension was defined as systolic blood pressure of 140 mmHg or greater, diastolic blood pressure of 90 mmHg or greater, or use of antihypertensive medication.12 Dyslipidemia was defined as triglycerides of 1.3 mmol/L or greater, high-density lipoprotein cholesterol of 1.0 mmol/L or less in men and 1.3 mmol/L or less in women, or use of lipid-lowering agents.13 Diabetic retinopathy was defined as a diagnosis of nonproliferative retinopathy or proliferative retinopathy by an ophthalmologist. Diabetic nephropathy was defined as an albumin to creatinine ratio of 300 µg/mg in a random urine test or an estimated glomerular filtration rate by the Cockroft-Gault equation of 60 mL/min or less per 1.73 m2 body surface area.14 Regular physical activity was defined as weekly exercise time of 150 min or greater.15 Drinkers were defined as those with weekly alcohol intake of 210 g or greater in men and 105 g or greater in women.14 OHA failure was defined as insulin use for control of blood glucose or HbA1c of 7.0% or greater with maximal doses of combined OHAs (two or more of metformin, sulfonylurea, or thiazolidinedione).
Statistical analyses
Several variables, including HbA1c, blood glucose, insulin, C-peptide, HOMA-IR, HOMA-beta, and proinsulin, were not normally distributed in the Shapiro-Wilk test. Logarithmic transformation was used to normalize them, and the variables were applied in the following analyses. A logistic regression analysis was used to compare the clinical and laboratory variables between those who responded to OHA and those in which it failed after adjusting for gender, age, and duration of diabetes. The receiver operating characteristic (ROC) and the area under the curve (AUC) were measured for estimation of the prediction power of future OHA failure by various insulin secretion parameters. We divided subgroups according to body mass index (BMI), fasting glucose, and duration of diabetes, and compared insulin secretion parameters by logistic regression analysis after adjusting for gender, age, and duration of diabetes.
RESULTS
Ninety-two subjects were female (50.5%). The median values (interquartile range) of age and diabetic duration were 61.5 (47.0-71.0) and 9.0 (2.0-15.0) years, respectively. Fifty-seven patients had been treated with insulin injections (39 patients with insulin and OHA, 18 patients with insulin only) at one year from the start date of the study. The median insulin dose was 30.0 (22.0-38.0) units. One hundred and twenty-five patients were treated with OHA only: monotherapy in 13 patients, double combination therapy in 78, and triple combination therapy in 34.
Comparison of baseline insulin secretion parameters of those with oral hypoglycemic response versus failure
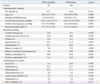
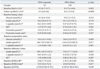
In total, 182 patients (excluding the 49 lost to follow-up) were divided into those with OHA response (n=52) or OHA failure (n=130) according to insulin administration or the follow-up HbA1c 7.0% cutoff. There was no difference in gender, age, weight, or other baseline clinical characteristics between the two groups. Only the duration of diabetes was significantly higher in those with OHA failure than in those with OHA response (Table 1). In laboratory parameters representing the insulin secretion reserve of pancreatic beta-cells, fasting C-peptide, postprandial insulin and C-peptide, the differences between fasting and postprandial insulin, M0, M1, and HOMA-beta levels were significantly higher in those with OHA response than in those with OHA failure. However, fasting proinsulin, fasting insulin, and insulin sensitivity indices (HOMA-IR and QUICKI) did not differ between the two groups (Table 2).
Prediction model ROC curve for OHA failure
The AUC of the ROC measured with postprandial C-peptide to predict future OHA failure was 0.720, and the predictive power for future OHA failure was the highest of the variable parameters representing pancreatic beta-cell function. The AUC of the ROC measured with M0, fasting C-peptide, HOMA-beta, proinsulin, M1, insulin difference, and postprandial insulin were 0.659, 0.637, 0.589, 0.547, 0.655, 0.647, and 0.633, respectively.
When the postprandial C-peptide cutoff dividing those with OHA response and failure was 1.09 nmol/L (3.3 ng/mL), the sensitivity and specificity of the diagnosis of OHA failure were 67.3% and 65.4%, respectively. When the fasting C-peptide cutoff was 0.57 nmol/L (1.57 ng/mL), the sensitivity and specificity of the diagnosis of OHA failure were 59.6% and 58.5%, respectively. The sensitivity and specificity of the diagnosis of OHA failure with an M0 cutoff of 1.03 were 65.4% and 63.8%, respectively. The sensitivity and specificity of the diagnosis of OHA failure with an M1 cutoff of 1.33 was 61.5% and 61.5%, respectively. The lowest values of fasting and postprandial C-peptide, M0, and M1 in those with OHA response were 0.18 nmol/L (0.56 ng/mL), 0.45 nmol/L (1.37 ng/mL), 0.32, and -19.21, respectively. When the HbA1c cutoff dividing OHA response and failure was 8.7%, the sensitivity, specificity, and AUC of the ROC were 60.8%, 61.5%, and 0.673. When the duration of diabetes cutoff was 7.5 years, these values were 57.7%, 57.7%, and 0.611.
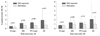
Comparison of baseline insulin secretion parameters of those with OHA response versus failure in subgroup analysis according to BMI
Of the 182 patients with follow-up HbA1c, 115 had BMIs of 25.0 or less. In patients with low BMIs (<25.0), those with OHA response versus OHA failure have the following characteristics: medians and interquartile ranges of fasting C-peptide (0.55 and 0.36-0.85 vs. 0.34 and 0.25-0.61 nmol/L; p=0.021), M0 (1.24 and 0.66-1.49 vs. 0.66 and 0.41-1.10; p=0.002), HOMA-beta (26.9 and 13.2-55.3 vs. 17.5 and 8.1-41.6; p=0.019), postprandial Cpeptide (1.35 and 0.95-1.77 vs. 0.72 and 0.46-1.15 nmol/L; p=0.005), and M1 (1.92 and 0.95-4.15 vs. 0.83 and 0.37-1.79; p=0.013). In contrast, in the subgroup with high BMIs (≥25), the levels of insulin secretion parameters were higher than in those with OHA failure, but there was no significant difference between OHA response and failure (Fig. 1).
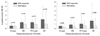
Comparison of baseline insulin secretion parameters of those with OHA response versus failure in subgroup analysis according to fasting glucose levels
Among the 182 patients with follow-up HbA1c, 77 patients had fasting blood glucose levels of 10 mmol/L or greater. In patients with high fasting blood glucose, those with OHA response versus OHA failure have the following characteristics: medians and interquartile ranges of M0 (0.88 and 0.47-1.23 vs. 0.51 and 0.35-0.89; p=0.032), postprandial insulin (104.6 and 69.7-259.3 vs. 75.9 and 42.2-171.4 pmol/L; p=0.028), postprandial C-peptide (1.11 and 0.76-1.90 vs. 0.73 and 0.46-1.11 nmol/L; p=0.007), and M1 (1.80 and 0.95-3.93 vs. 0.67 and 0.26-1.59; p=0.009). In the subgroup with low fasting blood glucose, however, there was no significant difference between OHA response and failure (Fig. 2).
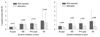
Comparison of baseline insulin secretion parameters of OHA response versus failure in subgroup analysis according to the duration of diabetes
Of the 182 patients with follow-up HbA1c, 119 patients had had diabetes for over five years. In patients with long diabetic duration, those with OHA response versus OHA failure have the following characteristics: medians and interquartile ranges of fasting C-peptide (0.72 and 0.55-1.07 vs. 0.43 and 0.26-0.71 nmol/L; p=0.006), M0 (1.34 and 1.14-2.13 vs. 0.76 and 0.44-1.36; p=0.001), postprandial C-peptide (1.37 and 1.10-2.02 vs. 0.76 and 0.50-1.13 nmol/L; p=0.001), M1 (1.82 and 0.96-4.20 vs. 0.67 and 0.31-1.53; p=0.008), and C-peptide difference (0.85 and 0.31-1.22 vs. 0.31 and 0.15-0.53 nmol/L; p=0.021). In the subgroup with short diabetic duration, however, there was no significant difference between those with OHA response and with OHA failure (Fig. 3).
DISCUSSION
The gold standard for measuring insulin sensitivity is the euglycemic hyperinsulinemic clamp technique,16 which is reproducible and sensitive. However, insulin secretion cannot be evaluated from the euglycemic clamp. When using the clamp, it is thus necessary to perform another experiment, such as a primed hyperglycemic glucose clamp or an intravenous glucose tolerance test.17 To circumvent this drawback, different insulin concentrations are required. Additionally, the need for reaching and maintaining different steady states within the same experiment makes it impossible to perform routinely in clinical practice.
In clinical practice, only fasting samples or simple stimulation tests, such as the OGTT, the glucagon stimulatory test, or the standard breakfast test, which are the most widely used and validated, may be used as parameters of insulin secretion. In these tests, mathematical handling of fasting levels of glucose, insulin, and C-peptide concentrations is the simplest method. Mathematical handling of the fasting levels has been used for the calculation of insulin sensitivity and secretion by introducing various indices, such as HOMA, fasting beta-cell responsiveness (M0), and QUICKI.9-11 However, these simplistic approaches do not give clues about the dynamic state of the relationship between insulin sensitivity and secretion. To estimate beta-cell function, dynamic tests are more useful than fasting samples.
The most widely used test to evaluate insulin reserves is the glucagon stimulatory test. Its validity has been discussed, along with the methodological aspects of its interpretation.18 The glucagon test has the advantage of being a more reproducible stimulus and having much faster action on beta-cells (peak values after 6 instead of 120 min), allowing a marked reduction in observation time. In contrast, the standard breakfast test has the advantage of being a greater physiological stimulus, avoiding the side effects of glucagon injection. However, in clinical practice, both tests are useful in estimating beta-cell function. The standard breakfast test could be an alternative to the glucagon stimulatory test; a good correlation of C-peptide increments in the two tests has been observed.19
The use of measurements related to the circulating insulin concentration does not necessarily translate to information on insulin secretion because only posthepatic insulin delivery is considered. The role of hepatic insulin extraction should also be taken into account if we are interested in evaluating beta-cell function. However, C-peptide is equimolarly released with insulin, not degraded in the liver, and has a 10-fold longer half-life.20 Therefore, C-peptide is considered to be a more reliable marker of pancreatic insulin secretion than insulin.
Hovorka, et al.21 proposed pancreatic responsiveness during glucose stimulation (M1) and under basal conditions (M0) during the meal tolerance test, and reported a significant difference in these parameters between healthy and type 2 diabetic subjects. A key aspect of M0 and M1 is that C-peptide, a representative parameter of pancreatic beta-cell function, is corrected by plasma glucose levels. M0 was more valuable for predicting OHA failure than fasting C-peptide, and the predictive power for future OHA failure of M0 was comparable to that of postprandial C-peptide. If only fasting samples are available, it has been suggested that M0 is the most valuable parameter for estimating beta-cell function.
Levels of proinsulin-like molecules are elevated in subjects with type 2 diabetes or impaired glucose tolerance.22 It has been suggested that elevated proinsulin levels are a manifestation of beta-cell dysfunction rather than of increased demand on the beta-cell. This may reflect beta-cell "stress", with defective post-translational processing and/or accelerated granule secretion before processing is completed.23 We found no difference in fasting proinsulin levels or in the proinsulin to insulin ratio between those with OHA response and failure. Additional studies are necessary to identify the roles of proinsulin-like molecules in diabetes.
Manzanares, et al.24 studied the efficacy of a standard mixed meal to predict the need for insulin therapy over a one-year period. The sensitivity and specificity of basal C-peptide levels of less than 0.9 nmol/L in patients with insulin treatment were 83.6% and 78.9%, respectively. For postprandial values of less than 1.9 nmol/L, the sensitivity and specificity were 77.7% and 78.9%, respectively. The cutoff values, sensitivity, and specificity of the Manzanares study were higher than those of our study. However, only patients with a high basal glucose (greater than 11.1 mmol/L) were enrolled in the Manzanares study. If we had selected patients with a high basal glucose (greater than 10.0 mmol/L) for our study, the sensitivity and specificity would have been higher (data not shown). Thus, the results of our study can be generally applied to all diabetic subjects. The higher cutoff values found in the Manzanares study may be explained by higher BMI, racial differences, higher insulin resistance, or a combination of these factors.
In a previous study, C-peptide release in lean and overweight patients was found to be significantly lower in insulin-treated than in OHA-treated patients, but this difference disappeared in obese patients.25 In our study, we observed the same relationship between obesity and values of beta-cell functional parameters. Variations in insulin clearance, mainly in obese patients, and particularly those with excess abdominal fat, may modify the relationship between plasma insulin values and insulin secretion. Abdominal obesity was inversely correlated with the hepatic extraction fraction, and directly correlated with posthepatic delivery of insulin.26 Thus, insulin hypersecretion in obese diabetes patients represents a diminution of peripheral insulin sensitivity rather than insulin secretion function of pancreatic beta-cells. In fact, there was a marked difference in insulin sensitivity indicators such as HOMA-IR and QUICKI between the groups with low and high BMI.
In contrast, the data of the subgroups divided by duration of diabetes or fasting plasma glucose levels differed from that of BMI. There was no significant difference in HOMA-IR or QUICKI between groups divided by duration of diabetes or fasting plasma glucose levels (data not shown). In subjects with high fasting plasma glucose, pancreatic insulin secretion was fully stimulated, as opposed to the submaximal stimulation in subjects with low fasting plasma glucose. The plasma C-peptide response to intravenous glucagon and to a standard test meal was markedly potentiated by acute hyperglycemia in type 2 diabetes mellitus. However, no further potentiation was obtained when the prestimulatory blood glucose concentration rose above 12 mmol/L.27 This suggests that maximal stimulation of beta-cells raises the predictive power of insulin secretion parameters, detecting OHA failure.
Explaining the effect of diabetic duration on the predicting power of the parameters of beta-cell function is less clear. Among patients with OHA failure, the levels of fasting and postprandial C-peptide, M0, and M1 of patients with long duration of diabetes were markedly lower than those with shorter duration of diabetes. This may be due to the continuous decrease in beta-cell function that occurs in long-standing diabetes. In contrast, the levels of these parameters did not differ between the two groups in those with OHA response. The difference in beta-cell function between those with OHA response and those with OHA failure seemed to be pronounced in patients with long diabetic duration.
This study has some limitations. Both patient- and disease-related factors can contribute to OHA failure in type 2 diabetes. We primarily evaluated the usefulness of insulin secretion parameters in predicting OHA failure. Poor compliance with lifestyle change is thought to be a major reason for poor responses to OHA treatment; we did not relate the effects of lifestyle changes to the participants' responses to OHA. In this study, we defined OHA failure as insulin use for control of blood glucose or HbA1c of 7.0% or greater with more than double OHA. The cutoff value of HbA1c was quite strict compared to one previous study.26 Some subjects with mild hyperglycemia may not have been true OHA failures. Future studies correcting these weak points are needed.
In conclusion, postprandial C-peptide was the most useful of the simple insulin secretion parameters for predicting future OHA failure in type 2 diabetic subjects. M0 using fasting samples was shown to be the next most useful. However, these parameters, which measure beta-cell function, are only valuable in diabetic subjects with low BMI, high blood glucose level, or long-standing diabetes.
 XML Download