

 PDF
PDF ePub
ePub Citation
 Print
Print


INTRODUCTION
Several prognostic scoring systems have been developed to predict hospital mortality in intensive care unit (ICU) patients, the most famous being the Simplified Acute Physiology Score (SAPS), the Acute Physiologic and Chronic Health Evaluation (APACHE) Score, and the Mortality Prediction Model (MPM). These scores can be used as an aid to clinical management, resource allocation, and quality assessment.1,2 However, whether these scoring systems can accurately predict mortality in a modern-day ICU is not known.1-7
Recently, SAPS 3 was developed through a worldwide prospective study. SAPS 3 features customized prognostic models for different geographic regions. However, to our knowledge, there have been no external validations of SAPS 3 or its Australasia prognostic model in a critical care population of Korea.6 This study was designed to assess the validity of general SAPS 3 admission score and its Australasia prognostic model in a Korean intensive care sample.
MATERIALS AND METHODS
Patients
All patients admitted to the medical ICU of Samsung Medical Center, a 1,900-bed tertiary referral center in Seoul, South Korea, between March 1st, 2008 and February 28st, 2009, were eligible for this study. We excluded patients if they were less than 15 years old, or stayed in the ICU < 8 h. For patients with two or more admissions to the ICU during the same hospital stay, only the data from the first admission were included. A total of 660 patients were admitted to our medical ICU, and a total of 633 patients were included in the study. The study was approved by the Institutional Review Board and the requirement for informed consent was waived.
Data collection
We drew data from a prospectively collected database. We used the worst data from the first 24 hours after admission to the ICU to calculate the SAPS II score, while data from the first hour after admission were used to calculate the SAPS 3 score. For the SAPS 3 score, data were recorded using a SAPS 3 admission score sheet downloaded from the SAPS 3 website (http://www.saps3.org). The predicted mortality was also estimated using the customized equation for Australasia.1,8 The customized SAPS 3 score equation for Australasia is as follows: Logit = - 22.5717 + ln (SAPS 3 score + 1) × 5.3163.1 There were no missing data.
Statistical analysis
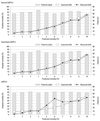
Data are shown as mean ± standard deviation (SD). For statistical analysis, SAS 9.1 was used (SAS Institute Inc., Cary, NC, USA). Validation of the scoring system was performed using standard tests to measure calibration and discrimination. Calibration is defined as the agreement between individual probabilities and actual outcomes. The Hosmer-Lemeshow goodness of fit Ĉ statistic to evaluate calibration of each predictive models.1 Expected mortality rates in 10% intervals (x-axis) were shown against observed mortality rates (y-axis). Discrimination is defined as the power to distinguish between non-survivors and survivors and was assessed by calculating the area under the receiver operating characteristic (aROC) curve.1 A two-tailed p value < 0.05 was considered statistically significant.
RESULTS
Baseline characteristics of the patients
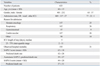
The baseline characteristics of the patients are reported in Table 1. The mean age of the patients was 60 ± 15 years and there was a predominance of males (63%). The routes of ICU admission were: emergency room [n = 469 (77%)], general ward [n = 137 (22%)], and other ICU [n = 27 (1%)]. Patients' characteristics and the main reasons for ICU admission are outlined in Table 1. The median ICU stay was 5 days.2-11
Comparison of predicted mortality
The hospital mortality was 31% (193/633). The SAPS 3 score was 63 ± 18, while the SAPS II score was 44 ± 20 points. The predicted mortality rates were 42 ± 28%, 39 ± 27%, and 37 ± 31% for general SAPS 3, Australasia SAPS 3, and SAPS II, respectively.
Calibration of prediction scores
The general SAPS 3 and Australasia SAPS 3 model exhibited good calibration (Ĉ = 3.174, p = 0.923 for general SAPS 3, Ĉ = 3.286, p = 0.915 for Australasia SAPS 3) (Table 2). The calibration of SAPS II was poor (Ĉ = 23.470, p = 0.003) (Table 2). The Australasia SAPS 3 model did not improve the uniformity of fit of the general SAPS 3 model (Fig. 1).
Comparison of discrimination
Although general SAPS 3 and Australasia SAPS 3 had a greater aROC, suggesting slightly better discriminative power than the SAPS II model, all predicted models had aROC values less than 0.8. Customization using the Australasia equation did not improve the discriminative ability of the original score and the SAPS II score had the lowest aROC [aROC 0.76, 95% confidence interval (CI) 0.73, 0.80] (Table 2). We did not detect any improvement in discriminative power by using the Australasia equation in our sample of Korean intensive care patients (Table 2).
DISCUSSION
SAPS II is one of the most commonly used prognostic scoring systems in critically ill patients, but a revised scoring system, SAPS 3, was devised for several reasons. First, the SAPS II score was developed from a database collected in the early 1990s, and there have been significant changes in the prevalence of major diseases, diagnostic approaches, and therapeutic modalities since that time.1-3 Second, previous prognostic models did not take into account the clinical milieus of different regions of the world, being developed mostly from clinical data of European and North American origin.1,2 Third, many reports suggested that SAPS II has poor predictive power in different populations, limiting its usefulness.7
The SAPS 3 scoring system was developed to enhance prediction power by overcoming these deficiencies. The SAPS 3 has the following unique characteristics. First, SAPS 3 is composed of 20 variables gathered within one hour of ICU admission.2 So SAPS 3 is not affected by the Boyd and Grounds effect,2 thus in theoy it should have reduced risk of overestimated prediction about the mortality rates. Second, SAPS 3 reflects the chronic health status and the conditions before admission to ICU which can influence long-term prognosis of these patients.2 Finally, SAPS 3 features customized equations that were developed to consider regional differences in disease distributions, genetic factors, and therapeutic behaviors.
To our knowledge, this is the first study exploring the validation of general SAPS 3 or its customized equation for Australasia in patients of Korea. External validation is essential before routine application of any model in a group of patients different from the one originally used for model development. So far there have been only a handful of studies of the external validation of SAPS 3 and its customized scores, with mixed results. In an external validation study of a general intensive care population in Europe, SAPS 3 and its customized model for Central and Western Europe were more discriminative and had better calibration compared to Acute Physiology and Chronic Health Evaluation II (APACHE II), but were not significantly better than SAPS II.9 An Austrian validation study found that the SAPS 3 admission score overestimated hospital mortality but that the customized equation showed excellent calibration and discrimination.1 Validation of the SAPS 3 score in Brazil, and, in particular, its customized equation for Central and South American countries, was successful in critically ill patients with cancer.8
In our cohort, the general SAPS 3 admission prognostic model and the Australasia SAPS 3 had good calibration. However, the SAPS II model exhibited poor calibration. Performance of SAPS II in our cohort was similar to other reports:10,11 acceptable discrimination but lack of calibration. In most cases, the lack of calibration was often accompanied by an underestimation of mortality in low risk patients and an overestimation in high risk patients.7 The discriminative power of general SAPS 3 and Australasia SAPS 3 were better than that of SAPS II, but no single model had an aROC value exceeding 0.8, a threshold generally considered to indicate good discrimination. In our cohort, both general SAPS 3 and Australasia SAPS 3 revealed a lower discriminative power rather than that in the original SAPS 3 study (aROC 0.848, 95% CI 0.98, 1.02; aROC 0.839, 95% CI 0.85, 0.99 in original SAPS 3 study).7 A pattern of good calibration with poor discrimination is one frequently found when existing severity scoring systems are evaluated on populations different from the ones for whom these models were originally developed.12,13
One of the most important findings of our study was that the customized equation for Australasia (Australasia SAPS 3) did not result in better predictive power than the general SAPS 3 equation. The regional equation was developed for more precise estimation from a more homogeneous case mix. However, in our cohort, Australasia SAPS 3 as a local or regional equation did not improve the predictive power of the original prediction model. Several factors may have potentially contributed to that fact. First, although the customized equation for Australasia was derived from patients in Australia, India, and Hong Kong, these patients may differ from our cohort in terms of genetics, disease distribution, or other factors. Australia, which contributed more than one-third of the patients in the original cohort, is a multi-ethnic country with a large population of European descent. Other than the fact that they are geographically close to each other, there is no intuitive reason to combine data from Australia, India, and Hong Kong to formulate a customized equation for patients of Asian descent due to differences in genetics and medical and social systems. Australia is more like European countries than other countries in the region. It would be interesting to see how the equation might have differed if only patients of East Asian descent were included.
Another explanation might be that our cohort was sicker and only involved medical patients, while the original cohort included less sick patients and more diverse patient samples. In the original cohort of SAPS 3, the median SAPS II score was 28, and ICU mortality was 12.7%, which is significantly different from our cohort (SAPS II mean of 44). In addition, 25% of our cohort was made up of cancer patients, while in the original SAPS 3 cohort this fraction was only 10%. Finally, different patterns and quality of ICU care might have resulted in these discrepancies. However, our observed mortality was similar with the predicted mortality from all three scores, which suggests that the results of this study did not result from poor intensive care quality.
Our study has several limitations. It is a retrospective analysis of prospectively collected data, but we made every effort to validate the data as thoroughly as possible. Second, the data are from a single center with a relatively limited number of patients, which limits the generalization of our findings.
In conclusion, the SAPS 3 admission prognostic model had good calibration and modest discriminative power when applied to ICU patients in Korea. However, its customized equation for Australasia did not improve predictive power. Therefore, a new prognostic model customized for Korean patients is deemed necessary.

 XML Download