

 PDF
PDF ePub
ePub Citation
 Print
Print


INTRODUCTION
The efficacy of drug-eluting stents (DES) has been known to be influenced by the drug delivery platform (stent design and polymer), drug, and its dose.1-5 Some studies have reported that a considerable variation of the drug concentration in the arterial wall is present after DES implantation.3,4 Thereafter, the asymmetric stent expansion or strut distribution has been regarded as potential factors for the significant neointimal growth after DES implantation. However, in the recent intravascular ultrasound (IVUS) substudy of the SIRolImUScoated Bx Velocity stent in the treatment of patients with de novo coronary artery lesions (SIRIUS) trial,6 asymmetric stent expansion after sirolimus-eluting stents (SES) implantation did not affect suppression of neointimal hyperplasia (NIH).7 However, until now, there were no data regarding asymmetric stent expansion of paclitaxel-eluting stents (PES), those relations with NIH, and comparative data regarding the effect of stent eccentricity (SE) on NIH between SES versus PES. Therefore, the aim of this study is to evaluate the significance of DES eccentricity according to the types of DES through a serial follow-up IVUS study.
MATERIALS AND METHODS
Study population
This study represents an IVUS substudy of Post-stent Optimal Stent Expansion (POET) trial, the prospective, multicenter, 2×2 randomized study comparing the efficacy according to the types of balloons (non-compliant versus compliant balloon) and types of DES [PES (Taxus Express™, Boston Scientific, Natick, MA, USA) versus SES (Cypher Bx-Velocity®, Cordis Corp, Miami Lakes, Florida, USA)] in de novo native coronary lesions.8 A serial IVUS evaluation was performed at each step; baseline, postprocedural IVUS until optimal stent expansion criteria were met,9 and the 9-month follow-up IVUS. Patients were eligible if they had a de novo target lesion of a native coronary artery with a reference vessel diameter (RVD) of 2.5 to 3.5 mm that could be covered by a single stent. The more precise explanations regarding rationale and design of the POET trial have been previously presented.8 Among the 301 patients originally enrolled in this study (152 PES and 149 SES), the follow-up IVUS at 9 months was performed in 233 patients [SES group (n = 108) versus PES group (n = 125)]. These patients with the IVUS follow-up comprised the subjects of the present study.
Quantitative angiographic analysis
Quantitative coronary angiography (QCA) was performed using an offline QCA system (CMS, Medis Medical Imaging System, Nuenen, The Netherlands) by a single individual who was blinded to a patient's treatment assignment in an independent core laboratory at Yonsei University Medical Center (Cardiovascular Research Center, Seoul, Korea). Using the guiding catheter for magnification-calibration, minimal luminal diameter (MLD) and diameters of the reference segments were measured before and after stenting from diastolic frames in a single, matched view showing the smallest MLD. The RVD was the average of the proximal and distal reference lumen diameters. Late loss was defined as the difference between the MLD at follow-up and the MLD post-procedure. Angiographic restenosis was defined as ≥ 50% luminal narrowing at the treated lesion or the in-segment lesion within 10 mm in the 9-month follow-up angiography.
IVUS assessment
All IVUS images were reviewed in an independent IVUS core laboratory at Yonsei University Medical Center. IVUS assessment was performed using a commercially available IVUS system (Boston Scientific/Scimed, Natick, Massachusetts, USA) with automatic motorized 0.5 mm/s pullback. Studies were recorded on s-VHS tape or compact disk for offline analysis using the EchoPlaque 2 system (INDEC Systems, Inc., Mountain View, California, USA). Proximal reference cross-sectional area (CSA) and distal reference CSA were measured at the most visually normal area (largest lumen with the least plaque burden) within 10 mm of the proximal or distal ends of the lesion. Minimal luminal CSA was defined as the smallest area within the target lesion. Minimal stent CSA [minimal stent area (MSA)] was taken as the smallest area within the stent. The %NIH area was defined as NIH area (stent CSA minus lumen CSA) divided by stent CSA. The stent volume, lumen volume, and NIH volume (stent volume minus lumen volume) was analyzed, using Simpson's method. NIH volume index was calculated as NIH volume divided by the length of stent.
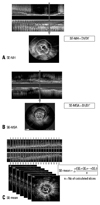
SE was defined as minimum stent diameter divided by maximum stent diameter. We investigated three different SE parameters defined as follows: 1) SE determined at the lesion site with maximal %NIH area on follow-up IVUS (SE-NIH) (Fig. 1A), 2) SE determined at the site with MSA (SE-MSA) (Fig. 1B), and 3) mean SE (SE-mean) was the averaged value through the entire stent (Fig. 1C). For the evaluation of the association between different SE parameters of each DES and angiographic or clinical outcomes, we re-divided each DES group into the two groups based on the mean value of SE; the concentric (≥ mean SE) and eccentric expansion groups (< mean SE).
Statistical analysis
Statistical analysis was performed with SPSS software, version 13.0 (SPSS Inc, Chicago, IL, USA). Categorical data were presented as frequencies and compared with Chi-square statistics or Fisher's exact test. Continuous data were presented as mean ± 1SD and compared with Student t-test. Correlations between SE and %NIH area or NIH volume index were tested with Pearson's univariate test. To determine the independent predictors for the angiographic restenosis in the total population, multivariate logistic regression analysis was performed, and variables that were predictive at the 0.1 level by univariate analysis were entered into final multivariate analysis. A value of p < 0.05 denoted statistical significance.
RESULTS
Comparison of SE and baseline characteristics according to the different determinations of SE between SES versus PES
There were no significant differences of the baseline clinical, angiographic, and procedural characteristics and IVUS parameters between the SES versus PES group or compliant versus non-compliant postdilation balloon, as previously presented.8
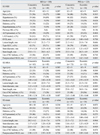
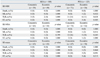
The comparison of different SE parameters between SES and PES was presented in Table 1. The SE-NIH and SE-mean of the PES group were significantly higher than that of the SES group. However, the absolute difference of SE between the two groups was minimal (mean difference 0.01). There was no significant difference in SE-MSA between the two groups.
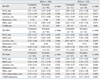
Each DES group was divided into the concentric and the eccentric stent expansion subgroup and baseline characteristics of each subgroup were compared in Table 2. The patients in the concentric stent expansion subgroup of SES according to the SE-NIH were more likely to have an acute coronary syndrome as an initial presentation, compared with the eccentric group of SES by SE-NIH (49% versus 29%, p = 0.032). The eccentric group of SES according to SE-MSA showed a longer lesion length (22.9 ± 7.4 mm) than that of the concentric group of SES (19.1 ± 6.0 mm, p = 0.005). There was no significant difference of the baseline characteristics in the PES group. In addition, there were no significant differences in the other baseline characteristics between the two groups.
Associations between SE parameters and NIH
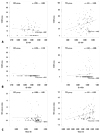
There was no significant correlation between %NIH area and SE-NIH of the SES group (r = - 0.083, p = 0.391; see) (Fig. 2A). However, in cases of PES, SE-NIH showed a weak but significant correlation with %NIH area, which meant that a higher SE caused slightly more NIH (r = 0.269, p < 0.01). Between SE-MSA and %NIH area, there was no significant correlation in both the SES and PES groups (Fig. 2B).
As to the associations between SE-mean and NIH volume index, the SES group revealed no significant correlation (r = - 0.001, p = 0.990), but the PES group showed a weak but significant correlation (r = 0.320, p < 0.01), similar to SE-NIH (Fig. 2C).
Effects of SE on the angiographic, IVUS, and clinical outcomes
Follow-up angiographic and IVUS outcomes of each expansion group were compared in Table 3. The SES group showed that there were no significant differences in the late loss, restenosis rate, and %NIH area between the concentric versus eccentric expansion groups defined by 3 different SE parameters. However, the concentric stent expansion subgroup of PES according to SE-NIH showed a significant trend toward having a larger %NIH (39 ± 21 versus 32 ± 21%, p = 0.06) (Table 3). In addition, the concentric stent expansion subgroup of PES according to SE-mean had a significantly higher NIH volume index (1.26 ± 1.08 versus 0.73 ± 0.79 mm2, p = 0.003) (Table 3).
As to the associations between each group according to the expansion of DES and each clinical outcome, there was no significant difference in the rate of death, myocardial infarction, target-lesion revascularization (TLR), or stent thrombosis between the concentric and eccentric stent expansion subgroups of each DES (Table 4).
Multivariate analysis of predictors for the angiographic restenosis
Using multivariate logistic analysis, the significant independent predictors for the angiographic restenosis from the total population of our study were the use of PES [odds ratio (OR): 8.25, 95% CI: 1.79-37.99] and the presence of diabetes (OR: 3.4, 95% CI: 1.0-11.3). Other parameters including SE were not significant predictors for the angiographic restenosis.
DISCUSSION
This study demonstrated SE of PES was significantly higher than that of SES, which meant that PES showed more symmetric expansion with high-pressure post-dilation than SES. However, there were no consistent correlations between SE according to the various determinations and neointimal growth of both the SES and PES groups. In addition, there were no correlations between the degree of SE and clinical outcomes such as restenosis, TLR, or stent thrombosis.
The DES eccentricity had been previously considered as one of the IVUS predictors for restenosis, because of the higher possibility of the uneven diffusion of the drug into the arterial wall due to asymmetric stent expansion.3,4,7 However, recent reports showed that SE of SES did not affect NIH.4,10 The powerful effect of NIH suppression by SES could overcome the uneven diffusion of the drug into the vessel wall from the SE. Based on these studies, Dr. Mintz GS and Weissman NJ concluded that SES asymmetry has no clinical impact.11
The present study focused on several issues that were not evaluated in previous studies. First, we investigated the impact of local SE parameters on neointimal growth at the same location. The SIRIUS IVUS sub-study used only the mean SE. Therefore, it was not certain whether focal SE within a stent has any effect on NIH.4,10 We investigated not only the mean SE through the entire stent but also SE of two specific portions: the lesion site with maximal %NIH area on the follow-up IVUS and the site with MSA, in which SE might contribute to more neointimal growth after stent implantation. Secondly, there were no data regarding the impact of SE in cases of PES, which has a different drug and different design of stent platform, compared with SES. Third, we directly compared SES and PES for asymmetry of stent expansion and its impact on neointimal growth and clinical outcomes from the randomized trial.
This study confirms the previous finding that eccentricity of stent expansion in the SES group has no impact on neointimal growth and clinical outcomes such as death, myocardial infarction (MI), target-lesion revascularization (TLR), or stent thrombosis. PES showed slightly more symmetric expansion compared to SES. However, against our expectations, more symmetric stent expansion in the PES group was rather associated with greater neointimal growth, even though this association had no clinical significance. This association might be explained by different baseline characteristics between the concentric and eccentric stent expansion subgroup of PES in the POET trial; the concentric group of PES had a relatively higher percentage of diabetic patients (36% versus 24%, p = 0.107), smaller mean RVD (2.83 versus 2.97 mm, p = 0.067), smaller MSA (5.87 versus 6.36 mm2, p = 0.065), and higher percentage of lesions with final MSA < 5 mm2 (28 versus 18%, p = 0.072). These characteristics are generally considered important predictors of restenosis.12,13 Therefore, we believe the eccentricity of stent expansion has no impact on neointimal growth and clinical outcomes in both SES and PES.
Although the local IVUS parameters like SE should not be the main predictors for restenosis in DES ear, we should not outlook the usefulness of these associated IVUS parameters, because it is almost certain that asymmetric stent expansion in DES has caused the uneven diffusion of the drug into the arterial wall.3,4 But, DES eccentricity, only calculated as the ratio of minimum and maximum stent diameter, had no further impact on neointimal growth in spite of the various determinations in SE. Rather, from the recent IVUS studies, the parameters such as strut distribution or maximum interstrut angle on each slice has been more heightened as the powerful IVUS predictor for restenosis.14-16 Therefore, the parameters associated with strut distribution, considered to be the more detailed and complex predictor than SE for restenosis, would be more importantly regarded as the IVUS predictors for restenosis.
Study limitations
This study has several limitations. First, most patients enrolled in the POET were dilated up to 20 atm until the Multicenter Ultrasound Stenting in Coronary Study (MUSIC) criteria were met.8 Due to this strategy, our study cases might show relatively more concentrically expanded tendencies, compared with those of real world practices. These effects might influence SE and its clinical significance. However, recently, postdilation with high pressure is becoming more common for the acquisition of complete opposition and larger stent area. Second, baseline clinical, angiographic, or IVUS characteristics between eccentric and the concentric group were not controlled. In fact, it was impossible to control the baseline characteristics of the study groups based on the SE. Third, the interactions between asymmetric stent expansion and plaque distribution or type, including calcification, were not fully examined. However, the diffuse or calcified lesions were excluded in the POET trial. In addition, the analysis of the inter-correlation between SE and MSA and the evaluation of peristent segments were not performed. The fourth limitation of our study was the possibility that limited resolution of IVUS might have missed some important findings. A recent study by follow-up optical coherence tomography (OCT), showing a higher resolution than IVUS, has shown that SE may be associated with thrombus formation after SES implantation.17 Therefore, we should await the future result of OCT studies regarding the expansion of DES.18 Fifth, for the definition of the eccentric expanded group, we used mean SE. However, until now there has been no definitive validated study for the cut off value of SE including mean SE to define eccentric stent expansion. Finally, the stent platforms used in this study are not currently available. PES and SES in our study had previous stent platforms, which were not different with currently available ones, Taxus liberte™ or Cypher Select™. The new platforms of PES or SES could have a different influence on the current results of our study.
In conclusion, this study demonstrated that there were no consistent correlations between various SE parameters and neointimal growth. The asymmetric stent expansion of both SES and PES might not affect the NIH and clinical outcomes.

 XML Download