

 PDF
PDF ePub
ePub Citation
 Print
Print


INTRODUCTION
The ability to differentiate viable from non-viable myocardium is clinically important for determining the therapeutic management of patients with coronary artery disease and also for predicting functional recovery in the culprit arterial territory.1,2 Over the past several years, delayed contrast-enhanced magnetic resonance (MR) imaging has been regarded as a clinically validated tool in the assessment of myocardial viability and infarct morphology.3,4 However, MR imaging requires a long acquisition time and has limitations in patients with implantable cardiac defibrillators and biventricular pacing devices.2 Moreover, there are difficulties in evaluating coronary artery disease or stent patency with MRI.
The recent advent of multidetector computed tomography (MDCT) technology has greatly improved spatial and temporal solutions, which can provide a potential to assess coronary atherosclerosis.5-7 Furthermore, previous studies have demonstrated that delayed contrast-enhanced MDCT methods would be a reliable technique to assess the myocardial viability.8-10 However, increasing radiation exposure with additional delayed contrast-enhanced computed tomography (CT) scans is a major obstacle in assessing the myocardial viability through delayed CT scans combined with arterial CT scans.
More recently, new MDCT imaging protocols have been proposed with prospective ECG-gating, in which radiation is applied only at predefined time points of the cardiac cycle, rather than during the entire cardiac cycle.11 To date, the clinical application of cardiac MDCT with a prospective ECG-gating protocol in the assessment of myocardial viability has not yet been reported. Accordingly, the purposes of the present study were to compare prospective ECG-gated 64-slice MDCT with cardiac MR imaging in the assessment of myocardial enhancement and infarct size early after acute reperfused myocardial infarction, and to evaluate the stent patency after percutaneous intervention (PCI) with stenting at the culprit lesion using prospective ECG-gated 64-slice MDCT angiography.
MATERIALS AND METHODS
Patients with reperfused myocardial infarction
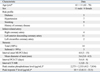
Seventeen patients who were admitted with acute myocardial infarction (MI) were prospectively enrolled in this study (Table 1). MI was diagnosed on the basis of elevated cardiac enzymes, ST-segment elevation on ECG and presence of an angiographically demonstrated partial or complete occlusion of the culprit artery. All patients were successfully treated with percutaneous coronary intervention (PCI) with stenting.
All patients who were treated with PCI with stenting underwent cardiac MDCT for the evaluation of stent patency and myocardial changes at the involved lesions and cardiac MR imaging to assess the MI. Patients who had an arrhythmia, overt heart failure, impaired renal function, contrast allergy or any other contraindications for MR imaging (metal implants, pacemaker or severe claustrophobia, etc) were excluded from this study. An explanation concerning radiation risks related to CT and risks related to CT and MR contrast media was given to each patient. This study was undertaken after informed consent was obtained from the patient for cardiac MDCT and MR imaging, and the study was approved by the institutional review boards.
CT protocols
Cardiac MDCT was performed using a 64-slice MDCT scanner (Philips Brilliance 64, Philips Medical System, Best, The Netherlands). With the patient in a supine position, cardiac MDCT was performed in the craniocaudal direction within a single breath-hold at end-inspiratory suspension. A β-blocker (40 to 80 mg propranolol hydrochloride; Pranol, Dae Woong, Seoul, Korea) was administered orally one hour before the examination to reduce the heart rate in patients who had a heart rate of more than 70 beats per minute. A total 2.0 mL/kg of iodinated contrast agent (Optiray 350; Tyco healthcare, Kantata, Canada), not exceeding a total of 150 mL, was administered using a two-phase injection protocol on the arterial and delayed phases of the CT images.
Arterial phase CT imaging
We used a prospective ECG-gating protocol that involved a step-and-shoot technique.11 The scanning parameters were as follows: step-and-shoot axial scanning direction, 420-msec gantry rotation time, 120 kV, 210 mAs, 64×0.625-mm slice collimation, and 2 cm table feed per rotation.
Seventy mL of iodinated contrast medium was administered intravenously at a rate of 5 mL/sec, followed by 40 mL of normal saline at a rate of 4 mL/sec using a power injector (Nemoto; Nemoto Kyorindo, Tokyo, Japan). Imaging was performed using a real time bolus tracking technique. The scans were started 7 seconds after a trigger threshold of 110 HU was reached. An ECG for each patient was recorded simultaneously. The mean heart rate during the scan was 61 beats per minute (BPM) (range, 56 to 67 BPM).
The image reconstruction was performed on the Brilliance V2.4.5 (Philips Medical Systems, Veenpluis, The Netherlands). The reconstruction parameters were as follows: a 0.8 mm slice thickness, a 0.45 mm increment, a 512×512 pixels image matrix, a XCC kernel (a XCD kernel for stent), a 15-22 cm field of view, and the center of the imaging reconstruction window at 75% of the R-R interval.
In order to evaluate the stent patency at the culprit artery, volume rendering technique (VRT) and curved multiplannar reformation (MPR) with 1-mm thickness were performed using the Aquarius Workstation V3.6 (TeraRecon, San Mateo, CA, USA). MPR images with a section thickness of 8 mm and without a gap in a 4-chamber view and long- and short-axis orientations of the left ventricle were produced to assess the myocardial perfusion status.
Delayed phase CT imaging
After taking arterial phase scanning, the remaining contrast medium was injected at a rate of 4 mL/sec, followed by 30 mL of normal saline at a rate of 4 mL/sec using a power injector. Delayed phase scans were performed in 7 minutes after the second bolus injection of contrast material. The scanning protocol and image reconstruction for delayed phase images were same as those used at the arterial phase. MPR images with a section thickness of 8 mm and without a gap in a 4-chamber view and long- and short-axis orientations of the left ventricle were produced to assess the myocardial perfusion status.
MR protocols
Cardiac MR imaging was performed with a 1.5T system (Magnetom Avanto; Siemens Medical Solutions, Erlangen, Germany). After completion of the perfusion images with a bolus injection of 0.1 mmol/kg gadopentetate dimeglumine (Magnevist; Schering, Berlin, Germany) at the rate of 4 mL, followed by 20 ml of normal saline at the rate of 4 mL/sec using a power injector (Nemoto; Nemoto Kyorindo, Tokyo, Japan), cine images were obtained for the assessment of myocardial contractile function and wall motion (not included for data analysis in this study).
Delayed phase MR imaging
A second bolus of 0.1 mmol/kg of gadopentetate dimeglumine was intravenously administered at the rate of 4 mL followed by 20 mL of normal saline at a rate of 4 mL/sec using a power injector. We performed gradient echo sequences with varying inversion times in order to select the most appropriate inversion time to null the signal from the normal myocardium. Imaging parameters were as follows: repetition time/echo time, 23.5/1.1 msec; image matrix, 19×78; flip angle, 25°; inversion pulse, 180°; and inversion time, 150-650 msec.
Ten minutes after the administration of a second bolus of gadopentetate dimeglumine (total, 0.2 mmol/kg), delayed enhancement images were obtained in a 4-chamber view and long- and short-axis orientations of the left ventricle with 8-mm section thickness using inversion recovery prepared turbo gradient echo sequence. The image parameters were as follows: repetition time/echo time, variable/variable; image matrix 256×156; echo train length, 1; flip angle, 25°; pixel bandwidth 130 kHz; section thickness, 8 mm; and inversion time, 180-380 ms.
Data analysis
The image sets were transferred to separate workstations for cardiac MDCT (Aquarius Workstation V3.6; TeraRecon, San Mateo, CA, USA) and MR (Syngo Numaris/4; Siemens Medical Solutions, Erlangen, Germany) for analysis. The dose-length product displayed by the CT unit was recorded at the arterial and delayed enhancement phases for each cardiac CT examination. The effective dose was calculated by multiplying the dose-length product by the conversion coefficient (0.017) for the chest and expressed as millisieverts.12
We assessed CT images on the first analysis session and then evaluated MR images in 1 month after evaluation of CT images. On the arterial phase of CT images, the stent patency was evaluated in consensus by two readers. The stent was regarded to be patent if the lumen was filled with contrast material without filling defect and if the distal segment of the vessel was well traced on the CPR images. Two independent readers then evaluated the values of attenuation or signal intensity and the size of the perfusion deficit or infarct myocardium on the CT and MR images. We measured the values of CT attenuation and MR signal intensity for each technique by drawing regions of interest of approximately 30 mm2 in areas of hypo- or hyperenhanced and remote normal myocardium on the arterial and delayed phases of CT images and on the delayed phase of MR images. The mean values measured by two readers were used for evaluation of the contrast-to-noise ratio (CNR) between the infarct and remote normal myocardium. The CNR was calculated as the attenuation difference in CT or the signal intensity difference in MR imaging between the infarct and remote normal myocardium, divided by the standard deviation of the CT attenuation or MR signal intensity within the remote normal myocardium.
The total size of the perfusion defect or infarct, which was expressed as a percentage of the total left ventricular myocardial mass, was evaluated by two observers who were blind to the clinical history on the arterial and delayed phases of CT images and on the delayed phase of MR images. Arterial phase CT images were assessed using predefined image display setting: window width, 200 HU; window level, 100 HU. For delayed enhancement CT, the window level was set at 100 HU, and the width was set at 150 HU.
Statistical analysis
Continuous variables are presented as means ± standard deviations. The statistical differences for the CNR were examined using a Student t-test between the arterial and delayed phases of CT images and between the delayed phase images of CT and those of MR imaging. A Pearson's correlation and Bland-Altman analysis13 were performed to determine the correlation and limits of agreement for infarct sizes between the arterial and delayed phases of CT images and between the delayed phase images of CT and those of MR imaging. A p value of less than 0.05 was considered significant. SPSS software (version 12.0.1, Statistical Package for the Social Sciences, Chicago, IL, USA) was used for the statistical evaluations. Inter-observer variability (Var) for the infarct size measured by the delayed phase images of CT and MR imaging was assessed with two-way random, single-measure intra-class correlation coefficient (ICC).
RESULTS
Radiation dose and stent patency
The mean longitudinal length for prospective gating was 13.1 ± 1.4 cm (range 12.3-15.5 cm) on the arterial phase of CT images and 12.6 ± 0.8 cm (range 12.4-15.5 cm) on the delayed enhanced phase of CT images. Mean patient radiation dose was 3.9 ± 0.5 mSv (range, 3.5-4.6 mSv) on the arterial phase of CT images and 3.8 ± 0.3 mSv (range, 3.6-4.7 mSv) on the delayed enhanced phase of CT images. Total mean radiation dose was 7.7 ± 0.5 mSv (range, 7.2-8.5 mSv) on the arterial and delayed enhanced phases of CT images.
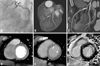
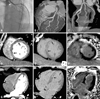
A total of 19 stents in 17 patients were evaluated. Of these, 12 had a beam hardening artifact without motion artifact, while 6 had a beam hardening artifact with mild motion artifact that did not limit lumen evaluation (2 in RCA, 3 in LAD, and 1 in LCx) (Figs. 1A-C and 2A-C). One stent demonstrated a severe artifact due to a beam hardening artifact and coronary artery motion, which would be an obstacle in evaluating luminal patency (1 in RCA).
Comparison between arterial and delayed phases of cardiac CT imaging
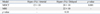
On the arterial phase of CT images, areas of hypoenhancement were visualized in 14 of 17 patients. Areas of delayed hyperenhancement were observed in all 17 patients on the delayed phase of CT images (Figs. 1D-F and 2D-I). Mean CT attenuation on the arterial phase of the CT images was 65 ± 19 Hounsfield Units (HU) in infarct myocardium and 104 ± 17 HU in normal myocardium. Mean CT attenuation on the delayed phase of CT images was 125 ± 23 HU in infarct myocardium and 89 ± 16 HU in normal myocardium. Delayed phase of CT images had a better CNR than arterial phase of CT images (4.3 ± 2.1% vs. 2.3 ± 1.7%, p < 0.01) (Table 2).
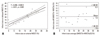
The mean area of hypoenhanced myocardium was 15 ± 10% (range, 0-34%) on the arterial phase of CT images and the mean area of hyperenhanced myocardium was 20 ± 10% (range, 4-38%) on the delayed phase of CT images. There was good correlation between the mean area of hypoenhanced myocardium on the arterial phase of CT images and the mean area of hyperenhanced myocardium on the delayed phases of CT images (Y = 6.296 + 0.928 X, r = 0.911, p = 0.001) with a mean difference of 5.2 ± 8.5% (p = 0.001) (Fig. 3) (Table 3).
Comparison between delayed cardiac MDCT and MR imaging
Delayed hyperenhanced areas were observed in all 17 patients on the delayed enhancement MDCT and MR imaging (Figs. 1E, F and 2E, F, H, I). Mean signal intensity on the delayed phase of MR images was 86 ± 30 arbitrary units (AU) in infarct myocardium and 14 ± 10 AU in normal myocardium. Delayed MR images had a better CNR than delayed phase of CT images (27.1 ± 17.8% vs. 4.3 ± 2.1%, p < 0.001) (Table 2).
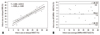
The mean area of hyperenhanced myocardium was 22 ± 10% (range, 4-36%) on the delayed MR images. There was good correlation between the mean area of hyperenhanced myocardium on the delayed phase of CT images and that of hyperenhanced myocardium on the delayed MR images (Y = 3.209 + 0.919 X, r = 0.935, p = 0.001) with a mean difference of 1.6 ± 7.3% (p = 0.10) (Fig. 4) (Table 3).
DISCUSSION
The major findings of the present study were that delayed MDCT images could show the myocardial infarct as a hyperenhanced area that was well correlated to the area measured by delayed cardiac MR imaging. Furthermore, arterial MDCT images could show the stent patency after doing PCI with stenting in patients with myocardial infarction. The total mean radiation dose, including the arterial and delayed phases of CT images, was below 8 mSv, which is clinically acceptable. However, a CNR was not good in the delayed phase of CT images when compared to the delayed MR images.
Cardiac MDCT has recently emerged as the promising diagnostic tool for infarct characterization, based on experimental studies in animals2,14-16 as well as by clinical studies in patients.10,17 The main problem in evaluating myocardial infarction using cardiac MDCT is radiation exposure. For 64-slice MDCT coronary angiography, dose values of up to 15.2 mSv for males and 21.4 mSv for females have been reported.6 The radiation exposure can, however, be reduced by technical adjustments such as ECG-dependent tube current modulation. This technique reduces the radiation exposure up to 47%, depending on the patient's heart rate.18 However, ECG-gating technique in cardiac CT imaging is still limited due to the repeated exposure to radiation necessary to acquire the arterial and delayed phases of CT images.
More recently, a new MDCT imaging protocol has been proposed with a prospective ECG-gating technique that limits radiation exposure to only predefined time points in the cardiac cycle, rather than during the entire cardiac cycle.11 Hirai, et al.19 reported that the calculated effective dose with prospective CT angiography was 79% lower than that with retrospective CT angiography. Although, the reduction in radiation exposure was not compared between prospective and retrospective ECG-gating techniques in our study, the former technique showed a mean effective dose of about 7.7 mSv during the combined studies of the arterial and delayed phases of CT images.
The advantages of a two-phase CT study are that the arterial phase of CT images can provide information of early perfusion status of the myocardium as well as information of the stent patency just after PCI with stenting in patients with myocardial infarction. In our study, the arterial phase of CT images showed good patency of the stent in most patients except a patient who has poor image quality of the stent due to severe motion artifact. The motion artifact is usually more severe in the right coronary artery.20,21 We also experienced more severe motion artifacts in the right coronary artery than in the left coronary artery, although we maintained a heart rate below 65 beats per minute. The motion artifact seemed to be caused by the limit in temporal resolution in our CT scanner, which had 420 msec of tube rotation time. Delayed CT imaging with prospective gating technique can effectively reveal myocardial infarction as a hyperenhanced area in spite of the relatively lower radiation exposure of about 3.8 mSv. The volume of myocardial infarction on the delayed CT images was well correlated with that on the delayed MR images, but there was no clinically significant difference between the two modalities.
Limitations
Our study has some limitations that should be overcome in the future. First, the study population was too small to generalize the results in all patients without arrhythmia. Second, there was no comparative study for evaluation of stent patency using the arterial phase of CT images. Third, we did not optimize the proper delay time for late enhanced CT images. The previous reports have suggested intervals ranging from 5 to 15 minutes after administration of contrast medium, which is similar to intervals used in MR imaging.2 However, dedicated injection protocols should be developed to optimize the contrast-to-noise ratio according to the amount of contrast media. Forth, we did not evaluate the presence of the hypoenhanced area within myocardial infarction, which is known to be the area of microvascular obstruction or no-reflow on the delayed phase CT or MR imaging. Finally, we did not consider manipulation of the kVp to reduce the radiation dose according to the patient's body weight. It may be possible to reduce the effective radiation exposure more effectively if we control the kVp according to the body mass index of patients in the future study.
Conclusion
The present study demonstrates that the delayed phase of CT imaging can depict a myocardial infarction as an area of increased attenuation values, which is similar to the pattern of myocardial enhancement on delayed MR images. The arterial CT images can be used to show the perfusion status, which has lower attenuation values in the infarct area, as well as to assess the stent patency in patients with PCI with stenting after myocardial infarction.

 XML Download