

 PDF
PDF ePub
ePub Citation
 Print
Print


INTRODUCTION
Blood pressure is an important parameter in the evaluation of cardiovascular function and status. It has generally been accepted that blood pressure control is significantly affected by the resistance in the peripheral vessels and cardiac output that correspond to the blood pressure control during systole and diastole, respectively. The cardiovascular system is a closed loop comprising the heart and blood vessels; its internal pressure is continuously changing due to changes in blood volume and vascular capacity. On the basis of this physiological foundation, change in blood pressure and vessel status can be evaluated by monitoring the change in blood flow.1-3
Photoplethysmography (PPG) is a noninvasive optical technology that detects changes in blood volume in the vascular system. It has been widely used with medical equipment that measures oxygen saturation and that can evaluate cardiac output, arterial resistance, aortic elasticity, blood pressure, heart rate, and other peripheral vascular diseases.4-6 A PPG signal is derived as a voltage signal generated by a photo detector for light with changes in the flow of blood; the light passes though the skin, arterial blood, venous blood, tissue, etc.7 A PPG can be divided into 2 components: alternating current (AC) and direct current (DC) component. The AC component of a wave implies pulsed blood flow in the artery, which is influenced by the contraction and relaxation of the heart. The DC component represents static blood flow in the artery, vein, and tissue.7-10
According to these previous studies, it is possible that the DC component reflects change in blood volume, and the AC component reflects vascular compliance and resistance. Moreover, a PPG can provide useful physiological information for evaluating the cardiovascular system along with blood pressure. Previous studies have researched these relationships with non-invasive blood pressure, general blood pressure range or only one PPG component.
In this study, forced hemodynamic changes were induced via commonly used cardiac stimulants in an animal experiment, and the PPG components recorded by a noninvasive method at the peripheral blood vessels were compared with the invasive blood pressure (IBP) findings. In addition, the cause of a blood pressure change induced by the infusion of dopamine and epinephrine was evaluat-ed via a pharmacological approach. Thus, the possibility of evaluating the cardiovascular system by using the PPG components was investigated.
MATERIALS AND METHODS
The experimental protocol was reviewed and approved by the Animal Research Committee of the Wonju College of Medicine, Yonsei University.
Subjects and experimental protocol
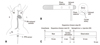
The study subjects included 6 dogs (20-25 kg), regardless of the gender. After an intramuscular injection of 25 mg/kg ketamine sulfate, endotracheal intubation was performed and anesthesia was maintained with 2% enflurane. Each anesthetized dog was fixed on a stand, and its respiration was maintained using an artificial ventilator. Fig. 1A shows the positions of the direct blood pressure sensor for IBP, electrocardiogram (ECG) electrodes, and PPG sensors. IBP was monitored by inserting a microtipped catheter into the right femoral artery, and the PPG signal was measured at the dog's tail because the tail is one of easiest areas to set a PPG sensor and one of best areas to acquire precious vascular information. The overall experimental procedure is shown in Fig. 1C. The experimental animals were stabilized for 15 min after the experimental preparation was completed. To induce a hemodynamic change, 16 mg/mL of diluted dopamine was injected into a vein for 2 min at the rate of 20 µg/kg · min-1 by using an infusion pump. Thereafter, the infusion pump was ceased, and 1 mg of epinephrine was intravenously injected in order to induce a stronger hemodynamic change.
Expected hemodynamic changes
Considering the pharmacological properties of dopamine and epinephrine, these two drugs are established as important frequently used cardiac stimulants.11-13 Dopamine (3, 4-dihydroxyphenylethylamine) is a precursor of norepinephrine and is produced by the decarboxylation of dihydroxyphenylalanine (dopa) during the biosynthesis of catecholamines.14 It is metabolized by monoamine oxidase (MAO) and catechol O-methyl transferase (COMT), and it becomes inactive after destruction in the digestive tract. During dopamine medication, depending on the concentration, it exhibits different hemodynamic effects on dopaminergic, β1-adrenergic, and α1-adrenergic receptors. In most cases, 160 mg dopamine is diluted in 100 mL of glucose solution to obtain a concentration of 16 mg/mL for i.v. administration. Different hemodynamic effects are exhibited depending on the dose.15,16 At a low dose (0.5-3.0 µg/kg · min-1), it mainly activates the dopaminergic receptor. At an intermediate dose (3.0-7.0 µg/kg · min-1), dopamine activates the β1-adrenergic receptors to increase the heart rate (HR) and cardiac output. At a high dose (> 10 µg/kg·min-1), it mostly activates the α1-adrenergic receptors in the vessels, and vascular constriction raises the blood pressure.15,17,18
Epinephrine is a hormone secreted from the adrenal medulla and is also known as adrenaline. Epinephrine is accepted as a stimulation transmitter in the sympathetic nerve, and epinephrine injection excites the β1-adrenergic receptors in the heart to enhance myocardial contraction via positive inotropic effects. Epinephrine increases the HR via positive chronotropic action and enhances the irritability of the cardiac muscle via positive bathmotropic action. Its positive dromotropic action reduces stimulus conduction.19,20 Thus, cardiac output increases; however, cardiac efficiency is reduced because of the remarkable increase in oxygen consumption in the cardiac muscle.13 A significant reduction in systole than in diastole is observed in the heart activated by epinephrine. Conclusively, the total number of diastoles per minute increases with the cardiac output.12,18 However, if the HR is increased beyond the physiological range, sufficient relaxation will not occur; therefore, cardiac output will be reduced. Epinephrine in the vessels simultaneously activates the α-receptor and β-receptors, but the activation of the α-receptors is dominant and manifested as vasoconstriction. Epinephrine is the strongest agent for increasing blood pressure, and an abrupt increase in blood pressure is noticed depending on the i.v. injection dose.19 This rise in blood pressure results from increased cardiac output due to enhanced myocardial contraction and the HR. Moreover, SBP increases abruptly to a value more than DBP, i.e., pulse pressure increases.11,13,20
Data collection and analysis
The PPG signal is influenced by external factors such as the distance between the light source and photodetector, contact force, and temperature.5 In our experiment, a band type PPG sensor (MAX-N, Nellcor, Pleasanton, CA, USA) was used to monitor the change in the waveforms obtained from the cardiovascular system and minimize the effect of contact force.10 To minimize the effect of temperature,21 ambient temperature was maintained at 24 ± 0.7℃. To measure the PPG signal, an infrared light-emitting diode (LED) with a center wavelength of 890 nm and a photodetector with a center wavelength of 900 nm were used. The signal was measured in the transmission mode. The DC component of the PPG signal detected by the photodetector, using an analog low-pass filter with a cut-off frequency of 20 Hz. Then the AC component of the PPG signal was extracted using a high-pass filter with a cut-off frequency of 0.15 Hz. Power Lab (ML880, ADInstruments, Bella Vista, NSW, Australia) with a 12-bit A/D converter was used to acquire signals at a sampling rate of 200 Hz per channel and digitize them. A constant current source circuit was used to drive the LED, and the amplification ratio was kept constant.
A pressure transducer (SPC-350, Millar Instruments, Houston, TX, USA) was used to measure the IBP, and the signals were acquired at a sampling rate of 200 Hz using Power Lab. The acquired data was additionally analyzed with LabVIEW 8.2 (National Instruments). The HR was detected from the ECG signal using a set of automatic programming routines involving the zero-crossing-Based QRS detection algorithm.22 SBP, DBP, and PPG components were detected using a set of automatic programming routines involving low-pass filtering, zero-phase filtering, differentiation, and threshold peak/foot detection algorithm.
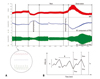
Fig. 2 shows that the PPG signal has the following components: transmission current (IT), absorption current (IA), pulsation current (IS), and cycle (R), which are related to the total current (I0). IT is inversely related to tissue blood volume, while IS is proportional to increase in blood volume during contraction periods. R is the actual cardiac cycle. Transmission and pulsation currents (IT and IS) usually fluctuate in a low-frequency range such as the respiration rate. Low-frequency fluctuation in the cardiac cycle is mainly controlled by the sympathetic nerve.23 Variation in blood flow (IA and IS) is generated due to vasoconstriction and vasodilation, both of which are significantly affected by the sympathetic nervous system.24 Therefore, PPG signal specifically provides information regarding blood volume as well as that on blood pumping and its transportation status.5 The IT component is used in studies that measure blood volume, while the IS component validates the existence of resistance in studies on the vascular compliance with the cardiovascular system, such as hypertension.25
Low-frequency fluctuation of IT and IS originates from automatic variations in the sympathetic nerve activity. Activation of the sympathetic nerve leads to vasoconstriction. This is the result of low compliance (high resistance) in the arterial system and reduction in blood flow in tissue, which results in the increase of IT and reduction of IS.9,26-28
To monitor the hemodynamic change induced after the drug injection, the HR, SBP, and DBP were measured every 30 sec for 15 min. For normalization, these parameters were also measured for 30 sec before the drug injection.
The absolute values for the DC and AC signals in the PPG were in different ranges because of the anatomical differences in the measured area for each subject. To compare the results of all the subjects under the same conditions, the average value for 30 sec before the injection was set at 1 and the average value for every 30 sec was normalized to analyze the 15-min data. These were used for comparing the changes in the PPG signal components with IBP pressure changes. With regard to the values of the PPG components, transmission current during systole (ITsys) and transmission current during diastole (ITdia) were detected from the foot and peak of the DC signal, respectively. Pulsation current (IS) was analyzed by the amplitude of the AC signal.
Statistical analysis
The statistical program used in this study was SPSS 12.0 (SPSS Inc, Chicago, IL, USA) for Windows. Statistical analyses were performed to evaluate the difference in response of data between two points of drug administration time for IBP, HR and PPG components by the Student t-test. The changes in the IBP, HR, and PPG components were expressed as means with standard deviations. Pearson's correlation coefficients were evaluated via the correlation analyses of the PPG components and IBP. For all statistical analyses, p < 0.05 was considered significant.
RESULTS
Variation in IBP & HR
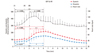
During the first 2 min of dopamine injection at the rate of 20 µg/kg · min-1, SBP increased from 92.3 ± 12.69 mmHg to 108.7 ± 20.23 mmHg, while DBP increased from 66.1 ± 10.75 mmHg to 81.8 ± 18.22 mmHg. After cessation of dopamine administration, blood pressure slightly reduced. After the intravenous (i.v.) injection of epinephrine, SBP, and DBP significantly increased from 102.6 ± 18.44 mmHg to 214.5 ± 23.82 mmHg and from 76.7 ± 18.28 mmHg to 153.0 ± 15.17 mmHg, respectively. Blood pressure was observed to be a maximum 2-3 min after the injection of epinephrine. In addition, the pulse pressure, i.e., the difference between SBP and DBP, also increased.
The HR before drug injection was 91.4 ± 12.69 bit/min, and the maximum HR was 122.9 ± 13.75 bit/min at 4 min after drug injection. During the injection of dopamine, the HR tended to show a consistent elevation. After the i.v. injection of epinephrine, the HR increased for 1 min and then reduced slightly (Fig. 3).
Variation in the PPG Components
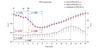
Before injection, the average values for 30 sec of DC and AC components of PPG were set at 1. After the injection, the average values for every 30 sec were normalized. After the drug injection, the changes in ITsys (foot of the DC component of PPG) and ITdia (peak of the DC component of PPG), which reflect changes in blood volume, were minimal with values of 0.70 ± 0.035 and 0.71 ± 0.035, respectively, at 5-6 min. The variations in IS (amplitude of the AC component of PPG), which reflect changes in vascular compliance and resistance, were maximized with the value of 1.024 ± 0.273 at 11-13 min (Fig. 4).
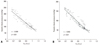
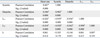
In regards to the variation in IT (the DC component of PPG) according to change in IBP in all the subjects, an increase in IBP indicated a significant reduction in ITsys and ITdia. In addition, the correlation coefficient between ITsys and SBP as shown in Table 1 was 0.939 (p < 0.01). It was 0.942 (p < 0.01) for DBP and ITdia. From these findings, a high correlation could be determined between IBP change and variation in the DC component of PPG (Fig. 5, Table 1).
DISCUSSION
This study aims to investigate the relationship between IBP and PPG components. The major purpose of this study was to investigate the possibility of monitoring the status of the cardiovascular system by using a noninvasive and inexpensive optical device, and provide information regarding the same. The change in the cardiovascular system due to cardiac stimulants, such as a change in IBP and the PPG components, was detected and analyzed by the presented animal experiments. The results indicate that the PPG components have a clinical potential to monitor the blood volume, the vessel resistance, and blood pressure. Therefore, a noninvasive and easy monitoring method for the evaluation of cardiovascular function was proposed.
At a high dose, dopamine enhances myocardial contractility and cardiac output through increased HR, resulting in an increase in SBP. In addition, DBP increases due to enhanced vasoconstriction.15,19 For the first 2 min of dopa-mine infusion, SBP and DBP showed an identical increase with the HR. This indicated a distinctive reaction of dopamine.
After the epinephrine injection, we confirmed that the increase in SBP was more than that in DBP. Thus, pulse pressure increased. Hence, dopamine and epinephrine, the experimental cardiac stimulants, were confirmed to increase the HR. Among the hemodynamic reactions, the change in the HR was faster than that in blood pressure (Fig. 3).
The measured signals in our animal experiment were the IBP and PPG. A PPG signal measures the transmission of light through tissue as a function of time. Due to the increment in blood volume in the tissue during systole, the PPG signal shows low transmission. In addition, light transmission is pulsating along with the cardiac cycle (Fig. 2).9
Increased blood pressure due to dopamine and epinephrine can be analyzed by the increase in cardiac output based on pharmacological basis.18,29 Therefore, reduction in ITsys and ITdia by the injection of dopamine and epinephrine can be explained by the increase in cardiac output. IS, which corresponds to vascular compliance, did not reveal any significant change after the dopamine and epinephrine injection. Even though after the injection of epinephrine the pulse pressure increased, a constant IS can be explained by vasoconstriction. In addition, the maximum variation in IS was found at 11-13 min, and it can be elucidated by the physiological relaxation of the peripheral vessels to reduce increased blood pressure (Fig. 4). On the basis of this result, we confirmed the possibility that a change in the cardiovascular system can be detected by measuring the PPG components noninvasively.
Hemodynamic variations induced by dopamine and epinephrine could be confirmed by the increase in the HR and blood pressure, as shown in previous studies. Direct and indirect changes in blood pressure due to dopamine and epinephrine and indirect changes in the vascular condition due to the hemodynamic variations were compared and analyzed through the animal experiment.
Previous studies on the effects of medical agents on the cardiovascular system have reported that a rise in blood pressure is induced by increased static volume of blood in the vessels of the measurement area.11-13 Our results are in close agreement with those of previous studies. Variation in the DC component of PPG, which was noninvasively measured at the periphery, could be confirmed to have significant relationships with the IBP (ITsys vs. systolic: r = -0.939, p < 0.01; ITdia vs. diastolic: r = -0.942, p < 0.01) (Table 1).
Together with the DC component, the AC component of PPG, which reflects vascular compliance and resistance, can show the physiological change in the cardiovascular system. Therefore, the AC component can predict increase and reduction in vascular resistance.
The undeniable advantage of PPG lies in its noninvasiveness and minimal restriction to patients.10 In addition, PPG in conjunction with pulse oximetry, which is usually used for patient monitoring, can predict the change as well as the pattern of change in the cardiovascular status.5 Moreover, PPG can be obtained from various locations in the human body, is rather inexpensive, and is a small-sized portable optical device.30,31
Thus, it fulfills the developmental conditions for a personal health monitoring and mobile physiological monitoring device. Although absolute accuracy in evaluating the cardiovascular system may not be achieved, PPG components may be useful for indirect monitoring of the cardiovascular function and status. Analysis results of PPG components along with physiological changes induced by medical agents will provide useful clinical information to a doctor.
The limitation of this study is that these results come from an animal experiment, but not from the human cardiovascular system. Furthermore, clinical trials require multiple restrictions, and the preliminary study was conducted via animal testing. In addition, the corresponding data was gathered from 6 dogs, which was a relatively small number of samples. Finally, only 2 cardiac stimulants were used to induce the change in the cardiovascular system, i.e., increase in the blood pressure.
Future studies will be required to ascertain the clinical applications of PPG components. Varied status changes such as vasodilation, reduced blood volume, reduced blood pressure, etc., should be induced in a large number of subjects with varying ages, and normal groups should be compared with the groups with disorders of the cardiovascular system. In addition, clinical trials on human patients within a range of safe and ethical treatment will enhance the value of this research. A device that can directly measure the resistance or elasticity of blood vessels along with blood flow may provide a more profound authenticity of PPG components through comparative analysis. Finally, the effect of external environments such as temperature and contact force was controlled in our experiment, but the evaluation and optimization of the restricting conditions should be performed after considering comprehensive external factors to enhance the clinical significance of this study.
In conclusion, photoplethysmography is a noninvasive, simple, and inexpensive optical technology for monitoring changes in blood flow in the peripheral vessels. In this study, hemodynamic changes were forcefully induced. The IBP, HR, and PPG components were measured and analyzed in 6 dogs. In summary, the current study indicates that the DC component of PPG is inversely proportional to static blood volume in the vessels and tissues. In addition, the AC component of PPG shows subtle changes in the arterial system due to cardiac contraction and relaxation and provides information regarding vascular compliance and resistance. Therefore, these results support the possibility that the PPG components may be used for easy and noninvasive measurement of hemodynamic changes in the cardiovascular system such as blood pressure. Further studies on PPG components will strengthen their potential for use in clinical applications.
 XML Download