

 PDF
PDF ePub
ePub Citation
 Print
Print


INTRODUCTION
Spirometry is essential for the diagnosis and severity staging of chronic obstructive pulmonary disease (COPD). The 2008 Global Initiative for Chronic Obstructive Lung Disease (GOLD) guidelines1 recommended a simple classification of disease severity into four stages, using forced expiratory volume in one second (FEV1) of the predicted value, and where all values refer to post-bronchodilator FEV1. Bronchodilator test (BDT), however, is not always performed in clinical practice and the staging of COPD severity is frequently based on pre-bronchodilator spirometry.
For the past few years, an increasing number of articles on COPD have used the GOLD guidelines for severity staging. Although there were studies apparently using the post-BDT spirometry for COPD staging,2-4 a number of previous studies have also used pre-bronchodilator values, or did not specify which one was used when applying the GOLD guidelines.5-8 While irreversible airflow obstruction is the hallmark of COPD, many patients with COPD have a reversible component.9 It must be acknowledged, however, that in COPD patients, the staging of severity using pre-BDT spirometry tends to be overestimated due to some limitation of airflow reversibility in COPD. In the absence of such measurements, it may not be possible to classify subjects into the COPD severity stages.10
The purpose of this study was to evaluate the differences in COPD severity staging by comparing pre- and post-bronchodilator spirometric data.
MATERIALS AND METHODS
Patient selection
From 2000 to 2004, consecutive patients with a physician diagnosis of COPD and referred to the Lung Function Laboratory of the National Taiwan University Hospital for BDT were recruited. The diagnosis of COPD was based on the medical history, symptoms, chest radiograph and spirometry. The diagnosis was confirmed by the lung function criteria of the GOLD guideline.1 Patients with other chronic respiratory diseases (occupational lung disorder, bronchiectasis, interstitial lung disease, tuberculosis, or malignancy), previous thoracic surgery, or a history of asthma were excluded. Patients who had used an inhaled short-acting bronchodilator within the previous 12 hours or an inhaled/oral long-acting bronchodilator within the previous 24 hours were likewise excluded.
Measurements
Spirometry was performed with a computerized spirometer (MST-PFT, Germany) by a trained technician according to the American Thoracic Society (ATS) criteria.11 The tests were performed with the patient seated in an upright position, and using a nose-clip and breathing through a non-compressible mouthpiece. After taking baseline measurements, all of the patients inhaled 400 µg of fenoterol (Boehringer Ingelheim Ltd, Burlington, Ontorio, Canada). Spirometry was repeated 30 minutes after inhalation of the bronchodilator.
A positive BDT was based on the criteria set by the ATS12 [increase in either FEV1 or forced vital capacity (FVC) by 12% of baseline, and at least 200 mL] and by the European Respiratory Society13 (ERS, increase in FEV1 by 10% of predicted values). Using both the pre- and post-BDT FEV1 percentage of predicted value14 when the FEV1/FVC ratio was < 70%, the severity of COPD was classified into: Stage I (mild; ≥ 80%), Stage II (moderate; 50 to 79%); Stage III (severe; 30 to 49%); and Stage IV (very severe; < 30%) according to 2008 GOLD guidelines.1 Non-COPD was noted when the FEV1/FVC ratio was ≥ 70%.
Measurements before and after BDT were compared, including spirometric parameters (FEV1, FVC, and FEV1/FVC ratio), with the severity staging of COPD. The correlation between bronchodilator response and pre- or post-BDT FEV1 were analyzed. Finally, the differences in severity staging by pre- and post-BDT spirometry in responders and non-responders were compared.
Analysis
The clinical variables recorded included age, gender, body mass index, and smoking status. Data are expressed as mean ± standard deviation (SD) for continuous variables or number (percentage) for categorical variables. Categorical variables were analyzed by the χ2 test. The paired-sample t-test was applied to compare pre- and post-BDT spirometry. In order to investigate the dependence of continuous variables, linear regression analysis was applied and the Pearson correlation coefficient was used as a measure of the extent of the relationship. p values of < 0.05 were considered statistically significant. All of the statistical analyses were performed using the statistical software SPSS Version 10.0 (SPSS Inc, Chicago, IL, USA).
RESULTS
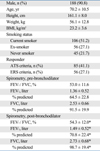
The demographic data of the 207 patients in this study are shown in Table 1. All of the following data had normal distribution, as checked by the D'Agostino-Pearson test: body mass index (p = 0.287), FEV1 percentage of predicted value (pre-BDT: p = 0.076; post-BDT: p = 0.201), and FVC percentage of predicted value (pre-BDT: p = 0.312; post-BDT: p = 0.324). The mean changes of FEV1 and FVC after BDT, expressed by absolute value, percentage of baseline, and percentage of predicted value, were 0.13 ± 0.14 and 0.20 ± 0.25 liter, 11.8 ± 12.5% and 8.9 ± 11.5%, and 6.3 ± 6.3% and 7.2 ± 8.7%, respectively. The changes in FEV1 during BDT were weakly correlated with the pre-BDT FEV1 (r = -0.2, p = 0.004) but not with post-BDT FEV1 (p = 0.26) values. Of the 207 patients, 85 (41.1%) and 56 (27.1%) were classified as responders by the ATS and ERS criteria, respectively.
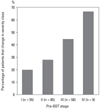
The results of COPD severity staging using pre- and post-BDT FEV1 are demonstrated in Table 2. Fifty-five (26.6%), 85 (41.1%), 58 (28.0%), and 9 (4.3%) patients were classified as Stage I, II, III, and IV, respectively, using pre-BDT spirometry, and 12 (5.8%), 66 (31.9%), 88 (42.5%), 38 (18.4%), and 3 (1.4%) patients were classified as non-COPD, and Stage I, II, III, and IV, respectively, using post-BDT spirometry. The 12 patients classified as non-COPD after BDT either came from pre-BDT Stages I or II. As a whole, 67 (32.4%) patients had pre-BDT stages different from post-BDT stages. In patients with pre-BDT Stage I to IV, 11 (20.0%), 24 (28.2%), 26 (44.8%), and 6 (66.7%) patients changed their severity staging after BDT (Fig. 1). The relation between percentage and pre-BDT stage was statistically significant (p = 0.004). Among the responders according to both the ATS and ERS criteria, more patients changed their severity staging after BDT than the non-responders.
DISCUSSION
In the present study, we demonstrated a significant difference in the severity staging of COPD patients by pre-BDT spirometry instead of post-BDT spirometry. We also observed that patients with a higher pre-BDT severity staging were more likely to change their staging based on post-BDT spirometry. Furthermore, even in the so-called "non-responders", changes in severity staging accounted for a substantial proportion of COPD patients.
In our study population, the mean bronchodilator response in FEV1 was 0.13 liter (11.8% of baseline) while 85 (41.1%) and 56 (27.1%) of all COPD patients were classified as responders according to the ATS and ERS criteria, respectively. These data were comparable with previous reports.15,16 In the study by Perng and co-workers,15 48 (55%) among 88 smoking-related COPD patients were classified as responders according to the ATS criteria, with a mean change in FEV1 of 0.18 liter (14.4%). In another series,16 the mean bronchodilator response among 123 COPD patients with a mean FEV1 of 48.9% was 0.15 liter (10%), and 58 (47%) and 19 (15%) patients were classified as responders according to the ATS and ERS criteria, respectively. Therefore, a significant change in staging could not simply be attributed to a more "asthmatic" COPD population in the study.
We observed that the possibilities of changing severity staging after BDT were associated with pre-BDT stages. It seemed that the more severe the pre-BDT stage, the higher the probability of difference. It could be partially explained by the weak and inverse correlation between pre-BDT FEV1 and changes in FEV1 percentage of predicted values after BDT. This association was also demonstrated by Perng, et al.,15 but not by Quadrelli, et al.17 and Calverley, et al.18
Another explanation of the stage-related incidence is the diverse FEV1 intervals of the severity stages. In Stage III COPD, the narrower FEV1 interval (30% to 49%) resulted in a higher incidence of staging difference than Stage II COPD. Furthermore, in Stage IV COPD, the FEV1 actually ranged from 23% to 29% in our study, leading to the highest percentage of staging difference.
In our study, 12 of the patients with pre-BDT Stages I-II had an FEV1/FVC ratio ≥ 70% after BDT (Table 2). Since COPD, by definition, is never completely reversible, the question arises on whether or not the diagnosis of COPD is accurate. In view of the facts that the pre-BDT FEV1/FVC ratio (68.1 ± 1.7%) approximated the cut-off value in these patients and that the increase of FEV1 in most (75%) did not exceed the 95% confidence interval after placebo inhalation,19 caution should be exercised in interpreting these results.
Of special interest was a 79-year-old man whose FEV1 values decreased from 81.5% to 75.3% of predicted value after BDT, leading to a shift in COPD severity from stage I to stage II. This might result from a paradoxical response to inhaled fenoterol with a chlorofluorocarbon metered dose inhaler (CFC-MDI). In a study involving 679 patients with chronic airway obstruction, the incidence of paradoxical reaction (defined as a fall in FEV1 of > 15% following inhalations of ipratropium/fenoterol with CFC-MDIs) was 1.2%.20 In an another study,21 the incidence of asymptomatic drop in FEV1 > 15% in 1,538 COPD patients was 1.8%. Another possibility for the decrease in FEV1 is that bronchoconstriction might be triggered by repeated maximum respiratory maneuvers during spirometry.22
In the current GOLD guidelines,1 patients with FEV1 < 50% of predicted plus the presence of chronic respiratory failure should be classified as Stage IV COPD, even if the FEV1 is > 30% of predicted value. In our study population, only three patients were in GOLD stage IV, and none of the patients with FEV1 < 50% had chronic respiratory failure. One of the possible reasons for this is that these patients usually cannot tolerate the procedure of spirometry. Another explanation is that results of arterial blood gases were not available in the majority of our patients.
We observed in this study that more than half of BDT responders, defined either by the ATS or the ERS criteria, had a different severity staging after BDT. It was noteworthy that changes in staging even among non-responders were observed in about one-fifth. Since the criteria are arbitrarily set, the use of pre-BDT spirometry for COPD severity staging in non-responders is also inappropriate.
Regular treatment with inhaled glucocorticosteroids is recommended for Stage III and IV COPD patients with repeated exacerbation to reduce the frequency of exacerbations.1 In our study, 44.8% of pre-BDT Stage III patients became Stage II after BDT, suggesting that selection of pre- or post-BDT FEV1 might have a significant impact on the indication of ICS in COPD patients which were shown to be a risk factor for fracture.23,24
It is well recognized that day-to-day variation of bronchodilator response to β2-agonist exists,25 and that the maximal attainable FEV1 is the best spirometry index in survival prediction.15 The past work has shown that eosinophilic inflammation may play a substantial role in COPD.26 Hence, a real ceiling of spirometry by a course of steroid may be achieved in some COPD patients. However, the benefits of such measures remain unclear.
In conclusion, the use of pre-BDT spirometry for COPD severity staging may lead to significantly different results from those based on post-BDT spirometry. It seems that a stricter application of the GOLD or the ATS guidelines, using post-BDT spirometry, should be emphasized, even in so-called "non-responders".

 XML Download