

 PDF
PDF ePub
ePub Citation
 Print
Print


INTRODUCTION
Despite inherent limitations for sensitivity and specificity, magnetic resonance (MR) imaging is generally used for the localization and staging of prostate cancer, because of its ability to discriminate zones and show anatomic details of surrounding structures.1,2 Recently, 3T scanners have been installed in clinics for body imaging. The increased signal-to-noise ratio (SNR) of these scanners is expected to improve the performance of prostatic MR imaging. One study has reported that the quality of T2-weighted (T2w) prostate imaging from a 3T with a torso phased-array coil was comparable with the same imaging obtained from a 1.5-T using endorectal coil.3
In the daily practice, prostate MR imaging is indicated to patients with increased serum prostate-specific antigen (PSA) level in the surveillance studies before or after confirmation of the presence of prostate cancer by ultrasonography-guided transrectal biopsy. For such patients, the main purpose of MR imaging is to stage lesions to determine the indication of curative surgery in addition to localization of the lesions. For staging the disease, accurate localization of the lesion is a prerequisite. Although T2w imaging has been used as a standard sequence in the assessment of prostate cancer, it shows an inevitable limitation in the lesion detection, depending on the intra- and extralesional consistency or post-biopsy hemorrhage,4-6 although dynamic contrast-enhanced imaging provides increased accuracy in localizing and staging prostate cancer in several studies.7-9
At the time of protocol setting for a new 3T unit without using an endorectal coil, IV contrast material-enhanced multiphasic dynamic imaging was included in the routine protocol for prostate cancer. Moreover, we assumed that a subtraction technique of precontrast images from postcontrast images would improve the sensitivity for minimal changes of intra- or extralesional vascularities to improve detection of small and/or slightly hypervascular area, especially in or around the precontrast T1-weighted (T1w) hyperintense lesions which might be related to recent biopsy-induced hemorrhages.9 The aim of our study was to determine the added value of dynamic subtraction in the MR imaging protocol, which consisted of fast T2w imaging and multiphasic dynamic imaging, for the localization of prostate cancer with a 3T unit using a phased-array body coil.
MATERIALS AND METHODS
Patients and MR imaging
Approval for this retrospective study was obtained from our institutional review board, which waived the requirement for informed consent of individual patients. A retrospective search of electronic medical records revealed 75 consecutive patients examined by dynamic prostate MR imaging during a 14-month period (from November, 2004 to December, 2005). Twenty-one patients (age range, 46-75 years; mean age, 62.5 years) who underwent radical prostatectomy during the study period without hormonal or anticancer chemotherapy were enrolled in this retrospective analysis of prostate MR imaging findings. Biopsy procedures preceded MR imaging by an average of 8 days (ranging from 2 to 16 days) in 19 patients. For 2 patients, biopsy was performed after the MR imaging. All 21 patients underwent radical prostatectomy within 60 days after MR imaging (from 1 to 55 days; average, 25.5 days). The serum PSA level just before biopsy and/or MR imaging ranged from 5.0 to 39.1 ng/mL (mean, 11.2 ng/mL).
MR imaging was performed with a 3T unit (Signa EXCITE, GE Medical Systems, Milwaukee, WI, USA) and a 4-channel phased-array body coil. After obtaining localizer images, T2w fast spin-echo images (TR/TE, 4000/116 msec) were obtained in the three planes (axial, sagittal, and coronal). T2w imaging scan parameters were as follows: TR/TE, 4000/116 msec; echo train length, 14; slice thickness, 4 mm; interslice gap, 0.5 mm; 512 × 320 matrix; field of view, 25 cm; number of acquisitions, 1; number of slices, 20; voxel size, 0.5 × 0.5 × 4 mm (1 mm3). Dynamic contrast-enhanced imaging was obtained using a 3D gradient echo sequence (LAVA; GE Medical Systems, Milwaukee, WI, USA) with ultrafast image reconstruction by parallel imaging algorithms (ASSET factor, 2) in the axial plane (TR/TE, 3.9 - 4.2/1.0 msec; flip angle, 10°; matrix, 320 × 160; slice thickness, 4 mm; field of view, 25 cm). Dynamic images were scanned from the apex to base of the prostate, and a total of 20 slices were obtained during 16 sec. A dynamic series consisted of 1 precontrast series, followed by three postcontrast series. Postcontrast series were performed after administrating a bolus injection of 15 mL of gadopentetate dimeglumine (Magnevist; Schering, Berlin, Germany) at a rate of 2 mL/sec followed by a saline flush using a power injector. The first postcontrast image acquisition was started just after the contrast material appeared on the abdominal aortic bifurcation level when monitoring the real time coronal imaging of the 3D gradient echo sequence (TR/TE, infinite/1.4 to 11 msec; flip angle, 10°; slab thickness, 20 mm) followed by the second postcontrast imaging 35 seconds after the initiation of the first postcontrast imaging. A 5-minute delayed phase series was added. After then, precontrast images were subtracted from the corresponding postcontrast images of each phase on the MR imaging console and routinely attached to the scan data. All scans were sent to PACS (picture archiving and communication system) for interpretation on PACS workstations.
Pathologic examination
The prostatectomy specimens were fixed overnight in 10% neutral buffered formalin solution. Step sections were made at 4-mm intervals in a plane parallel to the base of the prostate perpendicular to the longitudinal axis of specimen. These sections corresponded to the sections used for axial MR imaging. All sections were routinely embedded in paraffin. Four micron tissue sections were prepared and stained with hematoxylin-eosin. Regions representing cancer were outlined on the glass cover that extended from the base to the apex of the prostate.
Data analysis
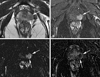
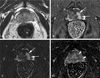
The T2w images, the conventional dynamic images (DYN), and the combination of conventional and subtracted dynamic images (SUBT) were interpreted independently by two observers; 1 with 10 and the other with 12 years of experience of body MR imaging. These observers were blinded to both location of the lesions and pathological findings. To facilitate anatomic localization, subtraction images were always interpreted with corresponding conventional dynamic images. On T2w images, an area in the PZ with relatively low-signal intensity was considered to represent malignancy (Fig. 1). Due to decreased specificity of low-signal-intensity areas in the central gland (CG), only hypointense lesions showing asymmetric bulging were interpreted as being malignant in the CG. On DYN and SUBT, a lesion was considered to represent malignancy if there was an enhancement on the first and/or second phase postcontrast images that was distinguishable from background PZ combined with the wash-out appearance on delayed phase images (Figs 1 and 2).
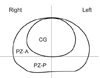
The prostate was divided into the following 6 areas: an anterior and posterior portions of PZ (PZ-A, PZ-P) and a CG on each side (Fig. 3). In lesions involving 2 or more anatomic zones continuously, each of the involved zones was designated to have the lesion. The presence of the tumor was subjectively scored on a 5-point scale in each area: 1 = definitely absent; 2 = probably absent, 3 = indeterminate, 4 = probably present, and 5 = definitely present.
After the subjective determination of the presence of lesion in all 126 zones from 21 patients, the glass slides of the tissue sections with the outlined lesions were reviewed to determine their actual location and volume. For the 81 prostate cancer lesions separately outlined by initial pathological examinations, the longest diameter of each lesion was measured by calipers, and the shorter diameter was measured along the perpendicular direction on the same slide. The axial dimension of each lesion was determined depending on the number of continuous slides of each lesion, multiplied by the section thickness (0.4 cm). All measurements were multiplied by a factor of 1.1 to correct for tissue shrinkage due to fixation. The area of tumor involvement for each lesion was determined by using the ellipsoid formula. The MR images were reviewed by the same observers again together for a retrospective lesion-by-lesion analysis to determine the detection rate on the T2w images, DYN, and SUBT according to the size of the lesions.
Statistical analysis
For the 5-grade scoring of tumor localization in the 6 separated zones from each patient, κ statistics was used to measure the level of agreement between the readers in T2w images, DYN, and SUBT, respectively. A κ value greater than 0 was considered to indicate a positive correlation in the following increments: marginal, 0.01 - 0.40; good, 0.41 - 0.70; and excellent, 0.71 - 1.00. Receiver operating characteristic (ROC) analysis was performed to compare the results of the readings from the three imaging techniques, and the diagnostic capability was determined by calculating the area under ROC curve (Az) for each reader. According to the zonal location of lesions (PZ-P, PZ-A, and CG), the diagnostic capabilities of imaging techniques were also compared using ROC analysis.
Sensitivity, specificity, and positive predictive value (PPV) for each imaging technique was calculated as follows: sensitivity = (number of grade 4, 5 prostate cancers/total number of zones having prostate cancer) × 100, specificity = (number of grade 1, 2, 3 prostate cancers absent/total number of zones without prostate cancer) × 100; and PPV = [number of grade 4, 5 prostate cancers detected/(number of grade 4, 5 prostate cancers + number of grade 4, 5 absent from prostate cancer)] × 100.
After calculating the detection rate of the 81 histologically verified lesions through a lesion-by-lesion analysis, the mean size of the detected lesions from each imaging technique was compared to each other using a T-test. P < 0.05 was considered to indicate a statistically significant difference.
RESULTS
Among 126 zones from 21 patients, 60 zones (48%) contained 1 or more separated tumors (right PZ-P, n = 7; right PZ-A, n = 12; right CG, n = 12; left PZ-P, n = 13; left PZ-A, n = 5; left CG, n = 11), and a total of 81 lesions were pathologically verified as prostate cancers (Gleason score: ranged from 5 to 8; mean, 6.5 for the main largest lesions in each patient). The interobserver agreement in determining the presence of the lesions in the 126 zones was good for each of the three imaging techniques (T2-weighted imaging, κ = 0.627; conventional dynamic imaging, κ = 0.623; subtraction dynamic imaging, κ = 0.577).
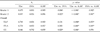
With regard to the Az values, which represented diagnostic accuracy of tumor localization through ROC analysis, SUBT showed significantly higher values than T2w imaging (p < 0.001 for two readers) and DYN (reader 1, p = 0.002; reader 2, p = 0.007) (Table 1). For the PZ lesions, SUBT showed higher overall accuracy for the lesions than T2w imaging and DYN (p < 0.05). For lesions located in the CG, the overall accuracy of DYN and SUBT was significantly higher than T2w imaging (p < 0.05), but there was no significant difference between DYN and SUBT (p > 0.05) (Table 1).
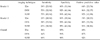
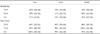
For all 126 zones (six zones in each of the 21 patients), the specificities for determining the presence of the tumor were comparably high in all three imaging techniques (85 - 95%). However, overall sensitivities were only 36% for T2w images, 46% for DYN, and 69% for SUBT (Table 2). With regard to the tumor locations, the rates of correct localization were comparable for the SUBT (68 - 70%), however, the detection rate in the CG lesions was very low in T2w imaging (11%) compared the detection rate in PZ lesions (Table 3).
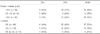
The pathologically verified tumor volume ranged from 0.003 cm3 to 4.14 cm3 (median, 2.07 cm3; mean, 0.47 ± 0.79 cm3) for the 81 lesions. For the 26 lesions that were larger than 0.5 cm3, DYN and SUBT showed a much higher detection rate (77% and 88%, respectively) than T2w imaging (35%) (Table 4). Even in the subclinical smaller lesions (< 0.5 cm3), 26 (55%) of 45 lesions were detected with SUBT (T2w imaging, 9.1%; DYN, 40%). The mean volume of the lesions detected with SUBT (n = 49, 0.69 ± 0.94 cm3) was smaller than the mean volume detected by T2w imaging (n = 14, 1.05 ± 1.12 cm3) or DYN (n = 43, 0.71 ± 0.97 cm3), however, no statistically significant difference (p > 0.05) was found between the three groups. For anatomical locations, DYN or SUBT showed considerably improved detection rate even in the CG lesions in which the sensitivity of T2w imaging was the worst (Table 4).
DISCUSSION
In recent decades, T2w imaging has been the standard imaging sequence used to define prostate cancer as a hypointense lesion distinguishable from background parenchyma.1 The results derived from this study and other previous reports,4,5,8 however, are not enough to advocate independent use of T2w imaging for prostate cancer localization in clinical practice. As mentioned by Quint LE et al,4 the T2w signal intensity is dependent only on tissue optical density rather than the degree of malignant differentiation of the tumor cells. The hypointensity of the lesion cannot be distinguished from the adjacent or surrounding fibromuscular stroma with small water content as well as from old hemorrhages, prostatitis, or dystrophic changes,1,4,10 In CG, the hypointensity of cancer is not different than the most common benign hyperplasia in elderly patients, a circumstance that worsens the diagnostic accuracy for the CG lesions.10-12 The rate of correct prostate cancer zonal localization was very low (11%) in CG, and overall Az value of the T2w imaging in the CG [0.646] was lower than in the PZ [0.748]. In our study, the detection rate with T2w imaging was too low (35%), even in the clinically important larger lesions (> 0.5 cm3).13 This result might partially be due to the suboptimal SNR that originated from a long echo train length in the fast imaging sequence.
Many investigators reported improved accuracies in localization and staging of prostate cancer by using dynamic imaging.8,14,15 Depending on the relative peak enhancement, this technique can distinguish the tumor from surrounding parenchyma and reflects tumoral vascularity, a quality that cannot be achieved by T2w imaging.8 Ogura et al.14 suggested that prostate cancer can be detected as an enhanced area on early phase images within 1 minute after the start of intravenous contrast injection. In a relatively recent study by Engelbrecht MR et al.5 wash-out appearance of contrast agent after the early enhancement was the most reliable finding for diagnosis of CG tumors. In clinical practice, however, hyperintensity of parenchymal hemorrhages from recent ultrasonography-guided transrectal sextant biopsy procedures can contaminate the background signal intensity of the prostate on precontrast T1-weighted images. In the present study, 19 out of 21 patients underwent ultrasonography-guided biopsy from 2 to 16 days before the MR imaging, and 17 of the 19 patients showed T1-weighted hyperintensity areas with variable signal intensities, numbers and extents especially in PZ. To avoid the effects of post-biopsy hemorrhages, it is recommended that MR imaging should be performed at least 3 weeks after biopsy.6 However, like most of the patients in our study, many clinicians do not abide by this principle.
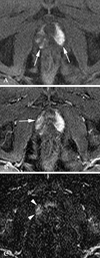
Subtracting precontrast images from postcontrast images generally provides better tissue contrast for assessing hypervascular lesions or small vascular structures. This is accomplished by eliminating the background signals from the contrast enhanced MR imaging of various organs and tissues.16,17 For prostate cancer, only 1 report has dealt with the subtraction technique using single level dynamic imaging in a 1.5T unit.9 In our study, review of dynamic images in conjunction with the corresponding subtraction images enabled more accurate localization of the tumor (Fig. 4). The distinguishing diagnostic ability of subtraction imaging might be due to increased contrast resolution of hypervascular enhancing lesions after the subtraction of hypovascular background structures.
With regard to the zonal location, PZ-P tumors tended to be easily characterized by peak enhancement that is distinguishable from the surrounding parenchyma. However, the normal or hyperplastic CG also shows early enhancement and cannot easily be distinguished from prostate cancer by the enhancement pattern alone.18 By the same reasoning, correct delineation of PZ-A lesions that extend to the CG is also problematic. Like a previous report by Engelbrecht et al.5 the washout appearance of the prostate cancer on delayed phase images was helpful to determine the presence of lesions involving CG. In our study, the sensitivity for the zonal localization of lesions was comparable between the PZ-P, PZ-A and the CG when using SUBT and suggested that combined interpretation of dynamic images and subtracted images has a merit in recognizing the washout appearance on delayed phase imaging which is distinguished from normal glandular structures or other benign conditions.
In the present study, all of the pathologically verified lesions were reviewed by lesion-by-lesion analysis of 2 readers in the second session regardless of tumor size, and the detection rate of the smaller lesions (< 0.5 cm3) was still low (under 50%). For the clinically important lesions larger than 0.5 cm3, the detection rate with SUBT (88%) was comparable with DYN (81%) (Table 4). This result differs from the results of our ROC analysis that was used to determine the zonal locations in a blinded manner (Table 1). We thought that knowledge of tumor presence in pathological slides could influence tumor recognition in the DYN during the second review session by the same readers working collaboratively. For the recognition of diffusely infiltrative lesions, there would be no comparable normal parenchyma to distinguish the tumor from the surrounding parenchyma. In our study, we did not separately review the detection rate depending on lesion shape, however, we realized that localization of markedly elongated or irregular/amorphous lesions was more difficult than for spherical mass forming lesions. The elongated or amorphous lesions tend to be confused with inflammatory lesions.19
This study has several limitations. First of all, with the knowledge of inherent limitations of the T2w imaging described previously, the fast spin-echo T2w imaging sequence was not optimized for a novel prostate imaging in the 3T unit of our institution. With adding the dynamic imaging, the imaging protocol was primarily designed to minimize the entire imaging time, and the T2w imaging data was only used supplementarily in the clinical imaging. Therefore, it was basically not fair to compare the sensitivity between T2w imaging and dynamic imaging regardless of subtraction. In the present study, we just proved significantly low sensitivity of fast T2w imaging for assessment of prostate cancer regardless of the size of the lesions. More recently, diffusion-weighted imaging (DWI) has been applied for prostate imaging in the 3T unit and it showed a potential to overcome the low sensitivity of T2w imaging to improve sensitivity in the localization of prostate cancer.20 It is beyond the scope to discuss the efficacy of DWI with additional acquisition time, however, a future comparative study between the dynamic subtraction imaging and DWI would be needed to optimize the imaging protocol of prostate in the 3T unit. Secondly, even in multiphasic dynamic imaging, only 3 phase postcontrast imaging data were obtained and we could not draw a detailed time-intensity curve of additional multiple successive image acquisitions. However, the standard prostate MR imaging protocol has not yet been established, and we thought that the 2 early phased image acquisitions within 1 minute would be enough to recognize a tumor enhancement.12,21 Furthermore, we also thought that the single 5-minute delayed image acquisition would be enough to recognize the washout appearance of prostate cancer, distinguished from other benign conditions.22 We do not believe that any additional postcontrast imaging data would change our study results with regards to the value of SUBT. We did not investigate the cause of any false positive findings. Moreover, extracapsular tumor extension for tumor staging was not analyzed. This was a retrospective study for patients treated by radical prostatectomy, which was the primary treatment of choice after the initial MR imaging interpretation for subjected patients. For this study design, selection bias for tumor staging cannot be avoided, and tumor staging is beyond the scope of this study. Lastly, due to poor details of anatomic landmarks, subtraction images alone cannot be interpreted in clinical practice, and there is an inevitable bias in comparison of DYN with SUBT which contains all of the conventional dynamic imaging information.
In conclusion, automatic subtraction of pre-contrast images from multiphasic postcontrast dynamic images is a feasible method and significantly improve overall accuracy in the diagnosis of PZ prostate cancer which is contaminated by post-biopsy hemorrhages. This technique also could improve the tumor detection by higher reliability of washout appearance of the lesions, independent of the zonal location of prostate cancer. MRI protocol used in the present study was not optimized for the high strength unit and rather similar with the protocol using 1.5T unit. In this situation, the subtraction technique is not a specific technique for 3T unit, and the merit of this technique can also be generally applied in 1.5T systems.
 XML Download