

 PDF
PDF ePub
ePub Citation
 Print
Print


INTRODUCTION
The metabolic syndrome (MS) is characterized as the clustering of dyslipidemia, hypertension, hyperinsulinemia, and central obesity and constitutes a risk factor for cardiovascular disease (CVD). Moreover, MS confers greater risk than a single risk factor for CVD.1,2 The rate of the MS in the United States was estimated at 23.7%3 using the criteria of the Third Report of the National Cholesterol Education Program Adult Treatment Panel (NCEP-ATP III),4 while in Korea, the rate of this syndrome has increased from 23.6% in 1998 to 28.0% in 2001 based on the KNHANES.5
Recently, many studies have shown that the rate of the MS in children and adolescents has increased.6-11 The main finding of those studies was that the prevalence of the syndrome was higher when the subjects were obese, and thus the researchers stressed that the prevalence of the MS would increase with the numbers of obese children and adolescents.9,10 However, no standard exists for diagnosing this syndrome in children and adolescents, and it is difficult to compare the prevalence of the MS across nations and studies. The criteria used for diagnosing the MS vary. The Quebec City study used skin thickness instead of waist circumference, mean blood pressure, and blood insulin,12 while a study of Hungarian children used body fat instead of waist circumference.13 In addition, different researchers have modified the MS criteria of the NCEP-ATP III differently for children and adolescents. Of the modified NCEP-ATP III criteria, those of Cook et al.,6 Cruz and Goran,7 and Ferranti et al.8 are generally used. The three sets of criteria suggested a cutoff point for high blood pressure using the sex-, and age-specific 90th percentile. In Korea, too few studies have been conducted to establish criteria for the MS in children and adolescents.9,10
In this study, we compared the prevalence and agreement rate of the MS according to the criteria of Cook et al., Cruz and Goran, and Ferranti et al. in Korean children and adolescents, using subjects from the 2001 KNHANES.
MATERIALS AND METHODS
Data source and subjects
The data were derived from the 2001 KNHANES conducted by the Korean Ministry of Health and Welfare. KNHANES surveys have been conducted as a cross-sectional health survey of nationally representative samples of noninstitutionalized civilian South Koreans at 3- to 4-year intervals since 1992.14
Data were collected from a stratified multistage probability sample of South Korean households. Examiners selected 4,400 households from the 13,200 primary sampling units, so the health behavior survey was consisted of 10,368 individuals aged 12 and older. The KNHANES survey involved face-to-face interviews by trained interviewers, and consisted of five components: the health interview, health consciousness and behavior survey, nutrition survey, and medical examination survey. In all, 9,170 individuals completed the interviews and the response rate was 88.45%. To assure the equal probability of being sampled, weightings were assigned to each respondent.
We investigated the general characteristics of the study subjects and the prevalence of the MS in 3,431 (959 survey samples) subjects aged 10 - 19 years from the 2001 KNHANES. A total of 1,305 people were identified to take part in the survey. Of these, 346 individuals either had missing anthropometric measurements or did not fast properly prior to the blood test. Complete data were obtained for the remaining 959 participants (73.5%). This weighting of 959 observations resulted in 3,431 subjects representative of the census population. However, the characteristics of the 10 and 11 year olds were not included because the survey examining health consciousness and behavior was administered to subjects who were at least 12 years old. The comparison of the prevalence of the MS according to the degrees of obesity in the criteria of Cook et al., Cruz and Goran, and Ferranti et al. was performed with 3,128 (877 survey samples) subjects after excluding the 19-year-old subjects. This was necessary because the body mass index (BMI) percentile was not reported for the 19-year-old subjects using the body development standard in children and adolescents of the Korean Pediatrics Association.15
Measuring the clinical data
The height and weight of the subjects were measured by well trained examiners. Individuals were requested to wear light clothing and to take off their shoes. Height was determined to 0.1 cm using a stadiometer (850 - 2,060 mm; Seriter®, Washington, WA, USA), and weight to 0.1 kg using a scale (Giant-150N; HANA®, Korea). BMI was calculated by dividing the weight (kg) by the square of the height (m2). Waist circumference was measured to 0.1 cm by measuring the narrowest circumference between the lower borders of the rib cage and the iliac crest.
Blood pressure was determined using a mercury sphygmomanometer (Baumanometer®, W.A.Baun. co., NY, USA). The subjects were requested not to smoke or drink caffeine during 30 minutes prior to the measurement, and rested for at least 10 minutes. Blood pressure was measured twice on all subjects at 5-minutes intervals. The first and fifth Korotkoff sounds indicated the systolic and diastolic blood pressure (SBP and DBP), respectively. In this study, the average values of two SBP and two DBP were used separately.
Blood samples were obtained in the morning through an antecubital vein using vacutainer tubes containing EDTA from the subjects who had fasted overnight, and then centrifuged, refrigerated and transferred to a national central laboratory in Seoul. Plasma fasting glucose, serum triglycerides, high-density lipoprotein (HDL) cholesterol, aspartate aminotransferase (AST), and alanine aminotransferase (ALT) were analyzed using an enzymatic technique (Hitachi 747 auto-analyzer; Hitachi, Tokyo, Japan).
Definition of the MS in Korean children and adolescents
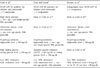
The MS was defined using the modified NCEP-ATP III criteria of Cook et al., Cruz and Goran, and Ferranti et al. (Table 1). The three sets of criteria suggested a cutoff point for high blood pressure using the sex-, age-, and height-specific 90th percentile, while this study used a sex- and age-specific 90th percentile cutoff only because of the small number of cases.
The MS was defined as present when the participants had more than three of the following five metabolic components: high blood pressure, abdominal obesity, hypertriglyceridemia, high fasting glucose, and low HDL cholesterol. However, the detailed definitions of each criterion differed slightly. In the criteria of Cruz and Goran, hypertriglyceridemia, high fasting glucose, and low HDL cholesterol differed from those of Cook et al., and in the criteria of Ferranti et al., abdominal obesity, hypertriglyceridemia, and low HDL cholesterol differed from those of Cook et al.
Definition of the agreement rate of MS prevalence
The agreement rate of MS prevalence was defined as the sum of the percentages that met all three sets of criteria6-8 and those did not meet any set of criteria.
Kappa index of agreement statistics was calculated as well. The Kappa index is used to measure the reliability that takes into account the agreement expected on the basis of chance. A Kappa index of one indicates perfect agreement and a value of zero indicates no agreement better than chance.
Definition of obesity in Korean children and adolescents
The people who were obese were assessed using the sex- and height-specific standard weight suggested by the Korean Pediatric Association in 1998.15 Five groups were assigned according to the degree of obesity: underweight (< 80%), normal (80 - 120%), mild obesity (120 - 130%), moderate obesity (130 - 150%), and severe obesity (> 150%).
Definitions of other factors
Age was divided into two groups: the 10 - 14- and 15 - 19-year-old groups. Residential area was assessed using the number of households and classified as a city or a rural area. The equivalent household income was calculated by dividing the monthly household income by the square root of the number of household members, and was divided into two groups: under 1,000 won and over 1,000 won.
Alcohol consumption was assessed using a single item: "How often do you usually drink alcohol?" Responses were on a 5-point interval scale (often, sometimes, seldom, never, and used to). The responses were divided into two categories: drink alcohol (often, sometimes, and seldom) and do not drink alcohol. Smoking was classified into two groups: current smoker and nonsmoker (including ex-smoker).
Physical exercise was assessed using the question, "How often in the past month did you exercise so hard that you sweated and became short of breath?" It was defined as any activity lasting at least 30 minutes per session and classified into two groups: < 2 sessions a week and ≥ 3 sessions a week.
The sufficiency of sleep was assessed using a single item: "Do you get sufficient sleep to feel healthy every day?" Possible answers were 1 = more than enough, 2 = enough, 3 = not enough, and 4 = far too little, and these responses were categorized as yes (more than enough, enough) or no (not enough, far too little).
The perceived stress rate was assessed using the question, "How much stress do you usually feel?" The responses was categorized as light (very little, little) or heavy (much, very much).
Abnormal liver function was defined as AST > 40 IU/L or ALT > 40 IU/L. Family history of DM, hypertension/cerebrovascular accident (CVA), CVD, and liver disease was investigated using yes or no responses.
Dietary intake was assessed using the single 24-hour recall method16 by experienced interviewers. Before testing, all subjects were instructed to maintain their usual dietary habits. In this study, the daily energy intake and percentages of three nutrients (carbohydrates, fat, and protein) were calculated using a computer program (CAN, Korean Nutrition Society, Seoul, Korea).17
Statistical analysis
The weights from the Korea Institute for Health and Social Affairs were applied. This weighting of 959 resulted in 3,431 subjects representative of the Korean children and adolescent population aged 10 to 19 years in gender and age of 2001. The characteristics of boys and girls in the study were compared using an independent t-test and chi-square test. All statistical analyses were performed with SPSS (version 13.0, SPSS, Chicago, IL, USA), with p < 0.05 considered statistically significant.
RESULTS
General characteristics of the study subjects
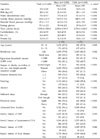
The general characteristics of study subjects by sex are presented in Table 2. The 3,431 subjects included 1,828 boys (53.5%) and 1,603 girls (46.7%). Their mean age was 14.1 ± 2.8 years, and the mean BMI was 20.6 ± 3.6 kg/m2. The mean waist circumference was 70.4 ± 9.7 cm. The percentage of total energy intake from fat was 21.6%. About 80% of the study population lived in cities. Regarding the degree of obesity, 16.6% of the boys and 11.7% of the girls were obese. The subjects who exercised, smoked, and drank constituted 25.3, 11.6, and 33.6% of the boys and 7.4, 1.0, and 26.5% of the girls, respectively (p < 0.001). Of the subjects, 29.6% of the boys and 41.6% of the girls perceived heavy stress (p < 0.001) and 5.9% of the boys and 3.4% of the girls had abnormal liver function (p = 0.001).
The prevalence of metabolic components in children/adolescents using the three sets of criteria
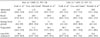
The prevalence of metabolic components based on the three sets of criteria is summarized at Table 3. The percentage with high triglycerides was highest [28.9% (95% CI: 26.8 - 30.9) of boys and 30.3% (95% CI: 28.1 - 32.6) of girls] using the criterion of Cook et al., while the percentage of high fasting blood glucose was highest [30.2% (95% CI: 28.1 - 32.2) of boys and 26.0% (95% CI: 23.8 - 28.2) of girls] using the criterion of Cruz and Goran. In addition, the percentage with a low HDL cholesterol was highest [50.8% (95% CI: 48.5 - 53.1) of boys and 52.8% (95% CI: 50.3 - 55.2) of girls] using the criterion of Ferranti et al.
Comparison of the prevalence of the MS according to the degree of obesity using the three sets of criteria
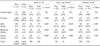
Table 4 summarizes the prevalence of the MS using the three sets of criteria according to the degree of obesity. The prevalence of the syndrome using the criteria of Cook et al. increased with the degree of obesity. About 60% of the severely obese group in boys was diagnosed with the MS using the criteria of Cook et al. In contrast, the criteria of Ferranti et al. indicated different features: although the prevalence of the MS generally increased with the degree of obesity, in the severely obese group in boys, the prevalence of the MS was lower than in the moderately obese group in boys. The prevalence of the MS in the obese groups was higher than in the underweight and normal weight groups in both sexes. Moreover, in girls, the prevalence of the MS generally increased with the degree of obesity. However, the criteria of Ferranti et al. showed 0.0% in the severely obese group, since the number of severe obese girls was only 7 (0.4%).
The prevalence of the MS in children and adolescents using the three sets of criteria
The MS was defined as having more than three of the five metabolic components, no significant differences were observed between the sexes. The prevalence of the MS was 7.7% in boys and 6.1% in girls using the criteria of Cook et al., 6.7% in boys and 4.6% in girls using those of Cruz and Goran, and 14.1% in boys and 16.2% in girls according to Ferranti et al. (Table 5).
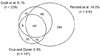
Of the 3,431 children and adolescents, 2,867 (83.6%) did not have the MS using any of the three sets of criteria, 564 (16.4%) had the MS using one of the sets of criteria, and 147 (4.3%) had the MS using all three sets of criteria (Fig. 1). Two hundred and thirty-eight (6.1%), 197 (5.3%), and 516 (14.0%) children and adolescents met the MS criteria of Cook et al., Cruz and Goran, and Ferranti et al., respectively. Furthermore, 216 (41.9% of the subjects who met the criteria of Ferranti et al.) subjects met the MS criteria of both Ferranti et al. and Cook, 213 (41.3% of the subjects who met the criteria of Ferranti et al.) met the criteria of both Ferranti et al. and Cruz and Goran, and 155 (55.4% of the subjects who met more than one criterion of Cook et al. and Cruz and Goran) had the MS according to the criteria of both Cook et al. and Cruz and Goran.
The prevalence of the MS according to the criteria of Cook et al. was similar to that of Cruz and Goran, but the subjects meeting each set of criteria differed markedly. The rate of MS was similar as 6.1% (n = 238) and 5.3% (n = 197) according to the criteria of Cook et al. and Cruz and Goran, respectively, but 155 subjects (45.7%) was different each other.
As noted, 147 subjects met all three sets of criteria and constituted 26.1% of the subjects who met at least two of the three sets of criteria for the MS. The agreement rate for the prevalence of the MS was 88.7% (89.0% in boys and 86.5% in girls, Table 5).
To compare the agreement rate between pairs of the three sets of MS criteria, we applied the Kappa index, which was 0.693 (p < 0.001) using the criteria of Cook et al. and Cruz and Goran, 0.528 (p < 0.001) using those of Cook et al. and Ferranti et al., and 0.407 (p < 0.001) using those of Cruz and Goran and Ferranti et al.
DISCUSSION
The prevalence of the MS in Korean children and adolescents was 6.1, 5.3, and 14.0% according to the criteria of Cook et al., Cruz and Goran, and Ferranti et al., respectively. The agreement rate of the prevalence of the MS among the three criteria sets was 87.9%, but the subjects who were categorized as having the MS differed.
Comparing the prevalence of the MS in children and adolescents across studies is difficult because different studies use different criteria to define the syndrome. Searching PubMed using the words "metabolic syndrome" AND "children" AND "adolescents" on December 5, 2006, identified 82 papers published since January 2005, of which we searched 21. Five papers (23.8%) used the modified World Health Organization (WHO) criteria, 15 papers (71.4%) used the modified NCEP-ATP III criteria, and one paper used a mixture of the WHO and NCEP-ATP III criteria. Moreover, four papers used the criteria of Cook et al. (26.7%), one (6.7%) used the criteria of Cruz and Goran, none (0.0%) used the criteria of Ferranti et al., and ten(66.6%) used a various mixture criteria of Cook et al., Cruz and Goran, and Ferranti et al.
The three sets of criteria reflected somewhat different focuses in defining the MS. The criteria of Cook et al. focused on the degree of obesity. The BMI according to age- and sex-specific percentiles was strongly associated with the MS (in the group at risk of becoming overweight; OR = 9.67; 95% CI: 3.57 - 26.22, in the overweight group; OR = 22.33; 95% CI: 7.47 - 66.76, the data was not suggested in this paper). Several studies of obese children have used the criteria of Cook et al. for defining MS.9-12,18 Although, a lot of studies have examined the association between waist circumference and disease, only a few studies have specifically targeted children and adolescents. Therefore, waist circumference in Asian children and adolescents as in adults should be studied more.19
The definition of the MS used by Ferranti et al. was based closely on the ATP III adult criteria. Thus, their MS criteria captured a larger adolescent population6 because they used equivalent pediatric percentiles in setting the cutoff points for triglycerides and HDL.4 For example, Ferranti et al. used a lower triglyceride cutoff point of 100 mg/dL in their MS criteria, including the 75th to 85th pediatric percentiles as equivalent to the adult percentiles. The lower triglyceride cutoff point of 110 mg/dL used by Cook et al. is applicable to the 85th to 95th percentiles of children, making it more restrictive than the criteria of Ferranti et al.
The criteria of Cruz and Goran focused on blood glucose in defining the MS in children and adolescents. In our study, the prevalence of a high fasting blood glucose was 30.1% in boys and 25.8% in girls because Cruz and Goran used a fasting blood glucose cutoff of 100 mg/dL. In contrast, with the criteria of Cook et al. and Ferranti et al., the prevalence of a high fasting blood glucose was 7.8% in boys and 5.6% in girls because they both used a fasting blood glucose cutoff of 110 mg/dL. In the criteria of Cruz and Goran, the cutoff was based on the International Diabetes Federation (IDF) cutoff in adults,20 and the prevalence of a high fasting blood glucose was 27%.19 These studies indicate that the child and adolescent populations with a fasting blood glucose level of 100 to 110 mg/dL could easily develop DM.21 In our study, 1.7% of the children and adolescents had a fasting glucose level over 126 mg/dL, which leads to a suspicion of DM; none of the participants answered the question do you have DM in the affirmative, so their insight regarding DM was very low. In recent studies, the proportion of type 2 DM in childhood has increased, which is thought to be the result of an increase in childhood obesity. A Taiwanese study showed that 54.2% of newly diagnosed childhood DM was type 2 DM.22
Our study was also limited in several respect. First, the disease in this data was recorded just from the subject's answer because our study used a secondary data from the 2001 KNHANES. Second, the characteristics of the 10 and 11 year olds were not included because the survey examining health consciousness and behavior was administered to subjects who were at least 12 year olds. Third, the three sets of criteria suggested a cutoff point for high blood pressure using the sex-, age-, and height-specific 90th percentile, while this study used a sex- and age-specific 90th percentile cutoff only because of the small number of cases. Fourth, we could not determine whether the subjects had reached puberty which can affect the level of clinical data, since this study used a secondary data. We tried to minimize the error by using sex- and age-specific cutoffs. Further studies are needed to examine whether the subjects reached puberty or not. Althogh, we compared the MS criteria of Cook et al., Cruz and Goran, and Ferranti et al. and determined the prevalence of the MS in Korean children and adolescents using the population-based, standardizedly assessed data, and presented the agreement rates of the three sets of MS criteria. Our study is very important to investigate the impact of the different existing definitions of the MS on the prevalence in Korean children, which might have an important Public Health relevance.

 XML Download