

 PDF
PDF ePub
ePub Citation
 Print
Print


INTRODUCTION
Hepatic stellate cells (HSC) are the major cells storing large fat droplets.1 HSC are localized in the perisinusoidal space of Disse and directly contact endothelial and parenchymal cells.2 HSC have several important functions, such as vitamin A metabolism, extracellular matrix reorganization, and production of various growth factors and cytokines.1,3-5 Several studies have suggested that HSC regulate microcirculation in the hepatic sinusoid. HSC can be induced to respond to a number of vasoconstrictors, and contract accompanied intracellular free Ca2+ increase.6-8 In addition, HSC play a role in increased intrahepatic vascular resistance in chronic liver diseases through activation, transforming from a quiescent phenotype to an activated one, which produces potentially injurious connective tissue components and contributes to contractility.1,4,5,8,9 The anatomical location suggests that activated HSC contraction and relaxation can regulate sinusoidal resistance to blood flow, which can play an important role in portal hypertension pathogenesis in advanced chronic liver diseases.8,9 The activation process occurs under conditions of chronic liver damage, in vivo intoxication and liver injury as well as in vitro in prolonged primary culture on plastic surfaces.10-12 The HSC activation mechanism is of major interest for portal hypertension pathogenesis, and can provide clues to diagnostic and therapeutic intervention in fibrotic liver disease or cirrhosis.
In order to understand the mechanism underlying activation to contractile cells, it is essential to understand the ion channels that are associated with contraction. The membrane potential primarily regulates Ca2+ influx through voltage-dependent Ca2+ channels in the vascular smooth muscles and pericytes, controlling the contractility.13,14 The membrane potential can also modulate Ca2+ influx through Na+/Ca2+ exchange, or intracellular Ca2+ mobilization as a result of inositol triphosphate production.15,16 The inward rectifier K+ channels are believed to play a key role in regulating membrane potential in many tissues, including vascular smooth muscle, which are important in determining vascular tone.17,18 Previous electrophysiological studies on HSC have suggested that they contain voltage-dependent K+ channels and L-type voltage-dependent Ca2+ channels.19-21 L-type Ca2+ channels mediate an agonist-induced increase in intracellular Ca2+ in activated HSC, and are known to regulate Ca2+ entry and cellular contraction in other vascular cell types.13,22,23 There are few reports on the roles of inward rectifier K+ channels in regulating membrane potential along with their major subtypes. Generally, inward rectifier K+ channels are essential in several major physiological tasks such as stabilizing the resting membrane potential, regulating electrical activity, coupling the metabolic cellular state with membrane excitability, and mediating K+ transpor across membranes.24-26 To date, molecular cloning has identified at least seven inward rectifier K+ channel subfamilies, designated Kir1 to Kir7. The family consists of fifteen different gene products that encode the Kir α-subunits.27
Previous studies have identified and characterized inward-rectifying K+ currents in HSC.21,28,29 These studies could not explain the properties of inward rectifier K+ channels, differences between cells, molecular identifications, or changes during activation. Therefore, there is a need to examine Kir α-subunit expression in HSC, in addition to the differences in inward rectifier K+ channels in the cell population and activation process. The aim of this study was to quantify the inward rectifier K+ channels expressed in cultured rat HSC using real-time reverse transcriptase-polymerase chain reaction (RT-PCR), and to investigate their characteristics and function, as well as the changes that occur during the activation process using a patch-clamp technique.
MATERIALS AND METHODS
Materials
The fetal bovine serum, DMEM, and antibiotics-antimycotics were purchased from GIBCO BRL Life Technologies (Grand Island, NY, USA). The Nycodenz, BaCl2, and gramicidin were obtained from Sigma Chemical Co. (St. Louis, MO, USA). The pronase, collagenase, and DNase I were acquired from Roche Diagnostics GmbH (Mannheim, Germany). The RNeasy Mini Kit was supplied by Qiagen (Valencia, CA, USA). The SYBR Green PCR Master mix was purchased from Applied Biosystems (Foster, CA, USA). The oligonucleotide primers were obtained from Bioneer (Daejeon, Korea). The random hexamer was acquired from Takara (Kyoto, Japan). The reverse transcription polymerase was supplied by Promega (Madison, WI, USA). The polyvinylidene difluoride membranes and secondary antibody were purchased from Amersham Pharmacia Biotech (Buckingshire, UK). The anti-Kir2.1 and anti-Kir6.1 antibodies were obtained from Alomone Labs (Jerusalem, Israel), the anti-GAPDH antibody was acquired from Novus Biologicals (Littleton, CO, USA), and Western Lightning was supplied by PerkinElmer Life Sciences (Gaithersburg, MD, USA).
Rat HSC isolation and primary culture
The HSC were isolated from male Sprague Dawley rats (150 - 250 g) using in situ perfusion with collagenase/pronase and Nycodenz gradient centrifugation, as previously reported.28-30 Briefly, the rats were anesthetized intraperitoneally with ketamine at 5 mg/100g, and the liver was perfused with Hank's buffer containing pronase and collagenase. After the liver had been digested, it was rapidly excised and redigested in Hank's buffer containing pronase in a shaking water bath. The suspension was filtered through nylon gauze and the filtrate was centrifuged. After several washes with Hank's buffer, the cells were mixed with Hank's buffer containing Nycodenz. After centrifugation, the HSC were isolated from the floating band, washed with DMEM, and maintained in DMEM containing 10% fetal bovine serum and 1% antibiotics-antimycotics. The culture was carried out in a humidified atmosphere containing 5% CO2 in air at 37℃. The culture medium was changed 24 hours after plating the cells and every two days thereafter. The HSC purity was > 95%, as assessed by light-microscopic morphology and their positive immunocytochemical staining for desmin one or two days after seeding.
Quantitative real-time RT-PCR analysis
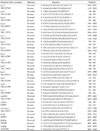
Total cellular RNA was isolated and purified from HSC cultured for different periods (1 day, 1 week, 2 weeks, or 3 weeks). The RNA was extracted using an RNeasy mini kit and stored at - 80℃ until needed. cDNAs were generated by reverse transcribing an RNA with the random hexamer using reverse transcription polymerase. The oligonucleotide primers for glyceraldehyde-3-phosphate dehydrogenase (GAPDH), α-smooth muscle actin (α-SMA), voltage-gated Ca2+ channel (CaV1.2), Kir, and sulfonylurea receptor (SUR) were designed using the Primer Express software (Applied Biosystems), based on the rat sequences deposited in the GenBank database (Table 1). The primer efficiency was examined to ensure optimal sample amplification. Serial dilutions of cDNA were used to define the relative fold changes, according to the supplier's instructions. Real-time PCR was performed using a SYBR Green PCR Master mix in an ABI PRISM 7900HT Sequence Detection System (Applied Biosystems). The amplification program included AmpliTaq Gold activation at 95℃ for 10 min, followed by 45 cycles of two-step PCR with denaturation at 95℃ for 15 s and annealing/extension at 60℃ for 1 min. Amplification was followed by melting curve analysis. The negative control, no cDNA template, was run simultaneously with every assay and the PCR from each cDNA sample was run in triplicate. The constitutively expressed housekeeping gene, GAPDH, was used as an endogenous control to correct for any potential variations in RNA loading or reaction efficiency. The results are presented as the relative fold changes using the 'GAPDH' reference and calibrator and applying the formula 2-ΔΔCt.31
Western blotting
The HSC were lysed in RIPA buffer containing (mM) 150 NaCl, 50 Tris-Cl (pH 7.2), 1% sodium deoxycholate, 0.1% SDS, 1 µg/mL aprotinin, 1 EGTA, 1 PMSF, and 1 sodium orthovanadate. After incubation on ice for 20 min with shaking, the samples were centrifuged at 10,000 × g for 5 min at 4℃. The proteins were mixed with sample buffer (50 mM Tris-Cl, pH 6.8, 10% glycerol, 2% SDS, 1% mercaptoethanol, 0.1% bromophenol blue), heated to 95℃ for 5 min, and separated on a 10% SDS-PAGE gel. The gel was transferred to a polyvinylidene difluoride membrane and blocked with TBST (20 mM Tris-Cl, pH 7.6, 137 mM NaCl, 2.7 mM KCl, 0.1% Tween 20) containing 5% nonfat milk powder for two hours at room temperature. The membrane was incubated with rabbit polyclonal antibodies against either Kir2.1 (1 : 400 dilution) or Kir6.1 (1 : 1000 dilution) for two hours, washed with TBST, and incubated with anti-rabbit IgG secondary (1 : 10,000) in TBST for one hour. After the membrane had been washed with TBST, the protein bands were visualized using Western Lightning. The protein loading was compared by reprobing the blots with anti-GAPDH antibody.
Electrophysiology
Whole-cell membrane currents and potentials were recorded using the gramicidin perforated patch-clamp technique32 with a patch-clamp amplifier (EPC10, Instrutech Corp., NY, USA). For each experiment, glass coverslips bearing HSC were transferred to a recording chamber mounted on the mechanical stage of an inverted microscope (Eclipse TS100, Nikon, Tokyo, Japan), and superfused with normal bath solution by gravity at 2 mL/min. The patch electrodes were fabricated from borosilicate glass capillaries (Garner Glass Co., Claremont, CA, USA) using a P-97 Flaming Brown micropipette puller (Sutter Instrument Co., San Rafael, CA, USA). The patch electrodes were fire polished on a microforge (Narishige, Tokyo, Japan), and showed resistances between 1 and 3 MΩ when filled with the internal solution described below. An Ag/AgCl wire was used to earth the bath. For voltage clamp measurements, the cell membrane capacitance and series resistance were compensated (> 80%) electronically using the amplifier. The voltage protocol generation and data acquisition were carried out using Pulse/Pulsefit software (v8.50, Heka Elektronik, Lambrecht, Germany). The sampling rate was 1 - 2 kHz and the current traces were low-pass filtered using a four-pole Bessel filter contained in the amplifier. All the experiments were performed at room temperature (20 - 24℃). The drugs were applied to single cells through a gravity-fed fused silica capillary tube connected to polyethylene tubes located within 100 µm of the cells. The regular external solution for measuring the K+ currents contained (in mM) 135 NaCl, 5 KCl, 2 CaCl2, 1 MgCl2, 10 glucose, and 10 HEPES (pH 7.4 with NaOH). The bath solution including 140 mM K+ was prepared by replacing NaCl with an equimolar amount of KCl. The pipette solution used for the gramicidin-perforated whole-cell recording contained (in mM) 140 KCl, 0.4 CaCl2, 1 MgCl2, 20 HEPES, 1 EGTA, and 50 µg/mL gramicidin (pH 7.2 with KOH).
Data analysis
The amplitude of the step currents was usually determined at a peak current after the onset of a test pulse. The data is presented as the mean ± SEM, and n indicates the number of cells examined or the number of experiments. Statistical significance was determined using either a Student's t-test or ANOVA. A p value < 0.05 was considered significant.
RESULTS
Inward rectifier K+ channel expression in HSC
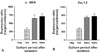
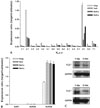
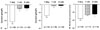
Previous electrophysiological experiments have provided evidence of inward rectifier K+ channels in HSC.21,28,29 This study investigated the molecular identity of the channels that contribute to the inward-rectifying K+ currents. We measured the mRNA expression of all known inward rectifier K+ channel subfamilies in the cultured HSC isolated from rat livers using real-time RT-PCR. In order to compare the expression of the inward rectifier K+ channels in the cultured HSC for different durations, the samples were normalized to GAPDH expression and a calibrator. HSC were used 1 day, 1 week, 2 weeks, and 3 weeks after isolation. As shown in Fig. 1, α-SMA and CaV1.2 mRNA expression increased progressively from 1 day to 3 weeks of culture (n = 3, α-SMA or CaV1.2 from 1 day HSC was used as a calibrator). The inward rectifier K+ channel mRNA expression profiles in HSC cultured for different periods were compared. The inward rectifier K+ channel family consists of seven subfamilies: Kir1.1, Kir2.1 - 2.4, Kir3.1 - 3.4, Kir4.1 - 4.2, Kir5.1, Kir6.1 - 6.2, and Kir7.1.24,27 As shown in Fig. 2A, all the inward rectifier K+ channel subfamilies were detected (Kir2.1 from 1 day HSC was used as a calibrator). Most of the inward rectifier K+ channels showed similar expression, within one or two fold differences, except for Kir2.1 and Kir6.1, which showed significantly higher expression (p < 0.001, n = 3). The expression of all inward rectifier K+ channel subfamilies decreased significantly with culture time (p < 0.001, n = 3) with the exception of Kir6.1. This result correlates with the decreased inward currents (Fig. 5). Kir6.1 showed a different expression pattern; an increase after an initial decrease (p < 0.05, n = 3). The molecular identityof SUR, associated with Kir6.1 or Kir6.2 was investigated (Fig. 2B). Among the SUR, only SUR2 was identified, and SUR2B expression was higher than SUR2A (p < 0.001, n = 3). SUR2B expression increased by two fold as culture progressed (p < 0.001, n = 3). SUR2B is usually associated with Kir6.1 in vascular smooth muscle33 and possibly HSC. Western blotting experiments were carried out for Kir2.1 and Kir6.1 (n = 3). Fig. 2C shows the Kir 2.1 and Kir6.1 distributions in HSC. There was a band around 55-kDa, which was stronger at 1 day than 2 weeks. This correlates with the results of the inward rectifier K+ channel mRNA quantification, which were down-regulated during the transformation.
Two different types of K+ currents in HSC
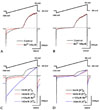
A previous study on K+ currents in HSC reported differences in the inward-rectifying K+ current between cell populations.28,29 Therefore, the K+ currents observed in the HSC were investigated using patch-clamp experiments in a gramicidin-perforated whole-cell configuration. The cells were used within 16 days of culture. In cells perforated with the high K+ pipette solution, the current-voltage (I-V) relationship of K+ currents was examined using ramp pulses to voltages ranging from - 140 to 60 mV from a holding potential of - 60 mV. In a subpopulation of HSC, there was a component of the whole cell current that showed inward rectification between - 80 and - 140 mV (Fig. 3A), but there was no such current in the other subpopulation (Fig. 3B). Based on the presence of the inward currents, two different subpopulations of HSC could be distinguished; type 1 (outward and inward) and type 2 (outward only).28,29 Of the HSC tested, 46.3% (n = 69 of 149) were type 1, with type 2 accounting for the remainder (n = 80 of 149). In previous studies, the inward-rectifying K+ currents were inhibited by extracellular cations such as Ba2+ and Cs+.34,35 The inward current in HSC shares several characteristics with the inward-rectifying K+ current. Therefore, the effect of Ba2+ on K+ currents in both types of HSC was investigated. During the ramp pulse, Ba2+ (100 µM) selectively blocked the inward current in type 1 (Fig. 3A), but had no significant effect on the outward current. Ba2+ suppressed 71.9 ± 4.1% of the inward current evoked by a voltage pulse to - 120 mV in type 1 HSC (n = 10). In order to confirm the ionic selectivity of this current, the external K+ concentration ([K+]o) was increased and a ramp protocol was used to record the inward current. When the [K+]o was increased from 5 to 140 mM, the same ramp pulses induced several major changes in the K+ currents (Fig. 3C). (i) Both the inward currents due to the ramp pulse and the currents at the holding potential were increased. (ii) The zero current potential (reversal potential) shifted positively. (iii) The rectification of the outward current also shifted. This demonstrates that the current reversal potential and rectification are all dependent on [K+]o. Thus, the current is selective for K+, which is unique to inward rectifier K+ channels. In type 2 HSC, the inward current due to the ramp pulse increased and the current produced by the holding potential also increased inwardly, but the effects were smaller than observed in type 1 HSC. High [K+]o induced several major changes in the outward K+ currents (Fig. 3D): (i) The amplitude of the outward currents decreased, (ii) inward current appeared at potentials between - 40 and 0 mV, and (iii) current was detected at more negative membrane potentials. Ba2+ (100 µM) blocked the effects of the high [K+]o on the inward K+ current in both types of HSC (Figs. 3C and D). The increased inward currents mediated by inward rectifier K+ channels were reduced in both types of HSC. Inward currents caused by the outward voltage-dependent K+ channels were not affected by Ba2+.
Relationship between the membrane potential and the Ba2+-sensitive current in HSC
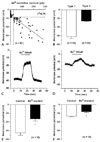
The contribution of the inward-rectifying K+ current to the membrane potential was investigated. Fig. 4A shows the relationship between the resting membrane potential, which was recorded in the current-clamp configuration, and the Ba2+-sensitive current (n = 81). The HSC population was divided into two types; type 1 HSC had a more negative resting membrane potential and a large Ba2+-sensitive current, while type 2 HSC had a less negative resting membrane potential and a small or no Ba2+-sensitive current. This data was fitted by linear regression (r2 = 0.75). The discriminating values of the resting membrane potential and Ba2+-sensitive current were estimated to be - 17 to - 18 mV and 20 - 30 pA, respectively. Fig. 4B shows the resting membrane potential of both types of HSC. Type 1 HSC demonstrated a more negative resting membrane potential (- 31.1 ± - 2.2 mV, n = 52) than the type 2 HSC (- 13.0 ± 0.4 mV, n = 60, p < 0.0001). This suggests that the membrane potential can be regulated by inward rectifier K+ channels. Therefore, the direct effect of Ba2+ on the membrane potential was investigated (Figs. 4C and F). Ba2+ (300 µM) depolarized the membrane potential by 15.9 ± 1.5 mV (n = 16, p < 0.0001) in type 1 HSC, and by 5.1 ± 0.4 mV (n = 15, p < 0.0001) in type 2 HSC. The depolarization was reversed by washout. These results suggest that the inward rectifier K+ channels regulate the resting membrane potential in both types of HSC and the difference in the resting membrane potential is due to these channels.
Changes in the inward K+ current and membrane potential during culture
The changes in the inward K+ current and membrane potential during culture was observed (Fig. 5). A high K+-induced inward current of 10.8 ± 1.4 pA/pF was observed in type 1 HSC at a holding potential of - 60 mV (n = 69), which is significantly larger than the current of 4.7 ± 0.9 pA/pF observed in type 2 HSC (n = 80, p < 0.0001). The inward K+ current was significantly smaller in type 1 HSC cultured for 2 weeks than in those cultured for 1 - 3 days, which had a mean current amplitude of 4.1 ± 0.6 pA/pF (n = 22) and 21.3 ± 2.7 pA/pF (n = 26, p < 0.001), respectively (Fig. 5A). In addition, the inward K+ current in type 2 HSC decreased significantly from 13.5 ± 2.2 pA/pF in HSC cultured for 1 - 3 days (n = 23) to 1.0 ± 0.2 pA/pF in HSC cultured for 2 weeks (n = 29, p < 0.001). The resting membrane potential was more depolarized in type 1 HSC cultured for 2 weeks (- 24.5 ± 1.9mV, n = 19) than those cultured for 1 - 3 days (- 35.9 ± 4.2 mV, n = 20, p < 0.05) (Fig. 5B). Therefore, the inward K+ current decreased and the membrane potential became depolarized with increasing culture time or activation, which is consistent with the changes in inward rectifier K+ channel expression.
DISCUSSION
This study investigated the inward rectifier K+ channel genes and characterized the inward-rectifying K+ currents in cultured rat HSC. The main aim was to determine the function of the inward-rectifying K+ currents and their changes during the in vitro activation process. The presence of inward rectifier K+ channels was assessed using a patch-clamp technique and real-time RT-PCR. The former is the gold standard for evaluating K+ channel characteristics because it allows one to assess the ion currents through the cell membranes.36 The latter was used to detect and analyze mRNA expression of each inward rectifier K+ channel α-subunit quantitatively, along with changes during the activation process. To our knowledge, this is the first study to compare expression of a comprehensive range of inward rectifier K+ channel subfamilies, and determine changes in inward rectifier K+ channels in HSC.
Pericytes in different tissues are heterogeneous in structure, morphology, and function. Pericytes within the same tissue or even within a single capillary bed can be different from each other. Pericytes on the venous sides of capillary beds are more numerous and have more extensive processes than those on the arterial sides.37,38 HSC also show heterogeneous properties according to their location within the liver.39,40 HSC in different areas of the lobule have distinct properties in terms of shape, size, vitamin A-lipid droplets, branching processes, and desmin immunoreactivity. This intralobular heterogeneity of HSC may reflect differences in the metabolic handling of vitamin A and regulation of sinusoidal tone.1 Therefore, it is possible that the HSC in different areas of the liver have different electrophysiological properties and roles.
HSC express several types of K+ currents.20,21,28,29 These K+ channels are commonly found in smooth muscle and pericytes, but their components differ somewhat according to the tissue and cell.14,17,41 The inward-rectifying K+ currents were observed in smooth muscle cells of the cerebral and coronary arteries, but not in other arteries.35,36,42 The inward-rectifying K+ current is present at a higher density in small-diameter arteries compared with larger conduit vessels.43,44 Similarly, there are discrepancies in inward-rectifying K+ current expression in coronary pericytes and smooth muscle cells of small bronchioles.41,45 In myoblast differentiation, newly formed myotubules express an inward-rectifying K+ current.46 In the spiral modiolar artery, a more negative resting membrane potential is likely to be the result of highly activated inward rectifier K+ channels. A less negative resting membrane potential is due to a lack of inward rectifier K+ channels.47 In HSC, the inward-rectifying K+ currents were measured in half the cells using the electrophysiological method. This suggests that HSC consist of two groups, one with inward- and outward-rectifying K+ currents (type 1) and the other with only outward-rectifying K+ currents (type 2). This distribution suggests fundamental differences in the expression of inward rectifier K+ channels in HSC, and is believed to contribute to functional differences in HSC.
The molecular identities of the inward rectifier K+ channels and their changes during activation were investigated. All seven inward rectifier K+ channel subfamilies could be associated with the inward-rectifying K+ currents in HSC. The transcripts for Kir1.1, Kir2.1 - Kir2.4, Kir4.1, Kir4.2, Kir5.1, and Kir7.1 were expressed, which represent both strong and weak inward rectifier K+ channels. Kir2.1 was found to be dominant. The transcripts for the G-protein gated inward rectifier K+ channel α-subunits (Kir3.1 - Kir3.4) were expressed. Two Kir6 α-subunits were expressed, with Kir6.1 being dominant. The ATP-regulated K+ channels (KATP) are octameric channels formed by four Kir6 α-subunits and four SUR. The quantity of mRNA suggests it is possible that the Kir6.1 α-subunits assemble with SUR2B in HSC, like vascular smooth muscle.25,33 Although Kir2.1 and Kir6.1 are the dominant subtypes, other inward rectifier K+ channels might contribute to the inward-rectifying K+ currents in HSC.
The physiological roles of the inward rectifier K+ channels include membrane potential regulation, preventing hyperpolarization by electrogenic pumps, and minimizing the cellular K+ loss in a variety of excitatory and non-excitatory cells.36 Inward rectifier K+ channels in HSC can serve as a device to maintain the resting membrane potential. The characteristics of the inward-rectifying K+ currents described in this study are generally similar to other contractile cells, and concur with previous results obtained using rat HSC.21,28,48 High K+ induces an inward current and depolarization, while Ba2+ inhibits the effect of high K+ and the inward-rectifying K+ current. There is an inverse correlation between the Ba2+-sensitive current and membrane potential. Ba2+ depolarizes the membrane potential in HSC, as well as internal thoracic artery, esophagus, and colon smooth muscle.49-51 This suggests that inward rectifier K+ channels regulate the membrane potential in HSC. HSC had different resting membrane potentials. Type 1 HSC had a more negative membrane potential than type 2 (Fig. 4). Different resting membrane potentials due to inward rectifier K+ channels were suggested in the coronary arterial and colonic smooth muscles.47,50 Inward rectifier K+ channels are believed to induce a more negative membrane potential in type 1 HSC. The membrane potential in this study was different from that reported by Kashiwagi et al.,21 which might be due to the different rupturing or perforating techniques, or due to the selection of HSC with a different inward rectifier K+ channel expression pattern.
The relationship between culture time and inward rectifier K+ channel expression was investigated. The quiescent HSC phenotype changes to a myofibroblast-like phenotype during primary culture using ordinary culture dishes. The activation process that occurs in vivo after liver injury or in inflamed liver tissue strongly resembles the morphological and functional changes observed in HSC during primary culture. The inward-rectifying K+ current and inward rectifier K+ channel α-subunits decreased with culture time over a period of approximately 2 - 3 weeks. In addition, the expression of L-type Ca2+ channels (CaV1.2) increased (Fig. 1). Ca2+ channel activation causes Ca2+ influx into HSC, which might induce various functions including contraction. This increase in the intracellular Ca2+ concentration can cause significant alterations in the intracellular environment and induce numerous Ca2+-dependent signaling pathways. It is possible that this phenomenon is an inevitable stress to the activated HSC, and should be relieved by protecting against Ca2+ influx. Therefore, activation might induce a series of changes in the protective machinery either before the expression of Ca2+ channels or simultaneously. It is possible that the inward rectifier K+ channel is a protective mechanism because it induces inactivation of the Ca2+ channel by the depolarized membrane potential. Furthermore, the membrane potential was depolarized during activation, and the Ca2+ channels were more inactivated. At that time another mechanism to control Ca2+ might have developed. Considering the changes in inward rectifier K+ channels and membrane potential, the L-type Ca2+ channel might be less important in intracellular Ca2+ increase than other pathways. On the other hand, KATP, which also increased during this time, might have a greater influence on the electrical activity than the other inward rectifier K+ channels. KATP may cause further changes in the metabolic state of the activated HSC. More study is needed to determine the effect of these changes on the inward rectifier K+ channels in the HSC activation.
This study suggests that inward rectifying K+ currents are mediated by mainly Kir2.1 and Kir6.1. The inward rectifier K+ channels contribute physiologically to control the HSC membrane potential, and trans-differentiating cells accompany a membrane potential decrease. These electrophysiological and real-time RT-PCR results might help determine not only the properties of inward rectifier K+ channels in HSC and their roles in the activation process, but also the mechanism responsible for the HSC activation process.
 XML Download