

 PDF
PDF ePub
ePub Citation
 Print
Print


INTRODUCTION
Protein-energy malnutrition is highly prevalent in ESRD patients on dialysis. A cross-sectional analysis found that the signs and symptoms attributed to malnutrition occurred in 50% or more of these patients.1 Malnutrition is generally the result of energy imbalance by reduced dietary intake, increased energy expenditure, or both. REE accounts for 60 - 80% of total energy expenditure.2-4 Determining REE aids the analysis of energy imbalance in patients with chronic disease.
In the clinical setting, equations are generally used to estimate REE, and numerous equations have been advanced for general use.5,6 The accuracy of these equations have been evaluated in ill and healthy individuals,7-11 however only a few studies have examined their accuracy in ESRD patients.12
In the present study, the authors assessed the accuracy of these equations for estimating REE in clinically stable ESRD patients undergoing CAPD.
MATERIALS AND METHODS
Subjects
This cross-sectional study was performed on ESRD patients on CAPD who were being followed at the outpatient CAPD clinic at the Kidney Center at Inha University Hospital (IUH) in Incheon, Korea, from February 2004 to June 2004. Inclusion criteria were CAPD patients who maintained a relatively consistent body weight (BW) without any history of a catabolic condition during the previous 6 mo and could stand unaided for bioelectrical impedance analysis (BIA). Exclusion criteria were a current acute illness (including infectious disease), an infection during the preceding 6 mo, amputees, liver cirrhosis with ascites, those with hemiparalysis, a high-sensitivity Creactive protein (CRP) of > 0.30 mg/dL, hyperthyroidism, hypothyroidism, cancer, a duration of CAPD of < 6 mo, and those who refused to participate in the study.
All patients had been instructed to eat approximately 30 - 35 kcal/kg/day, including 1.2 - 1.3 g/kg/day of protein. Diabetic patients were treated with insulin and/or oral hypoglycemic agents. All patients were receiving anti-hypertensive drugs (calcium channel blockers, α/β blockers, angiotensin converting enzyme blockers, or angiotensin II receptor antagonists) and other drugs commonly used to treat ESRD, such as phosphate binders, water soluble vitamins, oral iron agents, and recombinant human erythropoietin.
The protocol used conformed with the Declaration of Helsinki, and all ESRD patients provided written informed consent before participating in the study. The study was approved by the ethical board of IUH.
Study design
Patients were interviewed during monthly visits by attending physicians to identify those meeting the inclusion criteria and for informed consent. One month after interview, patients were requested to fast overnight and to attend the CAPD clinic at 9:00 AM, in an empty abdomen after undergoing CAPD fluid drainage at 6:00 AM. After determining BW, height (Ht), and subjective global assessment (SGA) score, patients were moved to a quiet room for REE measurement. BIA was measured by a nurse and blood samples were obtained for biochemical parameter.
Assessment of REE
REE was measured by indirect calorimetry using MetaMax II unit (CORTEX Biophysik GmbH, Leipzig, Germany). Oxygen and carbon dioxide sensors were calibrated before each measurement using reference gas mixes of known composition. Testing was conducted in all patients under standardized conditions in the morning.
Patients were instructed to maintain their regular physical activity and medication until the day before REE measurement. Patients were admitted at 9:00 AM after an overnight 12-h fast and CAPD fluid drainage at 6:00 AM. They were instructed to avoid hyperventilation, fidgeting, or falling asleep during the test. After a 30-min rest involving lying recumbent in a bed in a quiet room at 23.5℃, REE was measured for 35 min in a quiet environment. REE was measured every 10 sec via oxygen consumption and carbon dioxide production rates. Readings taken during the first 5 min were discarded and subsequent steady state readings taken over 30 min were averaged. These averages were used to calculate REE using the Weir formula without using urinary urea nitrogen.13 Respiratory quotients were calculated as ratios of volume of CO2 expired (VCO2) vs volume of O2 consumed (VO2). REE values were adjusted to per kg of lean body mass (LBM) (adjREE).14
BIA
Body composition was measured by segmental multifrequency BIA (Inbody 4.0, Biospace Co., Seoul, Korea). The principle of this method and the procedure involved have been described previously. 19 Briefly, with the subject standing on sole electrodes and gripping hand electrodes, the microprocessor of the BIA unit was switched on and the impedance analyzer began measuring segmental resistance of the right arm, left arm, trunk, right leg, and left leg at 5 frequencies (5, 50, 250, 500, and 1000 kHz). The mean values of 2 sets of BIA measurements were used for analysis. The accuracy of this method for measuring body composition has been validated in healthy subjects. 20 The coefficient of variation of repeated measures of LBM was 0.29%, and the day-to-day coefficient of variation was 1.18%.20 The adjusted R2 and root mean square errors between LBM as measured by dual energy X-ray absorptiometry and LBM as measured using Inbody 4.0 were 0.92 and 2.8 kg, respectively.20
Patient hydration levels were assessed using extracellular fluid (ECF)/total body water (TBW) ratio of whole body (ECF/TBW), which was derived by summing the ECF and TBW of 5 body segments. The normal ECF/TBW ratio, as provided by Biospace Co. (Seoul, Korea), ranges from 0.30 to 0.35. Thus, patients with an ECF/TBW of > 0.35 were classified as overhydrated (OH), between 0.30 and 0.35 as normohydrated (NH), and an ECF/TBW of < 0.30 as underhydrated.
Nutritional assessment
BW and Ht were measured to the nearest 0.1 kg and 0.1 cm using a linear height scale and electronic weight scale. Body mass index (BMI) was defined as BW divided by Ht squared (kg/m2). SGA was performed by the same observer andincluded 6 subjective assessments, 3 based on weight loss history, incidence of anorexia, and incidence of vomiting, and 3 based on physician gradings of muscle wasting, presence of edema, and loss of subcutaneous fat.21 Patients were classified as being normal or as having mild to moderate or severe malnutrition.
Biochemical data
Blood was drawn under fasted conditions to measure hemoglobin, albumin, creatinine, urea nitrogen, and total cholesterol concentrations using an autoanalyzer. Serum albumin concentrations were determined using the bromcresol green method. Serum high-sensitivity CRP levels were measured using the latex agglutination method.
Dialysis adequacy
Weekly total Kt/V urea and creatinine clearance were calculated using 24-h collected dialysate and urine within 1 mo of REE measurement.22 Urea volume distributions (V) were calculated using the Watson equation.23 Protein equivalent nitrogen appearance (PNA) was calculated using the method described by Bergstrom et al.24 PNA was normalized by BW (nPNA). Residual renal function (RRF) was defined as the average of 24-h urine urea and creatinine clearances.25
Statistical analysis
All data are expressed as means±SD. Group differences were tested using Mann-Whitney U test, and Spearman's correlation coefficients (r) were used to identify relationships between 2 variables. To analyze differences between measured and estimated REE values, 1-way analysis of variance (ANOVA) was performed using the Bonferroni method for the post-hoc test. Root mean square error (RMSE) of measured and estimated value, Bland-Altman plot with mean value of measured and estimated REE and difference between measured and estimated REE were used to quantify accuracy of the different REE equations.26 RMSE is the square root of the sum of squared differences between the measured and estimated REE values divided by the number of patients studied. The smaller the RMSE, the greater the accuracy of the equation. To quantify degrees of bias, we compared the correlation coefficients between respective differences and means in Bland-Altman plots. The closer the correlation coefficient of a Bland-Altman plot to 0, the less the bias. Statistical analysis was performed using SPSS software, version 12.0 (SPSS, Inc., Chicago, IL, USA), and p values of < 0.05 were considered statistically significant.
RESULTS
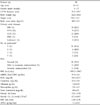
Of 149 CAPD patients vetted, 111 were excluded for the following reasons: CAPD peritonitis within the previous 3 mo (5); admission within the previous 6 mo due to a cardiovascular disease, infection, or general weakness (21); BIA was not performed (3); refusal to participate (51); unable to perform the study due to poor general condition (25); and serum high-sensitivity CRP > 0.30 mg/dL (6). In the end, 38 patients were included in this study. Their demographic and laboratory details are shown in Table 2. Fourteen patients were male (36.8%), mean patient age was 50 ± 11 yr, CAPD duration was 27.2 ± 19.7 mo (median, 24.5 mo), Ht 159.2 ± 8.7 cm, BW 62.2 ± 10.4 kg, and BMI 24.5 ± 3.3 kg/m2. The causes of ESRD were diabetic nephropathy in 10 patients (26.3%), chronic glomerulonephritis in 11 (28.9%), hypertensive nephropathy in 9 (23.7%), polycystic kidney disease in 3 (7.9%), and unknown in 5 (13.2%). Most patients (81.6%) did not have peritonitis during CAPD. According to SGA, 21 patients (55.3%) were normally nourished, 11 (28.9%) were mildly to moderately malnourished, and 6 (15.8%) were severely malnourished. Twenty-four patients were OH. Mean weekly total Kt/V urea, Ccr, and RRF were 2.2 ± 0.7, 67.3 ± 19.7 L/week/1.73 m2, and 1.5 ± 1.8 mL/min. Mean nPNA and REE were 1.1 ± 0.2 g/kg/day and 1393.2 ± 238.7 kcal/day.
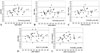
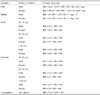
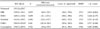
There were no significant differences between measured and estimated REEs, except Mifflin (1264.9 ± 224.8 kcal/day) (Table 3). Mean differences were smallest for Schofield, and largest for Mifflin (- 22.8 ± 172.7 and 128.2 ± 186.9 kcal/day). RMSEs were smallest for HBE and largest for Mifflin (171.3 and 224.6). On Bland-Altman plots, correlation coefficients between mean values and differences were significant for HBE (r = 0.412, p=0.012), tended to be significant for Cunningham (r = 0.283, p = 0.086) and not significant for WHO, Mifflin, and Schofield (Fig. 1).
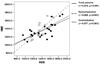
There were no differences in patient characteristics (including measured REE) between DM and non-DM patients, except serum albumin concentration (2.9 ± 0.4 vs. 3.6 ± 0.4 g/dL, p < 0.001) and ECF/TBW ratio (0.37 ± 0.01 vs 0.36 ± 0.01, p = 0.001). Within each group, there were no differences between measured and estimated REEs (data not shown). RMSE was smallest for Schofield (183.4) in DM patients and for HBE (154.5) in non-DM patients. Correlation coefficient between mean value and differences was significant only for HBE (r = 0.721, p = 0.019) in DM patients. In NH patients (n = 14), HBE was close to measured REE, however, HBE under estimated REE in OH patients (n = 24) (Fig. 2)
DISCUSSION
The novel finding of the present study is that except for the Mifflin equation, prediction equations have no significant differences from measured REE in ESRD patients on CAPD. However, HBE showed great bias, and the Cunningham equation tended to show bias when REE values were large. In HBE, its bias seemed to be related to hydration status.
REE is the largest component of total daily energy expenditure. It reflects the energy requirements to maintain and conduct normal metabolic activity of muscle, brain, liver, kidney, and other organs.27 There are direct and indirect methods to measure REE.28 Direct calorimetry has been considered the golden standard for measurements of REE.29. It measures heat production directly, however, it is very difficult to perform and gives no information concerning the substrates used to generate the heat.28 On the other hand, indirect calorimetry measures REE by assessing oxygen consumption and carbon dioxide production.30 This technique can be applied in clinical and research studies as a reference method because it provides accurate information and has good precision.31
In the clinical setting, equations are commonly used to estimate REE because of impracticalities of indirect calorimetry method in terms of cost, equipment availability, and measurement time.32 A number of equations have been recommended for the clinical estimation of REE,5-7 thus it is critical to know the accuracy of these equations. The accuracy of equations has been evaluated in healthy and ill subjects. Siervo et al. studied the accuracy of several equations in normal weight, overweight, and obese women,8 and found that different equations showed best agreement with measured REE values in these weight classes. Moreover, results are similarly conflicting in patients with different diseases. Bott et al. showed that the HBE and Schofield equations showed best agreement with measured REE values in children with bronchopulmonary dysplasia and in healthy children, respectively.9 However, Suman et al. reported that equations underestimated measured REE values, and that the Schofield equation produced results that were closer to measured REE values in children with severe burns.10 In addition, Cuerda et al. reported poor agreement between measured and estimated REE values in anorexia nervosa patients.11
Few studies have addressed agreements between measured and estimated REE in uremic patients. Rigalleau et al. compared values obtained by HBE and REE values measured (obtained by indirect calorimetry) in normal, uremic, diabetic, and uremic diabetic patients,12 and found that HBE overestimated REE in uremic patients but underestimated it in diabetic patients and that individual variations were large in uremic diabetic patients, although HBE values well fitted measured REE values. In the present study, it was found that only the Mifflin equation among HBE, WHO, Schofield, Mifflin and Cunningham equations was significantly different from measured REE. However, HBE significantly underestimated REE when REE values were large in whole and DM patients. The Cunningham equation also tended to show bias. Compared to non-DM patients, serum albumin concentrations were significantly lower and ECF/TBW ratios were significantly higher in DM patients. Furthermore, HBE showed less correlation with measured REE in OH patients than in NH patients. These findings suggest that HBE is affected by hydration status, which causes large variation in agreement, as shown by Rigalleau et al.12 This finding is important because HBE is frequently used in clinical situations for the estimation of REE. Thus, our results indicate that the WHO or Schofield equation seems to be reasonable for use in uremic patients with various hydration status and, when HBE is used, care should be taken to ensure that the patient is in a normohydrated state. We do not know why HBE is affected by hydration status, however, it might be related to different body size between the present population and the subjects of almost 1 century ago.
One interesting finding in the present study is that there was no difference in measured REE between DM and non-DM patients, even after adjusting for LBM (data not shown). Avesani et al. reported that pre-dialysis DM patients had significantly higher REE than non-DM patients.33 The cause of higher REE in uremic DM patients was explained by metabolic derangements such as poor glycemic control33 and accelerated proteolysis, an energy-consuming pathway in DM.34 On the contrary, Rigalleau et al. reported that the differences in REE between normal and DM or uremia seemed to be due to differences in body composition and when REE was adjusted for fat-free mass, it was similar among normal, uremia, and DM.12
Studies that examined REE in patients with chronic kidney disease (CKD) showed conflicting data. Ikizler et al. reported resting hypermetabolism in chronic hemodialysis patients,35 and Neyra et al. showed higher REE in patients who receive dialysis, regardless of the modality, than CKD patients who did not yet require dialysis.36 Conversely, other studies showed that REE of CKD patients was either reduced37 or not different from normal control subjects.38,39 Present our results indicated no difference of REE between normal control and CKD subjects because there were no significant differences between measured and estimated REEs, except the Mifflin equation.
The present study has several limitations. First, the number of subjects enrolled was small, so studies with a larger sample size are needed. Second, our results cannot be applied to other races because there are differences in anthropometric features among races. Third, we used BIA to measure hydration status and LBM. Radioisotope studies are regarded as the standard for ECF and TBW measurements but they are not easily used clinically whereas BIA can easily be performed and has been confirmed to be accurate by a radioisotope study.19,40 The ECF/TBW ratio has also been proposed as a hydration marker.40-43 Furthermore, BIA showed good agreement with dual energy X-ray absorptiometry on measurement of LBM.20
In summary, prediction equations showed no significant differences from measured REE, except the Mifflin equation, in ESRD patients on CAPD. However, HBE significantly underestimates measured REE when REE values are increased. Furthermore, HBE seems to be affected by overhydration.
 XML Download