

 PDF
PDF ePub
ePub Citation
 Print
Print


INTRODUCTION
Hepatitis C virus (HCV) infection is well known to have many extra-hepatic manifestations caused by autoimmune and non-autoimmune mechanisms.1-3 One of the most significant extra-hepatic manifestations of HCV has been shown to be type II diabetes mellitus (DM).4-7 Since type 2 DM is seen two to five times more frequently in patients with HCV-related liver diseases and HCV is two to five times more prevalent in type 2 diabetic patients, a link between chronic HCV infection and type 2 DM is supported.4,8-12 The higher prevalence of type 2 DM in HCV (+) patients is not related exclusively to cirrhosis 4.8. The pathogenesis of the relation between HCV infection and type 2 DM is still obscure.6,13,14 Patients with chronic renal failure often have disorders related to carbohydrate metabolism and insulin resistance (IR), as well as HCV infection.15-17 HOMA (Homeostasis Model Assessment) formula, used in large-scale investigations to measure insulin resistance is also suitable for patients with chronic renal failure.18-20 As far as we know, no research has been performed about the correlation between HCV infection and insulin resistance in patients with chronic renal failure. In this study, the probable relationship between HCV infection and insulin resistance, as well as some of the parameters associated with insulin resistance are evaluated in HCV (+) haemodialysis patients.
MATERIALS AND METHODS
This study was performed with 55 patients who were on regular haemodialysis therapy three times per week. Of the 55 patients, 34 were HCV (+) (20 females and 14 males; average age 40.94 ± 7.06 years; mean BMI: 20.5 ± 3kg/m2, mean dialysis duration 7.18 ± 3.61 years) and 21 patients were negative for HCV and other viral markers (8 females and 11 males; average age 52.62 #x00B1; 20.64 years, mean BMI: 22 ± 4kg/m2, mean dialysis duration 2.91 ± 2.69 years). Creatinine clearance of all patients was below 10mL/min. Patients who were negative for HCV and other viral markers were defined briefly as the HCV (-) group. IR was calculated according to the HOMA formula: [fasting insulin (mU/L)x fasting glucose (mmol/L)]/22.5. Patients were referred to as HOMA IR (+) if their HOMA-IR scores were higher than 2.5. All of the HOMA-IR (+) patients in both groups were referred to as the HOMA-IR (+) subgroup. The control group of 9 healthy subjects was used to compare their insulin and C-peptide levels with the other patients. Insulin, C-peptide and glucose levels were studied at three different venous serum samples taken at 5-minute intervals after 12 hours of fasting.
Subjects with histories of corticosteroid use, pancreatic disease, advanced liver disease or cirrhosis were excluded from the study. Patients with repeated fasting venous serum glucose levels < 110 mg/dL were recruited for the study. All patients were taking parenteral iron, erythropoietin, calcium acetate, calcium carbonate and active vitamin D3 preparations.
Plasma glucose, alanine transferase (ALT), triglyceride and magnesium (Mg) levels were measured with a Roche/Hitachi Modular® P800 module. Insulin level was measured with the Roche/Hitachi Modular® analytics E170 module using a commercial kit (Elecsys insulin kit No: 12017547, Roche Diagnostics). Blood samples taken for C-peptide levels were centrifuged for 4min at 3000 rpm and then examined with immunoradiometric assay (IRMA) using a commercial kit (kit 254 R 13T11 code, Immunotech). For measurement of intact parathyroid hormone (iPTH) levels, the electrochemiluminescence immunoassay (ECLIA) was intended for use on the Roche Elecsys 2010 and Modular Analytics E170 (Elecsys module) immunoassay analyzers. Ferritin levels were measured with the Roche/Hitachi Modular® analytics E170 module. Anti-HCV antibody was examined using a macro ELISA system with the Abbott AxSYM system (Abbott Diagnostics, Inc., Chicago, IL, USA).
Statistical analyses were conducted by using the SPSS (Statistical Package for Social Sciences) for Windows 10.0 software. Results were expressed as means ± SD. Comparisons between groups were made using Student's T-test, Mann-Whitney U test, chi square test or Fisher exact probability test for appropriate data. Simple (Pearson) correlation coefficients between HOMA-IR and measures of variables were calculated, and a stepwise multiple regression analysis was then used to evaluate the independent association of these variables with HOMA-IR. Probability levels less than 0.05 were considered significant.
RESULTS
There were no significant differences between BMI, age and gender of HCV (+) and HCV (-) groups.
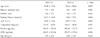
Using the HOMA formula, 22 of 34 HCV (+) (64.7%) and 7 of 21 HCV (-) subjects (33.33%) were found to be IR (+) (Chi square = 5.126, p = 0.024 < 0.05). Insulin levels of HCV (+) patients were significantly higher than both HCV (-) and the control groups. C-peptide levels of HCV (+) and HCV (-) subjects were significantly higher than thoseof the control group (1).
Significant differences were not observed between C-peptide, fasting glucose, triglyceride, ferritin and Mg levels of the HCV (+) and (-) groups. HCV (+) patients were younger and had longer dialysis duration than the HCV (-) group. Insulin, ALT and iPTH levels of the HCV (+) group were significantly higher than the HCV (-) group (Table 2).
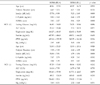
Significant differences were not observed between age, dialysis duration, triglyceride, C-peptide, ALT, ferritin, iPTH and Mg levels of the HOMA-IR (+) and (-) subgroups in both groups. Fasting glucose levels of the HOMA-IR (+) subgroup were significantly higher than the HOMA-IR (-) subgroup in the HCV (+) group (Table 3).
There were no significant correlations between triglyceride, ferritin, ALT, iPTH, Mg levels and HOMA scores in any of the groups. Significant positive correlations were found between HOMA score and insulin (r = 0.958, p < 0.001), HOMA score and glucose (r = 0.432; p < 0.05); age and insulin (r = 0.456, p = 0.049), and age and C-peptide (r = 0.654, p = 0.002); while there were significant negative correlations between age and Mg (r = -0.455; p = 0.050), age and iPTH levels (r = -0.547, p = 0.003) in HOMA IR (+) patients of the HCV (+) group. Also, a significant positive correlation was found between ALT and insulin level in the HOMA IR (+) subgroup (r = 0.374, p = 0.045).
DISCUSSION
Insulin resistance and hyperinsulinemia are important risk factors for atherosclerosis and death due to cardiovascular reasons at about 50% of patients with chronic renal failure.21 Together with many other factors, uremia affects carbohydrate metabolism and insulin resistance.
Some results from this study suggest that HCV infection affects insulin resistance independent of uremia. The most important result is that HOMA-IR positiveness is significantly more prevalent in HCV (+) patients. On the other hand, in the general population, increasing age is a risk factor for insulin resistance, and dialysis therapy improves, but does not normalise insulin resistance.22,23 The results of this study are parallel with the general population with respect to age, because significant positive correlations were found between age and insulin level, and between age and C-peptide level. In addition, in our study, HCV(+) patients had significantly longer dialysis duration (mean 7.18 and 2.91 years respectively). Therefore, we expected to find insulin resistance less frequently in HCV(+) patients because HCV(+) patients were younger and had longer dialysis duration. However, unexpectedly, we found the prevalence of insulin resistance to be higher in HCV(+) patients. These findings also support HCV's contribution to insulin resistance.
Serum insulin level alone can be a good marker for insulin resistance.24 Hyperinsulinemia is a frequent finding in chronic renal failure.24 We found that HCV(+) patients have significantly higher insulin levels than the control and HCV(-) groups. There was no significant difference between the insulin levels of the HCV(-) and control groups, but a positive correlation was found between HOMA score and insulin level in HCV(+) patients. These findings suggest that HCV infection is related to higher insulin levels, independent of uremia, since both HCV(-) and HCV(+) groups had uremia. Serum insulin level may be a good indicator for insulin resistance, especially for HCV(+) haemodialysis patients.
Fasting glucose level is another parameter associated with insulin resistance.24 In this study, HOMA-IR (+) patients had higher fasting glucose levels than HOMA-IR (-) patients in the HCV (+) group and a positive correlation was found between HOMA score and fasting glucose level in HOMA-IR(+) subgroup. High serum glucose levels seen in HCV(+) chronic haemodialysis patients can be related to insulin resistance.
C-peptide is a marker of endogenous insulin secretion and patients with chronic renal failure have high levels of C-peptide.25 In our study, it was also shown that HCV(+) and(-) haemodialysis patients have significantly higher C-peptide levels than the control group. It is not clear whether the high C-peptide levels found in this study are due to reduced metabolism or increased secretion secondary to insulin resistance. However, reduced metabolism is more likely to be the cause, since no significant correlation is observed between C-peptide and HOMA score in any of the groups.
ALT levels are usually used for the screening of hepatitis C infection in chronic haemodialysis patients. However, patients with end stage renal failure have low ALT activity compared to the general population.26-29 High ALT activity may also accompany insulin resistance, but we did not find a significant correlation between ALT level and HOMA score in the HCV (+) group, although HCV(+) patients have higher ALT levels than HCV(-) patients. On the other hand, a positive correlation between insulin and ALT levels was found in the HOMA-IR(+) subgroup. Therefore, high ALT levels seen in HCV(+) chronic haemodialysis patients can indicate hyperinsulinemia, as well as HCV infection.
Many studies show a relationship among insulin resistance and triglyceride, ferritin, iPTH and Mg levels.30-36 However, in this study, no significant correlations were found between these parameters and HOMA score. In addition, no significant correlations were found between HOMA score and ferritin, as well as HOMA score and iPTH levels, most likely doe to characteristics of the patient group in this study since they regularly took parenteral iron, erythropoietin, calcium and active vitamin D3 preparations according to their needs. Usage of 1,25-dihydroxycholecalciferol and erythropoietin preparations in haemodialysis patients improves insulin resistance.23,34,35 High levels of iPTH seen in the HCV (+) group may be an incidental finding, or may result from the younger age of the HCV (+) patients. Increased age is a known risk factor for adynamic bone diseases in patients with chronic renal failure.
Insulin resistance is an independent predictor of cardiovascular mortality in uremic and non-uremic patients.21 Insulin resistance is prevalent in patients with chronic renal failure; and the results of this study indicate the additive contribution of HCV infection to insulin resistance. Therefore, the correlation between HCV and insulin resistance merits further study and consideration.
In conclusion, HCV infection is related to insulin resistance, insulin and glucose levels independent of other factors and high levels of ALT may indicate hyperinsulinemia, as well as HCV infection in HCV (+) chronic haemodialysis patients.

 XML Download