

 PDF
PDF ePub
ePub Citation
 Print
Print


INTRODUCTION
It is well known that an extremely low frequency (ELF) electromagnetic field (EMF) can cause substantial changes at the cellular level.1,2 These biological effects include changes in proliferation and differentiation,3-8 alterations of second-messengers such as Ca2+,9,10 and modifications in shape or morphology.11,12
Concerning the effects of EMF on cells, extrapolation or replication among different studies are complicated because the experimental approach on this topic is characterized by a number of nonlinearities (window effects with respect to frequency, amplitude, and duration) and peculiarities (cell type, age, and treatment).3,13,14 Therefore, cell lines of diverse tissue origin may have different susceptibilities to EMF. This research compared and contrasted the effects of EMF on four kinds of normal human cell lines: hFOB 1.19 (fetal osteoblast), T/G HA-VSMC (aortic vascular smooth muscle cell), RPMI 7666 (B lymphoblast), and HCN-2 (cortical neuronal cell).
Few papers have focused on the exposure timing effects of EMF stimulation on cell cultures.15,16 Thus by examining the effects of EMF at differing durations, the mechanism of cellular responses to EMF may become more obvious. For that reason, durations of EMF exposure varied 1, 3, or 6 hours per day (hrs/d) in this study.
Connexin (Cx) represents a family of proteins that associate as hexamers to form the individual gated cell-to-cell channels that assemble in gap junctions. Although other Cxs can be expressed in osteoblastic cells, gap junctional intercellular communication (GJIC) between these cells correlates best with connexin 43 (Cx43) expression.17 Furthermore, gap junctions have been proposed to be regulated by EMF. The fact that gap junctions are affected by EMF suggests that intercellular communication may be modulated by EMF stimuli.18-20
The objective of the present study was to elucidate the effects of 2 mT, 60 Hz, sinusoidal EMF with varied durations on the structure and function of four kinds of normal human cell lines. It was investigated whether EMF affects proliferation, cell cycle distribution, differentiation, and actin distribution of the cells. In addition, changes of GJIC in hFOB 1.19 cells were observed.
MATERIALS AND METHODS
Reagents, antibodies, and equipment
All reagents used were standard high-quality chemicals from either Gibco (Carlsbad, CA, USA) or Sigma (Saint Louis, MO, USA) unless otherwise stated. Antibodies were purchased from either Santa Cruz Biotechnology (Santa Cruz, CA, USA) or Amersham Biosciences (Buckinghamshire, England). The laboratory equipment used for cell culture was supplied by Nunc (Rochester, NY, USA), BD Falcon (Franklin Lakes, NY, USA), or Corning (Acton, NY, USA).
EMF exposure system and conditions
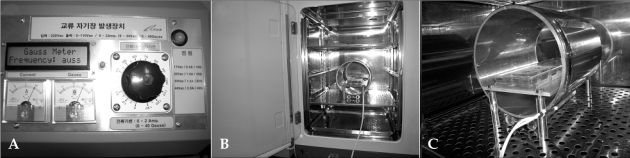
As shown in Fig. 1, an EMF exposure system was self-designed, then manufactured and calibrated by C.U.TECH (Guri, Korea).7 A solenoid part was placed in the incubator but connected to a power supply located outside. The solenoid had a core cylinder of acrylic tube (inner diameter : 20.0 cm, height : 24.0 cm). It consisted of 720 turns of enamel copper wire (diameter : 1 mm) surrounding the acrylic tube. A 60 Hz sinusoidal EMF was generated by feeding a current (0 - 2.0 A) to the coils. The flux density can be set from 0 - 4 mT.
After ethylene oxide (EO) gas sterilization, the solenoid was placed in a cell culture incubator (MCO-15AC, Sanyo, Osaka, Japan). The plates containing cells were placed coaxially with the centerline in the central area of the coils, and the EMFs were perpendicular to the plates. The magnetic flux density was measured using a tesla meter (TM-601, Kanatec, Tokyo, Japan). When energized and adjusted, a very uniform (< 0.3%) EMF can be generated in the center of the coils where cell culture plates were placed. The modest heat due to Joule effect was efficiently dispersed by the continuous forced ventilation in the total mass of the CO2 incubator. The chamber conditions were accurately maintained by the microprocessor proportional-integral-derivative (PID) controller. Temperature and CO2 were monitored by a Thermistor and a thermal conductivity microprocessor control sensor, respectively. Throughout the entire experiment, temperature regulation was 37 ± 0.2℃ and 5% CO2 was provided.
Experimental protocol
Cells were obtained from the American Type Culture Collection (ATCC, Manassas, VA, USA) and cultured in ATCC complete growth media. The media were renewed every 2 to 3 days. All experimental procedures were conducted within a CO2 incubator at a temperature of 37℃, in an atmosphere of 95% air/5% CO2 and 100% relative humidity.
Cells were seeded at a density of 5 × 10³ cells per 9.6 cm2 growth areas. The cells were randomly divided into control and EMF-treated groups. The control group was grown in a separate incubator without an exposure system. The experimental groups were exposed to a 2 mT, 60 Hz, sinusoidal EMF for 1, 3, or 6 hrs/d. Temperature, humidity, and CO2 were measured and adjusted to be identical for both control and experimental groups.
Measurement of alkaline phosphatase activity
Levels of alkaline phosphatase (ALP) in the culture medium were measured using p-nitrophenyl phosphate as a substrate.23
Immunostaining
To identify morphology of the mature cells, the standard immunostaining method was applied.23 Primary antibodies used were mouse monoclonal anti-smooth muscle (SM)-myosin heavy chain (MHC) and anti-SM α-actin for T/G HA-VSMC, anti-c-Myc for RPMI 7666, and anti-vimentin and anti neurofilament M (NF-M) for HCN-2. Briefly, cells were seeded on 18 × 18 mm cover glass and cultured with or without EMF exposure. After washing with phosphate-buffered saline (PBS; 8.00 g of NaCl, 0.20 g of KCl, 0.24 g of KH2PO4, 1.44 g of Na2HPO4 per liter, pH 7.4), the cells were fixed with 4.0% paraformaldehyde for 10 minutes and washed with PBS. The cells were then permeabilized with 0.1% Triton X-100 solution for 10 minutes, and washed again. Then, the samples were blocked with 1.0% bovine serum albumin (BSA) solution for 30 minutes. Primary antibody reaction was performed at 4℃ for approximately 12 hours. The next day, the cells were thoroughly washed several times with PBS. For secondary antibody reaction, goat anti-mouse IgG-fluorescein isothiocyanate (FITC) was incubated at room temperature in a dark room for 45 minutes. Before the samples were covered on slide glasses, they were washed again and mounted with 90% glycerol solution. The results were examined with a fluorescence microscope (Olympus BX60, Olympus Optical Co., Tokyo, Japan) and a MetaMorph imaging system (Universal Imaging Corporation, West Chester, PA, USA).
Measurement of actin filament distribution
Adherent cells were grown on cover glasses. In the case of RPMI 7666, which grows in suspension, cells were attached to poly-lysine treated glass cover slides (0.01% for 30 minutes at room temperature).24,25 Immunofluorescence analysis was carried out using a slightly modified procedure of previously reported techniques.3,7,12,26 To monitor actin distribution, LEICA TCS NT confocal microscopy system (Leica Microsystems, Heidelberg, Germany) was used.
Measurement of GJIC
A standard immunostaining method was applied as described in Berg.14 Cx43 was localized using indirect immunofluorescence. The primary antibody was mouse monoclonal anti-Cx43.
In order to quantify gap junction proteins, the expression of Cx43 was detected by conventional western blotting.7,27 Primary antibodies were anti-Cx43 and anti-glyceraldehyde-3-phosphate dehydrogenase (GAPDH) from mouse. The expression of GAPDH was used to monitor the equivalence of protein loading. Secondary antibodies were horseradish peroxidase (HRP)-linked anti-mouse IgG.
Statistical analysis
Statistical analysis was performed with the SPSS 10.0.1 (SPSS Inc., Chicago, IL, USA). Data are given as the mean ± standard deviation (SD) of at least three different sets of experiments. The data were evaluated for statistical significance using one-way analysis of variance (ANOVA) followed by a Bonferroni test for specific between-group differences. Differences were considered to be statistically significant when *p < 0.05, and highly statistically significant when **p < 0.005.
RESULTS
Effects of EMF on cell proliferation
Initially, cells were seeded at a density of 5 × 10³ cells per 9.6 cm2 growth area. After 4 hours of incubation in order to facilitate cell attachment, cell numbers were measured from control and EMF-treated samples. There was no statistical difference in cell numbers between control and treatment groups (data not shown). Over 14 days, the cells were exposed to a 2 mT, 60 Hz, sinusoidal EMF for 1, 3, or 6 hrs/d. After EMF exposure, almost all cells (> 98%) were viable as assayed by the trypan blue dye exclusion technique (data not shown). In each experimental condition, the cell numbers increased successively after 7 and 14 days of culture.
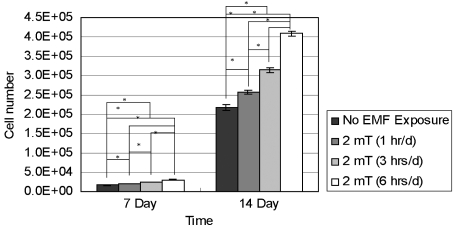
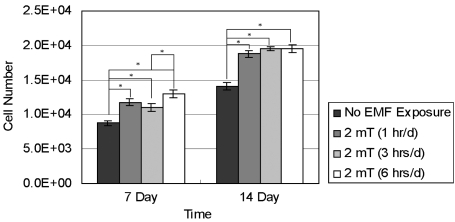
Fig. 2 reports the proliferation of hFOB 1.19 cells (n = 7). The results demonstrate that EMF stimulation enhanced the proliferation of hFOB 1.19 cells after 7 and 14 days of incubation to a statistically significant level. All test groups showed statistically different cell numbers at the indicated time. In addition, growth of hFOB 1.19 cells was directly proportional to the duration of EMF exposure.
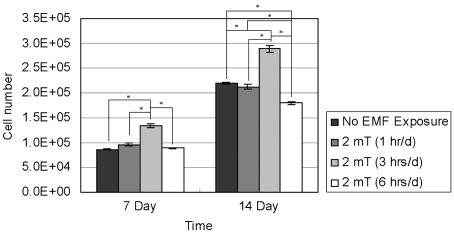
Fig. 3 reports the proliferation of T/G HA-VSMC cells (n = 4). After 7 days of incubation, the 3 hrs/d EMF-treated group showed statistically reduced cell numbers relative to the other groups. After 14 days of incubation, the 3 hrs/d EMF-treated group showed statistically lower cell numbers compared to control and 6 hrs/d EMF-treated groups. The results demonstrated that 3 hrs/d EMF treatment inhibited the growth of T/G HA-VSMC cells after 7 and 14 days of culture. After 14 days of incubation, the 6 hrs/d EMF-treated group showed statistically higher cell numbers than the other groups. The results indicated that EMF stimulation of 6 hrs/d enhanced the proliferation of T/G HA-VSMC cells after 14 days of culture.
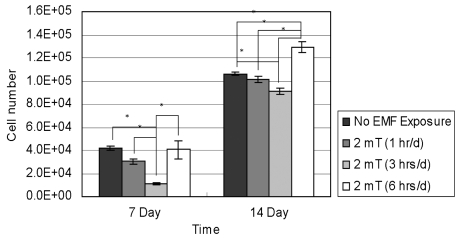
Fig. 4 reports the proliferation of RPMI 7666 cells (n = 4). After 7 and 14 days of incubation, the 3 hrs/d EMF-treated group showed statistically higher cell numbers relative to the other groups. The results demonstrated that 3 hrs/d of EMF treatment statistically significantly enhanced the growth of RPMI 7666 cells after 7 and 14 days of culture. After 14 days of incubation, the 6 hrs/d EMF-treated group showed statistically lower cell numbers compared to the other groups. The results indicated that 6 hrs/d of EMF stimulation inhibited the proliferation of RPMI 7666 cells after 14 days of culture.
Fig. 5 reports the proliferation of HCN-2 cells (n = 5). The HCN-2 cells grew extremely slowly. Regardless of varied exposure time, the EMF-treated groups showed statistically higher cell numbers than the control. The results demonstrated that EMF stimulation significantly enhanced the proliferation of HCN-2 cells after 7 and 14 days of culture.
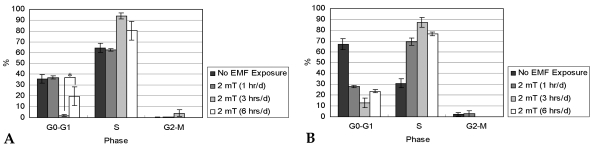
Effects of EMF on cell cycle distribution
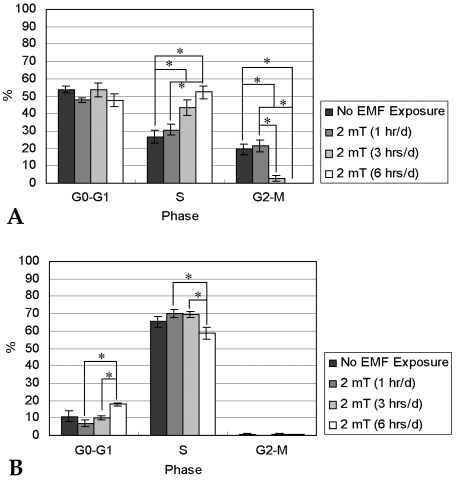
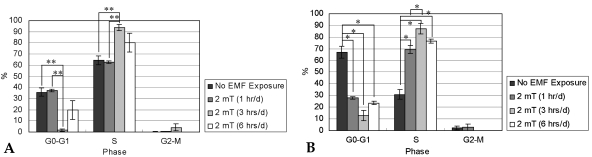
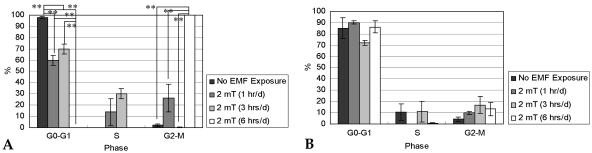
After 7 (A) and 14 days (B) of incubation with or without EMF exposure, percentages (%) of cells in G0-G1, S, and G2-M phases were calculated by flow cytometry.
Fig. 6 shows the cell cycle distributions of hFOB 1.19 cells (n = 5). In each experimental condition, the proportion of S phase cells after 14 days of culture increased compared to that of 7 days of incubation. This finding was paralleled by a corresponding decline in the percentage of G0-G1 and G2-M phase cells. The cell cycle distribution data suggest that hFOB 1.19 cells were capable of proliferating for 14 days of culture. After 7 days of culture, the fraction of cells treated with EMF for 3 or 6 hrs/d in the S phase was statistically higher than that of control cells. This means that EMF exposure of 3 or 6 hrs/d for 7 days enhanced proliferating ability of hFOB 1.19 cells.
Fig. 7 demonstrates the cell cycle distributions of T/G HA-VSMC cells (n = 4). After 7 days of culture, the fraction of cells treated with EMF for 3 hrs/d in the S phase increased to a highly statistically significant level relative to that of control and 1 hr/d-exposed cells. This observation was paralleled by a corresponding decline of the 3 hrs/d group in the percentage of G0-G1 phase cells. This result reflects that EMF exposure of 3 hrs/d for 7 days enhanced the proliferation of T/G HA-VSMC cells. For the control group, the number of G0-G1 phase cells after 14 days of culture was higher than that of 7 days of culture. The enrichment of cells in the G0-G1 phase implies a reduction of proliferating ability in cultures, probably due to accumulation of cell metabolites and medium spoilage, which is typically accompanied by cell death.28 It was observed that EMF stimulation increased the proportion of S phase cells after 14 days of culture. Upon 14 days of incubation, EMF treatment for 1, 3, or 6 hrs/d promoted the growth of T/G HA-VSMC cells.
Fig. 8 describes the cell cycle distribution of RPMI 7666 cells (n = 3). After 7 days of culture, the cells exposed to EMF for 6 hrs/d were arrested in G2-M phases. However, the majority of the remaining cells were present in G0-G1 stages. After 14 days of culture, the cells were mostly arrested in G0-G1 phases.
Fig. 9 demonstrates the cell cycle distribution of HCN-2 cells (n = 4). For the control group, the number of G0-G1 phase cells after 14 days of culture increased. EMF exposure did not affect cell cycle progression of HCN-2 cells.
Effects of EMF on cell differentiation
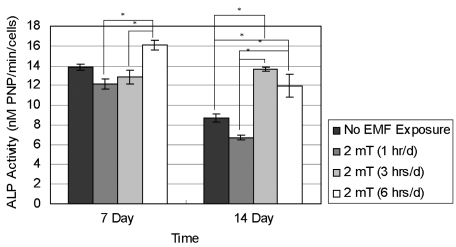
The ALP activity of hFOB 1.19 cells was analyzed after treatment with EMF (Fig. 10). After 7 and 14 days of incubation, ALP activities from the control (No EMF Exposure) and EMF-treated (2 mT) groups were calculated. The bars represent the mean ± SD of four different sets of experiments (n = 4). Upon 7 days of incubation, the cells exposed to the EMF for 6 hrs/d showed a statistically higher ALP level than the cells exposed to the EMF for 1 or 3 hrs/d. At 14 days of culture, the cells exposed to the EMF for 1 hr/d showed statistically lower ALP expression than the cells exposed to the EMF for 3 or 6 hrs/d. In addition, the cells exposed to the EMF for 3 or 6 hrs/d showed statistically higher ALP activity than control cells.
To investigate the morphological differentiation of T/G HA-VSMC cells, fluorescence microscopy analysis of SM-MHC and SM α-actin was performed. According to Lin et al., c-Myc functions at a critical decision point of cell growth to favor proliferation and to block terminal differentiation in B cells.29 Vimentin and NF-M are well-known neuronal markers which are specific for astroglia and axons, respectively. To observe morphological differentiation, expression of c-Myc for RPMI 7666 and vimentin and NF-M for HCN-2, respectively, was visualized by immunofluorescent staining. However, the morphological responses of the cells measured after 42-hour-EMF exposures were undetectable (data not shown).
Effects of EMF on actin distribution
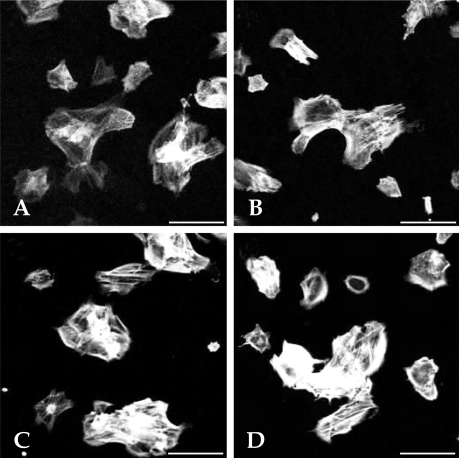
For 7 days, EMF was applied to the cells for 6 hrs/d. The distribution of actin filaments was detected by phalloidin fluorescence. Confocal microscopy analysis from control (Fig. 11A and B) and 42 hour-EMF-treated (Fig. 11C and D) HCN-2 cells are shown. The morphological response of cells measured after EMF exposure was negligible relative to controls. Similar results were found in the experiments using the other cell lines (data not shown).
Effects of EMF on GJIC in hFOB 1.19
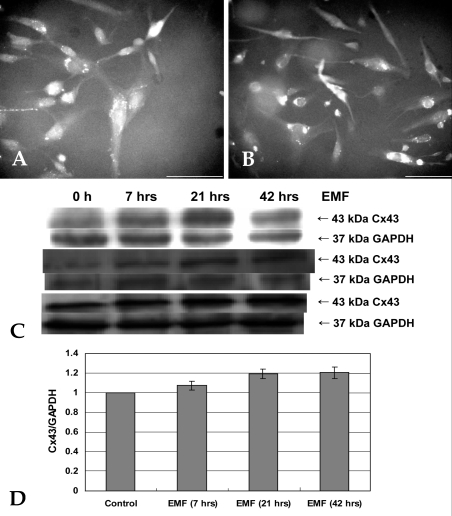
To assess the GJIC in hFOB 1.19 cells, the expression of Cx43 was analyzed. For 7 days, EMF was applied to the cells for 1, 3, or 6 hrs/d. Fluorescence microscopy analysis of Cx43 was performed for control (Fig. 12A) and 42 hour-EMF-treated (Fig. 12B) cells. Immunostained cell processes were observed. However, the cells exhibit no remarkable differences between control and EMF-treated groups. Western blotting (Fig. 12C) and densitometric (Fig. 12D) analyses were carried out with anti-GAPDH and anti-Cx43. The Cx43/GAPDH ratio of the control group was normalized to 1. The bars represent the mean ( SD of three different sets of experiments (n = 3). Corresponding to the image data, no statistically significant differences between control and EMF-treated groups were detected by one-way ANOVA.
DISCUSSION
The observations in this paper support the hypothesis that a 2 mT, 60 Hz, sinusoidal EMF acts on the structure and function of the following cell lines: hFOB 1.19, T/G HA-VSMC, RPMI 7666, and HCN-2. The results pointed to a cell type-specific reaction and to differences in sensitivity of various tissues to EMF exposure. In addition, the cellular responses were dependent on duration of EMF exposure.
In the present study, cell proliferation was the trait most sensitive to EMF. EMF treatment promoted growth of hFOB 1.19 and HCN-2 compared with control cells at 7 and 14 days of incubation. When the exposure time was 3 hrs/d, EMF enhanced the proliferation of RPMI 7666 but inhibited that of T/G HA-VSMC.
Numerous reports point out the effects of ELF EMF on the cell cycle, yet under some conditions a positive effect and under other conditions a negative effect on proliferation was observed.14,30-32 In this study, there was no clear interrelation between EMF-induced cell proliferation and cell cycle distribution. However, it was confirmed that the cell cycle distributions of cells were dependent on duration of EMF exposure.
In previous reports, the increase in ALP activity seems to be a general effect of EMF stimulation on bone cells.33,34 Evidence in the literature suggests that the effects of EMF on bone formation might depend on the maturation stages of the cells being stimulated.35-38 The result implies that the hFOB 1.19 used in this study was an immature cell line, which has a sufficient differentiation potential. On the other hand, the effects of EMF on cell differentiation, which were assessed by mature morphology of the cells, were unclear.
Actin microfilaments have been proposed to represent a cellular interaction site of EMF. Reorganization of cytoskeletal components - especially actin filaments - has been described in human B lymphoid cells after exposure to 1 or 2 mT EMFs,24,25 and a differential actin distribution has been shown in human keratinocytes after exposure to 2 mT sinusoidal EMF.3,12 However, in the present study no remarkable differences were found in the actin content of EMF-exposed cells. It is difficult to explain these controversial results; however, it must be taken into account that studies concerning EMF-induced cellular effects are characterized by a number of nonlinearities and peculiarities.39
It was shown that ELF EMF alters GJIC.18,19 On the other hand, ELF EMF had no effect on total Cx43 protein levels, although GJIC was inhibited in MC-3T3-E1 cells. Moreover, distribution of Cx43 between the cytoplasm and plasma membrane was unaffected. This result was dependent on the differentiation state of the cells in culture, since it was observed only in preconfluent, proliferating MC-3T3-E1, but not after the cells had become more differentiated, nor was it observed in ROS 17/2.8 cells.19,40 In this study, the expression of Cx43 was analyzed to assess the GJIC in hFOB 1.19 cells. However, no clear differences were observed between control and EMF-treated groups. One reason for the disparity in results reported on the responses of bone cells to EMFs may be variation in experimental design. It is possible that Cx43 may not be critical for gap junction function in hFOB 1.19 cells, and changes in Cx43 may not indicate whether EMF stimulation modulates cell activity via intercellular communication.19
Irrespective of possible mechanisms involved in the cellular effects of EMF exposure, this study revealed that a 2 mT, 60 Hz, sinusoidal EMF might serve as a potential tool for manipulating cell proliferation. After better understanding and systemizing the effects of EMF on diverse cell lines, EMF stimuli will be beneficially applied to controlling the growth of various types of cells.
 XML Download