

 PDF
PDF ePub
ePub Citation
 Print
Print


INTRODUCTION
Restenosis remains a significant limitation with regard to percutaneous coronary intervention (PCI). Up to 30% of patients treated with PCI develop restenosis, and the restenosis rate is even higher in diabetic patients.1 This is assumed to be the result of neointimal formation, which is characterized by an inflammatory reaction at the site of injury, the migration and proliferation of vascular smooth muscle cells, and the synthesis of excessive extracellular matrix.2 However, the exact pathogenic mechanisms underlying the development of exaggerated restenosis in diabetes remain poorly understood. A recent report has indicated that longstanding hyperglycemia leads to the generation of AGEs (advanced glycation end products), the products of nonenzymatic glycation/oxidation of proteins/lipids. The accumulation of these compounds induces vessel wall memory and vascular perturbation, culminating in the progression of atherosclerosis, and plaque instability.3 Moreover, in animal arterial stenosis studies, AGEs have been implicated in neointimal formation. According to these reports, AGE receptor/ligand interaction plays a key role in neointimal formation after vascular injury, irrespective of diabetes status. These findings suggest a novel target for minimizing neointimal hyperplasia.4-6 Other reports demonstrated that AGEs may directly influence the structural integrity of the vessel wall and underlying basement membrane, in a receptor-independent manner.7,8 However, the role of AGEs with regard to restenosis in human coronary artery disease (CAD) remains unknown. Therefore, we attempted to determine whether serum AGE levels are associated with in-stent restenosis (ISR), and whether they can be used as a predictor for the development of ISR in diabetic patients.
MATERIALS AND METHODS
Subjects
A consecutive series of patients (n=203), all of whom had symptomatic coronary artery disease successfully treated with stenting, and had undergone follow-up angiography between March 1998 and August 2003 at Yongdong Severance Hospital, was enrolled in this study. We applied the new American Diabetes Association (ADA) criteria for diagnosis of diabetes mellitus. All patients were found to suffer from type 2 diabetes mellitus. The exclusion criteria of this study included impaired renal function (Cr ≥ 2.0 mg/dl), lesions with chronic total occlusion, saphenous vein grafts, and failure to turn up for the follow-up angiographic examination. For the purpose of patient classification, acute coronary syndrome was defined as either acute myocardial infarction, or unstable angina. The body mass index (BMI) was calculated as weight (kg)/height (m)2.
Percutaneous coronary intervention procedure
All patients received bolus unfractionated heparin injections (10,000 U) before procedures. The patients were also given a daily dose of aspirin (200 mg) before the procedure, which was continued indefinitely. Additional daily doses of ticlopidine (500 mg) or clopidogrel (75 mg) were administered for at least four weeks after PCI. The intervention procedures employed the femoral approach, with arterial introducers of size 6.5F. All patients were treated with stenting using balloon expandable, slotted tube, or modular designed bare metal stents. The procedure was considered to be successful if: 1) there were no adverse events or the need for urgent coronary surgery; 2) the quantitative coronary angiography (QCA) estimated residual stenosis was < 30%, and 3) TIMI 3 flow distally was observed immediately after stent implantation.
Quantitative coronary angiography and the follow-up examination
The lesion morphology examination was classified according to the modified American College of Cardiology/American Heart Association grading system, as type A, B1, B2, or C.9 Complex lesions were designated as type B or C lesions. We also performed quantitative computer-assisted offline analysis of the angiogram, using the automated edge-detection system CMS (Medis Medical Imaging Systems, Nuenen, Netherlands). The pre-PCI minimal lumen diameter (MLD), lesion length, percentage of diameter stenosis, and post-PCI MLD were also evaluated via QCA analysis. Before discharge, all patients were advised to turn up in six-months for an angiographic examination. After discharge, the patients were followed up clinically at 2-month intervals. Within 6 months after PCI, patients exhibiting clinical recurrence of the symptoms and angiographic ISR were assigned to the ISR group. At the 6-month follow-up angiography, ISR was defined as > 50% stent stenosis, as determined by QCA analysis.
Analysis of lipid profiles
Total cholesterol was determined by the cholesterol-oxidase method (Daiichi, Tokyo, Japan). Low density lipoprotein (LDL)-cholesterol levels were assessed via the direct enzymatic method, using cholestest LDL (Daiichi, Tokyo, Japan). Triglyceride levels were measured using the glycerophosphate oxidase with glycerol blanking method (Asan, Seoul, Korea). High density lipoprotein (HDL)-cholesterol levels were determined by the direct method, using polyethylene glycol-modified enzymes. Hypercholesterolemia was defined as an LDL-cholesterol level of more than 160 mg/dl, low HDL-cholesterol as an HDL-cholesterol level of less than 35 mg/dl, and hypertriglyceridemia as a triglyceride level of more than 200 mg/dl.
Measurements of the serum levels of AGEs
Blood was collected from all patients immediately prior to initial coronary angiography. The blood samples were transferred to tubes without EDTA, and were centrifuged at 2000 rpm for 20 minutes. Serum was kept frozen at -70℃, until assayed for AGE serum levels. After melting, serum samples (20 µl) were mixed with 480 µl of trichloroacetic acid (0.15 mol/l) in microcentrifuge tubes, and 100 µl of chloroform was added. The AGE serum levels were determined by fluorescent intensity method using a fluorescence spectrophotometer (F-2000 Hitachi Ltd., Tokyo, Japan) at an emission wavelength of 440 nm, with an excitation wave length of 370 nm. The samples were run in triplicate, and peak height mode was used for signal measurements. The intra-assay and interassay coefficients of variation for the determination of AGEs were 7.9% and 10.8%, respectively.10
Statistical analysis
Statistical analyses were performed with SPSS software (Version 11.0 for Windows, SPSS, Chicago, Illinois). In order to avoid an arbitrary cutoff point of the serum AGEs level for prediction of ISR, we performed receiver operating characteristics (ROC) analyses. Comparison of the continuous variables between the subgroups was conducted via Students t-test. Multivariate analysis (logistic regression) was also performed, in order to determine the parameters for the prediction of angiographic ISR. All the tests were two-tailed, and a p < 0.05 was considered to be significant.
RESULTS
Baseline and 6-month follow-up characteristics of the patients
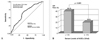
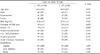
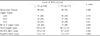
A total of 263 treated lesions from 203 consecutive patients were analyzed in this study. The AGE serum levels in the 203 patients measured in this study ranged from 48.5 U/ml to 283.3 U/ml (151.1 ± 56.5 U/ml, mean ± SD). We tentatively classified these patients using ROC analysis (Fig. 1A). Patients with an AGE level of > 170 U/ml were designated as the high-AGEs group, while those with AGE levels of ≤ 170 U/ml were designated as the low-AGEs group. According to this classification, the high- and low-AGEs groups consisted of 85 patients (115 lesions) and 118 patients (148 lesions), respectively. The baseline clinical characteristics of the two groups were found to match well with regard to various parameters, other than the level of HbA1c and the duration of diabetes (Table 1). The duration after the initial diagnosis of diabetes was longer in the high-AGEs group (8.9 ± 5.8 years) than in the low-AGEs group (4.9 ± 4.3 years) (p < 0.001). The level of HbA1c at baseline was higher in the high-AGEs group (8.3 ± 1.7%) than in the low-AGEs group (7.8 ± 1.5%) (p=0.008). Furthermore, the serum levels of AGEs correlated significantly with HbA1c (r=0.523, p=0.001) and the duration of diabetes (r=0.415, p < 0.01). The quantitative coronary angiography data obtained at the baseline and immediately after the procedure were not significantly different between the 2 groups (Table 2). At the 6-month follow-up, the level of HbA1c was higher in the high-AGE group (8.1 ± 1.6%) than in the low-AGE group (7.1 ± 1.4%) (p=0.024). However, the difference between the level of HbA1c in the ISR group (7.9 ± 1.3%) and that of the non-ISR group (7.2 ± 1.2%) did not reach statistical significance (p=0.234).
Level of serum AGEs and ISR
ROC analysis indicated that the serum level of AGEs showed adequate accuracy for ISR. The optimal cutoff point of AGEs was 170.2 U/ml. ROC area was 0.659; 95% CI 0.589 to 0.729; p < 0.001 (sensitivity=0.619, specificity=0.659) (Fig. 1A). The 6-month follow-up angiographic findings revealed that the overall ISR rate was 28.9%, and the values in the high-AGEs (> 170 U/ml) group were 40.1%, whereas the values in the low-AGEs (≤ 170 U/ml) group were 19.6%. The difference with regard to the ISR rate between the two groups was statistically significant (p < 0.001) (Fig. 1B).
Multivariate Analysis of risk factors for ISR
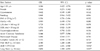
The multivariate analysis of the risk factors for ISR demonstrated that a high level of serum AGEs (> 170 U/ml) constitutes an independent risk factor for the development of angiographic restenosis. (Odds ratio, 2.659; 95% CI, 1.431 - 4.940; p=0.002). Furthermore, the pure AGE levels can be considered to be an independent risk factor for ISR (odds ratio (OR), 1.008; 95% CI, 1.002-1.014; p=0.008). This value, 1.008, represents the value of a 1 U/ml increase of the serum AGE level; small vessel caliber (post MLD ≤ 3.0 mm) (OR, 2.346; 95% CI, 1.249 - 4.406; p=0.008) and a long lesion (implanted stent length ≥ 24 mm) (OR, 2.496; 95% CI, 1.283-4.853; p=0.007) were found to be significantly associated with angiographic ISR. Although weak correlations were observed with respect to hypercholesterolemia, low HDL-cholesterol, smoking, and percentage of HbA1c with development of ISR, none of these factors proved statistically significant. Moreover, no association was observed with regard to age, gender, hypertension, obesity, initial event of acute coronary syndrome, multivessel disease, or complex (B2 or C) lesions (Table 3).
DISCUSSION
Diabetes is closely associated with macrovascular disease.11 Its possible mechanism may involve elevated levels of glucose, resulting in long-term "memory" in the vessel wall, thereby augmenting vascular perturbations.12 A recent report asserted that hyperglycemia leads to the generation and accumulation of AGEs, and that their interaction with the receptor for AGE (RAGE) involves the plausible mechanism of induction of vessel wall memory and sustained perturbation. These processes culminate in the progression of atherosclerosis, plaque instability, and the emergence of clinical symptoms.3
Restenosis and consequent adverse cardiac events are more frequent in diabetics undergoing PCI than non-diabetics. This finding may reflect differences in the nature of restenosis in this population, as compared with in the nature of nondiabetic subjects undergoing comparable interventions. Although a few studies with patients undergoing PCI with a 6-month angiographic follow-up have identified a set of clinical and angiographic predictors of restenosis in diabetes patients, not all the factors relating to the probability of restenosis after stent deployment in this high-risk patients subgroup have yet been established.13 Our analysis demonstrates that the angiographic ISR rate at 6-months follow-up was significantly elevated in the high serum AGEs group. Furthermore, our multivariate analysis revealed that a high level of AGEs is an independent predictive factor for ISR. Considering the findings of other studies, a smaller index of the vessel caliber (assessed by MLD after stenting) and a long lesion (assessed by stent length) were also associated with ISR in our study. However, our data, unlike that of other studies, failed to show any statistical significance for ISR with regard to female gender or low BMI. Our data also showed that the serum levels of AGEs correlated significantly with the duration of diabetes and the level of HbA1c, which reflect recent blood glucose levels. These findings are compatible with the concept that the degree of nonenzymatic glycation is determined largely by glucose concentration and duration of vascular exposure.14 It also suggests that the serum level of AGEs can be controlled by strict blood glucose level control. However, upon multivariate analysis, we found that the effects of high level HbA1c and long-duration diabetes were not statistically significant with regard to the development of ISR. These results are consistent with the fact that HbA1c is only an Amadori-type product, and does not appear to exert direct effects on vascular inflammation or smooth muscle cell proliferation.
Several recent experimental studies have indicated that AGEs can actively participate in neointimal formation after arterial injury. Zhou et al. demonstrated significantly increased accumulation of AGEs and increased immunoreactivities of RAGE and S100/calgranulins in the carotid artery of diabetic rats in response to balloon injury, as compared with that of nondiabetic rats.4 Blockage of the RAGE/ligand interaction significantly attenuated S100-stimulated vascular smooth muscle cell (VSMC) proliferation in vitro and bromodeoxyuridine (BrdU)-labeled proliferating VSMC in vivo, and suppressed neointimal formation and increased luminal areas in Zucker rats, both diabetic and nondiabetic.3 These findings indicate that RAGE/ligand interaction plays a key role in neointimal formation after PCI, especially in diabetics, and also suggest the plausibility of RAGE blockade as a therapeutic target in vascular injury, both in euglycemia and diabetes. According to other reports, AGEs may, in a receptor-independent manner, have a direct impact on the structural integrity of the vessel wall and underlying basement membrane. In particular, excessive cross-linking of matrix molecules such as collagen may disrupt both cell-matrix and matrix-matrix interactions.7 AGEs may also exert their pathogenic effects via the engagement of cellular binding sites/receptors.8 These results support our data that the serum levels of AGEs can be used as an independent predictor for ISR.
AGEs are generated via the polyol pathway. In this pathway, glucose is reduced to sorbitol by aldose reductase (AR); fructose generated by this pathway is converted into fructose-3-phosphate via the activation of 3-phosphokinase. This, then, leads to the generation of 3-deoxyglucosone, a central precursor in the generation of an array of AGEs, in particular, carboxymethyl-lysine (CML)-adducts and others.15 Other studies have determined that administration of epalrestat (an inhibitor of AR) results in a reduction of the level of CML adducts and their precursors in erythrocytes in renal failure.16 According to these results, the administration of epalrestat in diabetics undergoing PCI may induce a favorable effect on ISR development. AGE serum levels, then, can clearly be used as a target guideline for the medical treatment, such as C-reactive protein and lipid profiles, of diabetics who have undergone PCI. The guidance of medical treatment according to AGE serum levels may involve strict blood sugar control and aldose reductase inhibitor administration. Furthermore, AGE serum levels might constitute an important guideline for medical therapy and interventional strategy, for example, drugeluting stents.
The present study has some limitations, largely in the fact that the AGE serum levels were measured only once, just before PCI. A serial followup of AGE levels can provide more accurate information. However, smooth muscle cell proliferation as a cause of in-stent restenosis occurs mainly in the 3 month immediately after PCI, whereas serum AGEs have a longer plasma halflife than that. Therefore, initial AGE serum levels can be considered to reflect the relatively long term effects regarding vascular damage and immunoinflammatory reactions.
In addition, we did not investigate the pathobiologic role of increased serum AGEs in neointimal proliferation at the tissue level in our study. An in vivo tissue study would provide an important clue regarding the role of AGEs. In spite of these limitations, our study is, to our knowledge, the first clinical study revealing that the serum levels of AGEs are good predictors for ISR in diabetics. In conclusion, high serum AGE levels are associated with ISR, and constitute an independent predictor for ISR in diabetic patients. Furthermore, serum AGE levels can be used as an accurate guideline for medical treatment after PCI. Further investigations are warranted in order to elucidate the role of AGEs in ISR after PCI.
 XML Download