

 PDF
PDF ePub
ePub Citation
 Print
Print


INTRODUCTION
Obesity has become a serious public health problem in the western world. Results of the National Health and Nutrition Examination Survey (NHANES) 1999-2000 indicated that approximately 64 percent of US adults were either overweight or obese, defined as having a body mass index (BMI) of 25 kg/m2 or more.1 Overweight and obese individuals are at an increased risk for physical ailments such as hypertension, diabetes mellitus, and coronary artery disease.2
On the other hand, it has been known that malnutrition is highly prevalent from 23 to 73% in end-stage renal disease (ESRD) patients undergoing hemodialysis (HD).3-7 ESRD patients have a lower mean BMI than the general population.8,9 Indeed, ESRD patients are prone to malnourishment due to many causes, including inadequate protein and energy intake, inadequate dialysis, metabolic acidosis, inflammation, and comorbidities.10 Therefore, malnutrition has been known as a predictor of mortality in ESRD patients.11,12
However, recent studies of Western populations suggest that the proportion of overweight or obese patients has increased in HD patients, similar to the trend seen in the general population.13,14 Due to the acceptance of western-style eating habits, obesity has also been rapidly increasing in Korea for the past 10 years.15 However, there is little specific information about whether the current weight statuses of Korean HD patients are similar to that of the Korean general population. There have been several reports on the weight status of Korean HD patients,16-19 although the number of subjects were limited. This study investigates the weight statuses of Korean HD patients through a large-scale comparison of the collected anthropometric data of HD patients to those of a control group.
MATERIALS AND METHODS
Subjects
We used the complete anthropometric data of 10,304 HD patients from the 'Insan Memorial Dialysis Registry' of the Korean Society of Nephrology (KSN) 2002.20 These data was compiled yearly starting in 2001 electronically over the Internet from HD centers in Korea. The response rate was 66.8% in 2002. Among these accumulated data from 2001 to 2002, the most recent follow-up data were selected among serial input data of each patient, because we determined this data would be the most stable. These data set represented 79.2% of all data. Data that had incomplete anthropometric information were excluded. We did not have information as to whether these patients were still undergoing HD at the time of input, transferred to peritoneal dialysis or underwent kidney transplantation, or died. This is because a large proportion of HD patients start dialysis at a university medical center, and then continue at another facility after a short initiation period. After transfer, patient information could no longer be collected due to a lack of cooperation on the part of the private facilities.
Among subjects who underwent health screenings from March 2002 to February 2004 at the health promotion center of Inha University Hospital in Inchon, Korea, 12,436 who were diagnosed as normal were selected as the controls. Subjects who had hypertension, diabetes mellitus, cancer, chronic obstructive pulmonary disease, hyperthyroidism, serum creatinine > 1.4 mg/dl, positive urine protein or blood by dipstick, or were younger than 18 years of age were excluded.
Weight classification
The World Health Organization (WHO) classification for the Asia-Pacific region was used as a reference for weight classification.21 BMIs of < 18.5, 18.5-22.9, 23-24.9, 25-29.9, and ≥ 30 kg/m2 are classified as underweight (UW), normal weight (NW), overweight (OW), obese (OB), and extremely obese (EOB), respectively.
Statistical analysis
Data are expressed as mean values ± S.D. The control and HD groups had different distributions of BMI. Therefore, to compare weight statuses between the two groups, we classified patients according to age: ≤ 29, 30-39, 40-49, 50-59, 60-69, and ≥ 70 years. Duration of HD was classified as < 1 year, 1-3 years, 4-6 years, 7-9 years, and ≥ 10 years. Within each sex and age group, mean values of height and body weight between two groups were compared using an independent T-test with Levene's test for equality of variances. Median values of BMI between two groups were compared using the Mann-Whitney U test. Chi-squared tests were used to examine the prevalence ratio and a 95% confidence interval was used to compare the proportion of UW in HD patients against the controls in each age group. For the HD patients, 5 classes of HD duration were transformed to continuous numbers from 1(HD duration < 1 year) to 5 (HD duration ≥ 10 years) and a linear curve was estimated between the proportion of UW and HD duration. Spearman correlation coefficients were also used for correlation analysis between the proportion of UW and HD duration. A p-value less than 0.05 was considered significant throughout the statistical analysis. All analyses were conducted using SPSS 12.0 (SPSS, Inc., Chicago, IL, USA), and the graphs were made using SPSS and KaleidaGraph 3.6 (Synergy Software, Reading, PA, USA).
RESULTS
Anthropometric characteristics
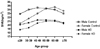
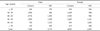
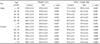
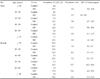
Table 1 shows the distribution of subjects according to age group and sex. In the controls, the numbers peaked at the 5th decade for both sexes. In HD patients, the numbers peaked at the 7th decade in males and the 6th decade in females. In spite of the differences in the distribution of numbers, body weights were significantly lower in HD patients of all age groups, regardless of sex (Table 2). For males, heights were significantly higher in the controls than in the HD patients until the ages reached the 6th decade. The male height differences for controls and HD patients were reversed after the 7th decade. In females, heights were significantly higher in the controls than in HD patients up to the 4th decade. The heights were similar at the 5th decade, and then, were reversed after the 6th decade. Median values of BMI were significantly lower in all age groups of HD, regardless of sex (Fig. 1). In particular, the greatest difference in the BMIs between the controls and HD was seen in the oldest female age group.
Weight status according to the WHO classification
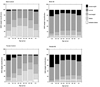
Fig. 2 shows the weight status distribution for the controls and HD patients. The proportions of OW and OB in the male controls showed a reversed U-shape, peaking at the 5th and 6th decades, and those of NW and UW were relatively small. In the female controls, the proportions of OW and OB increased progressively with age. On the contrary, the proportions of NW and UW in HD patients were large, up to more than 70%, and those of OW and OB were small in both sexes.
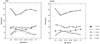
When the comparison was restricted to the proportion of UW, UW was seen significantly more in HD patients than in the controls for each age group (Table 3). HD patients in their 6th decade showed the highest prevalence percentages UW in HD for both sexes (Male: 17.33, Female: 17.68).
DISCUSSION
This study presents new information about the current weight statuses of Korean HD patients, compared to control subjects. HD patients had significantly lower body weight (BW) and a higher prevalence of UW than the controls across all age groups and in both sexes. In the control group, the proportion of OB was large enough to occupy almost 40% at the peak age group. The prevalence ratio of UW was greatest at the 6th decade of age in HD patients. The proportions of OW and OB were small in HD patients of all ages. The percentages of UW were linearly related to HD duration in both sexes.
Due to increased acceptance of Western eating habits, obesity has recently become a serious health problem in Korea. According to Kang and Kim,22 the prevalence of obesity (BMI > 25 kg/ m2) among healthy Korean adults has increased rapidly over the past 10 years, representing about 33.1% in 2000. The proportion of UW has decreased to less than 5% in the Korean general population. In that study, BMI was shown to increase until the 5th decade in men, and then decrease, showing a reversed U-shape. In females, BMI increases until the 7th decade, and then decreases. In this study, the control group showed the same BMI trends according to age groups, thus suggesting that anthropometric characteristics of the control group reflect those of the general Korean population.
Among Korean HD patients however, this study showed that UW was still prevalent and that OB was not seen in great proportions. There have been several studies about the nutritional status of Korean HD patients over the past 15 years. Kim et al. reported that, among 88 HD patients, the percentage at their ideal body weight was 99.8 ± 11.4% in males and 100.8 ± 14.5% in females.16 Han et al.17 reported that the mean BMI of 67 HD patients was 21.2 ± 2.6 kg/m2. Among those patients, BMI of those with good nutritional status was 22.7 ± 2.4 kg/m2 and those suffering malnutrition was 20.3 ± 2.4 kg/m2. Kim et al. reported that, among 54 HD patients, 44.4% had normal BMI (22.97 ± 2.92 kg/m2), 38.9% were mildly to moderately malnourished (20.04 ± 1.94 kg/m2), and 16.7% were severely malnourished (19.03 ± 1.25 kg/m2) by subjective global assessment.18 Lee et al. reported that the mean BMIs of males and females were 20.87 ± 2.21 kg/m2 and 21.57 ± 3.37 kg/m2, respectively, among 50 HD patients.19 The number of subjects in these studies were small, but most of the HD patients belonged to NW or UW by WHO weight classification. Our results were similar to these studies. Therefore, during the past 15 years, no significant improvement in weight status has been seen in Korean HD patients.
However, recent data from US and Europe suggested that, in parallel with the increasing overweight and obesity in the general population, there was a greater proportion of overweight or obese patients in the dialysis population.13,14 The weight statuses of 9,714 HD patients in the US and Europe showed that 60% had a BMI of > 23 kg/m2 and about 16% had a BMI of < 20 kg/m2.13 In another study, mean BMIs were lower in younger Caucasian HD patients but increased to become similar at around 40-60 years of age, and then decreased after the age of 60 in HD patients when compared to the general population.14 In a Spanish study,23 38% of 190 HD patients had a BMI of > 25 kg/m2. When the weight statuses of dialysis patients were evaluated at the time of kidney transplantation, OW and OB were prevalent and the most common nutritional condition was eclipsing protein-energy malnutrition.24 Therefore, a considerable proportion of patients seems to be OW or OB in the western HD population, a striking contrast to the results of this study. We used only anthropometric variables for the assessment of weight status. We did not have information regarding hydration status. Therefore, the weight of some subjects classified as NW might have been overestimated as a result of edema. Considering these facts, our study suggests that, while obesity has been a problem in the Korean general population, protein-calorie malnutrition is still a significant problem in the Korean HD population.
It is extremely important to know why Korean HD patients' weight statuses did not improve as the general population was rapidly becoming OW or OB. The characteristics of these HD patients point to several possible causes. First, the number of patients undergoing long-term HD has been gradually increasing. Those with HD duration > 5 years were 36% in Insan Memorial Dialysis Registry 2003.25 HD duration was already suggested as one of the causes of malnutrition.26,27 Our results agree with these reports. Long-term HD patients might have inadequate energy intake and micronutrient deficiencies.27 Second, the proportion of diabetic patients has been constantly increasing, as they account for almost 50% of new ESRD patients.25 It is known that diabetic patients are more likely to be malnourished and have more comorbid conditions than others.7,28,29 Third, the average age of HD patients is rising. After 2002, the largest percentage of HD patients belonged to the 7th decade of age.25 Several studies have shown that in Western populations, older patients are at a higher risk of developing protein-energy malnutrition than those younger.7,30 Our results also showed that older patients were more likely to be classified as UW than others. This might be due to the fact that elderly patients have greater difficulty purchasing and preparing food, have reduced appetites, suffer intercurrent illnesses, and have decreased mobility and cognitive functions.31 Fourth, HD patients might suffer inadequate protein and energy intakes. Their protein intake, estimated from the normalized protein catabolic rate (0.927 ± 0.251 g/kg/day for males and 1.074 ± 0.307 g/kg/day for females),25 was still lower than the recommended daily protein intake (1.2 g/kg/day).32
There were several limitations in this study. In the present study, we simply used BMI for the classification of weight status. BMI may not accurately reflect body composition. However, among several anthropometric variables, BMI is a simple and easy method to calculate a standardized measure of body size. It is widely used in epidemiologic research to define both a normal range for body size and a grading of overweight and obesity.33,34 It is also known as a predictor of mortality in HD patients.6,35 We did not investigate the differences of weight status between DM and non-DM HD patients. We are planning to study the characteristics of diabetic HD patients in Korea.
In summary, Korean HD patients seem to have different weight statuses when compared to western HD populations. Also, protein-calorie malnutrition may still be an important nutritional condition.

 XML Download