

 PDF
PDF ePub
ePub Citation
 Print
Print


INTRODUCTION
Stress has been measured in three aspects: stressors, stress responses and individual characteristics (personal resources, behavior patterns, coping styles). These varying aspects of stress measures are important in planning treatments and evaluating the effects of treatments.1 Among them, stress responses include sympathetic arousal such as an increase in the release of stress hormones like catecholamines and corticosteroids. An increase in physical factors such as heart rate, blood pressure and muscle potential has also been documented as a stress response. In addition, changes in psychological factors such as increases in fear, anxiety and anger, and decreases in cognitive ability and sensitivity to others may be elicited. Some of the psychophysiological effects of stress can be seen as either adaptive, in that they prepare the individual to respond, or nonadaptive, because they may be damaging to one's health.2
In particular, individual differences in physiological reactivity to psychological stress have also been well established.3-5 Some individuals (reactors) respond to stressful stimuli with greater autonomic arousal than do others (nonreactors).6 In most illnesses, the more observable symptoms are preceded by less recognizable and less disabling symptoms (e.g. physical arousal), which go unnoticed to the unaware.7 Therefore, physiological changes may be used as an important cue for the assessment of stress.8
In clinical practice, somatization is the most common psychiatric problem observed in primary care, followed by depression and anxiety.9-11 Somatic symptoms were most frequently complained of by psychiatric outpatients in Korea with depressive disorders, followed by somatoform disorders and anxiety disorders.12 It was reported that even among healthy people, approximately 80% complain of somatic symptoms.13
Somatization is common among Koreans, and the word 'hwabyung' is used to define any Korean culture-specific somatization.14-16 Koreans tend to convert their conflicts into somatic symptoms.17,18 Under stress, verbalization is more frequently replaced by physical symptoms. Moreover, these symptoms emerge with other complicated clinical features, such as anxiety disorders, depressive disorders, or somatoform disorders.16 Such somatization was also reported by elderly people who had emigrated to America from Korea.19,20
The tools used to measure somatic symptoms to date include the Whaler Physical Symptoms Inventory,21 the Patient Health Questionnaire (PHQ)-15,22 and the somatization subscale of the Symptom Checklist-90-Revised (SCL-90-R).23 However, tools to assess stress-related somatic symptoms have rarely been developed. The Stress Response Inventory (SRI),24 which includes emotional, somatic, cognitive and behavioral stress responses, was developed in Korea but includes only a limited number of items on the somatic symptoms. Therefore, the goal of this study was to develop a tool that could assess a broad range of stress-related somatic symptoms, and then to use the scale in clinical practice.
MATERIALS AND METHODS
Subjects and procedures for preliminary survey
The subjects used for the preliminary survey were 109 healthy adults (56 men, 53 women) over 20 years of age (mean ± SD, 41.6 ± 11.0 years). The mean (S.D.) length of education was 14.1 (3.3) years, and the mean (S.D.) monthly income was 2,485 (730) U.S. dollars. Eighty-three subjects were married, 22 were single, and the marital status of four was unknown. They were sent a letter of informed consent and a questionnaire, along with a written explanation of the study. All but six subjects responded to the questionnaire and returned it to the authors. The subjects were asked: "What kind of physical responses do you have under stress?" Participants were also required to write 10 somatic responses to stressful situations, beginning with the most common, along with their demographic characteristics.
The responses obtained from these 109 subjects were subgrouped according to similarity in content and expression, and the frequencies were checked for each response item. It was found that 40 responses were repeated more than five times.
Subjects and procedures for preliminary questionnaire
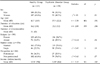
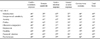
The 33 most commonly-mentioned items (those appearing more than nine times) were selected to create a preliminary questionnaire. At that time, the research team, comprised of 10 psychiatrists and psychologists, agreed on these 33 items. Each item on the preliminary questionnaire was arranged in a Likert-type format: 'Not at all' (0 point), 'Somewhat' (1 point), 'Moderately' (2 points), 'Very much' (3 points), or 'Absolutely' (4 points). The preliminary questionnaire was completed by 215 healthy subjects (108 men, 107 women) who were 20 years of age or older (mean ± S.D., 41.7 ± 10.4 years). Other sociodemographic characteristics of this group are described in Table 1. The subjects included hospital employees and family members of medical students. They were sent a letter of informed consent and a questionnaire, as well as a written explanation of the study. All but 11 subjects responded to the questionnaire and returned it to the authors. Before they were screened for the presence or absence of any physical or psychiatric disorders via the questionnaire, the hospital employees were contacted directly by psychiatric residents to ensure that they had no physical or psychiatric disorders. For the family members of medical students, the medical students were asked to check for the presence or absence of physical and psychiatric disorders and to include in the study only those subjects who had no disorders. According to the self-report questionnaire, none of these subjects reported being treated for physical or psychiatric disorders or having symptoms of such disorders. In addition, all of the test subjects were found to be within normal limits in their annual physical check-ups.
The comparison group for the discriminant validity test was composed of patients who had been diagnosed with anxiety disorders, depressive disorders, or somatoform disorders at the Department of Psychiatry at Severance Hospital. These patients were serially selected and interviewed, and given a verbal and written explanation of the outline of the study. Only those patients who granted informed consent were given the questionnaires
The anxiety disorder group consisted of 45 patients with panic disorder, 13 with generalized anxiety disorder, and 13 with phobic disorder (40 men and 31 women in total; mean (S.D.) age 37.9 (11.6) years). The depressive disorder group included 45 patients with major depression and 28 with dysthymic disorder (32 men and 41 women in total; mean (S.D.) age 38.3 (12.3) years). The somatoform disorder group was made up of 22 patients with undifferentiated somatoform disorder, nine with somatization disorder, 11 with pain disorder, three with hypochondriasis, and two with conversion disorder (26 men and 21 women in total; mean (S.D.) age 37.3 (13.1) years). The sociodemographic characteristics of the patients are described in Table 1.
The diagnoses were made by an experienced psychiatrist using the DSM-IV criteria.25 Patients with other diagnoses were excluded from this study.
All 215 healthy subjects completed the Korean version26 of the SCL-90-R23 at the same time. The SCL-90-R is a 98-item self-rating instrument for assessing a person's psychopathology during the last week, and it includes nine subscales. The test-retest reliability of the preliminary questionnaire was calculated by the first and second testing by 62 randomly-selected subjects from the original 215 subjects after a two-week interval. Factor analysis was conducted and the factors were labeled.
Data analysis
A factor analysis was conducted using an oblique rotation after the maximum-likelihood factor analysis was completed. An independent t-test was used to compare the subscale scores and the total score of the SSRS between the patient and healthy groups. An analysis of variance was conducted to compare the subscale scores and the total score between each of the disorder groups and the healthy groups. The Scheffe test was then employed as a post-hoc test to consider differences in the number of patients in each subgroup.
The convergent validity of the subscale scores and the total score of the SSRS was calculated with the subscale scores of the SCL-90-R using a Pearson's correlation. The test-retest reliability of the subscale scores and the total score of the SSRS was calculated using a Pearson's correlation on the first and second testing. The internal consistency of the subscales and the total score were calculated using Cronbach's α.
A comparison of the subscale and the total SSRS scores according to sociodemographic characteristics (sex, occupation: professional or non-professional, marital status: married or single, and religion: present or absent) was made using an independent t-test. The relationships of age, education, income and the duration of illness with the test scores was examined using a Pearson's correlation. A multiple regression analysis was computed to determine the effect of the sociodemographic variables, with the dependent variable being the total score and the independent variables being those sociodemographic characteristics that had been confirmed as significantly influencing the total score.
RESULTS
Sociodemographic characteristics of the subjects
The healthy group was significantly older, and had higher educational and income levels than the patient group, whereas the members of the patient group were more likely to be religious than the healthy group members. No significant differences were found between the two groups with respect to sex, marital status or occupation (Table 1). There were also no significant differences in terms of sex (χ2 = 2.70, df = 3, p = .44) or age (years, mean ± s.d. depressive disorder 38.3 ± 12.3; somatoform disorder 37.3 ± 13.1; anxiety disorder 37.9 ± 11.6; healthy controls 41.7 ± 10.5, F = 3.87 df = 3, 402 p = .01, Scheffe test p > .05) among the four groups including the three patient types and the healthy controls.
Factor analysis of the SSRS
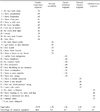
Factor analysis was conducted on 33 items, using an oblique rotation after a maximum-likelihood factor analysis, which produced five factors with an eigen value greater than one. Among them, 32 items with a factor loading greater than .3 were extracted. The statement like 'I am easily fatigued' was removed from the questionnaire because its factor loading was less than .3. In the case of those items with a factor loading greater than .3 on more than one factor at the same time, the greatest one was extracted.
The first factor, labeled "cardiorespiratory and nervous response" (referred to as cardiorespiratory response), was found to have the highest eigen value (13.79), and accounted for 41.8% of the responses. This was followed by the second factor, labeled "somatic sensitivity", the third factor, labeled "gastrointestinal response", the fourth factor, labeled "general somatic response", and the fifth factor, labeled "genitourinary, eye and muscular response" (referred to as genitourinary response). Each item's factor loading is listed in Table 2.
The SSRS was finalized with a total of 32 items under the five subscales. There were 11 items under the cardiorespiratory response subscale, five items under the somatic sensitivity subscale, eight items under the gastrointestinal response subscale, four items under the general somatic response subscale, and four items under the genitourinary response subscale.
The FITMOD program was used to determine the fitness of the factors. It was found that the root mean square error of the approximation (RMSEA) index was 0.05. This suggests that the five factors originally extracted from the factor analysis are likely to be fit.
Reliability of the SSRS
Test-retest reliability
The test-retest reliability of the five subscale scores and the total score was computed by a first and second testing. It was at a significant level (p < .001), ranging from .86 to .94 (r).
Internal consistency
Cronbach's α was computed for the five subscale scores and the total score of the 215 subjects. The result was significant (p < .01), ranging from .72 to .92 for each of the five subscales, and .95 for the total score.
Correlations of the SSRS subscales
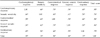
The correlations between the total score and each of the subscale scores, as well as the correlations between the subscales, were all significant. Their levels ranged from .50 to .95 (Table 3).
Item-subscale total correlations
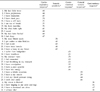
The response item scores of the five subscales correlated significantly with the subscale total score of the SSRS (Table 4).
Validity of the SSRS
Convergent validity
The convergent validity of the SSRS was computed by correlating the scale scores with the somatization subscale scores and the other subscale scores of the SCL-90-R. The five subscale scores and the total score of the SSRS correlated significantly with the somatization subscale and the other subscale scores of the SCL-90-R (Table 5).
Discriminant validity
The discriminant validity was computed by comparing the scores of all the patients in the disorder groups (anxiety disorder, depressive disorder and somatoform disorder patients) with those of the healthy group, and by comparing the scores of each disorder group with those of the healthy group. The patient group scored significantly higher than the healthy group on the cardiorespiratory response subscale (17.1 ± 10.3 vs. 7.8 ± 7.3, t = 10.39 df = 338 p < .001), the somatic sensitivity subscale (2.6 ± 2.9 vs. 1.8 ± 2.4, t = 2.81 df = 403 p = .005), the gastrointestinal response subscale (9.0 ± 6.6 vs. 5.2 ± 5.3, t = 6.41 df = 365 p < .001), the general somatic response subscale (4.4 ± 3.5 vs. 2.7 ± 2.6, t = 5.67 df = 351 p < .001), the genitourinary response subscale (5.9 ± 3.9 vs. 3.1 ± 2.8, t = 8.18 df = 336 p < .001), and the total SSRS score (38.9 ± 3.6 vs. 20.5 ± 17.8, t = 8.78 df = 351 p < .001).
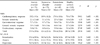
The subscale scores of each disorder group were compared with those of the healthy group, and all three disorder groups had significantly higher values on the cardiorespiratory response, gastrointestinal response, general somatic response, and genitourinary response subscales, and the total SSRS score than the healthy group. Only the depressive disorder group scored significantly higher on the somatic sensitivity subscale than the healthy controls scored (Table 6).
Each of the disorder groups scored significantly higher than the healthy controls on the somatization subscale of the SCL-90-R. However, no significant differences were found between each of the disorder groups. In a comparison of the SSRS scores between each of the disorder groups, the depressive disorder group scored significantly higher on the genitourinary response subscale than the anxiety disorder group did (p < .05) (Table 6).
Relationship between the sociodemographic variables and the SSRS scores
For the healthy group, several significant relationships between the sociodemographic variables and the SSRS scores were found. When compared according to sex, females scored significantly higher on the total SSRS score than did males (17.4 ± 16.4 vs. 23.7 ± 18.7, t = - 2.63 df = 213 p = .009). The income (r = - .16 p =.02) and education (r = - .20 p = .003) levels had significant negative correlations with the total score. However, age had no significant correlation with the total score (r = - .04 p = .57). No significant differences according to the marital status (married vs. single, 18.7 ± 15.4 vs. 22.5 ± 21.6 t = - 1.11 df = 59 p = .27), occupation (professional vs. nonprofessional, 16.8 ± 17.6 vs. 20.7 ± 18.5 t = - 1.32 df = 158 p = .19), or religion (present vs. absent 21.4 ± 18.9 vs. 18.6 ± 15.9 t = 1.07 df = 05 p = .29) were found in the total SSRS score.
A multiple regression analysis was conducted to control for sociodemographic variables such as age, education level, and income. It was found that regardless of the sociodemographic variables, the patient group scored significantly higher than the healthy group in the total SSRS score (R2 = .18 F = 21.49 p < .001; B = 16.39, β = .37 p < .001).
A significant negative correlation was found between the duration of illness and the cardiorespiratory response subscale scores for the anxiety disorder group (r = - .24 p = .04). However, no significant correlation was found between the duration of illness and the scores of the other subscales (anxiety disorder group r = - .19 ~ - .06 p = .11~.64; depressive disorder group r = - .06 ~ .11 p = .33~.86; somatoform disorder group r = .08~.20 p = .17~.61) or the total SSRS score for any disorder group (anxiety disorder group r = - .22 p = .07; depressive disorder group r = .03 p = .82; somatoform disorder group r = .14 p = .34).
DISCUSSION
Five subscales (cardiorespiratory response, somatic sensitivity, gastrointestinal response, general somatic response, and genitourinary response) were identified after a factor analysis was performed for all the items of the SSRS.
The factor analysis results could be characterized in three ways. First, the items identified for the cardiorespiratory response subscale (11 items) were the most common. This was followed by the items for the gastrointestinal response subscale (eight items), and the items for the somatic sensitivity subscale (five items). Second, the cardiorespiratory response subscale (41.8%) accounted for the largest proportion of the scale, followed by the somatic sensitivity and the gastrointestinal response subscales. These results suggest that cardiorespiratory symptoms are possibly the most common among stress-related somatic responses. Third, the genitourinary response subscale constitutes mainly aging-related somatic symptoms.
The test-retest reliability was significantly high, as was the internal consistency for each subscale and the total score. The correlations between each of the five subscales and the total score, as well as the correlations between each of the items and the subscale scores, were all significant. These results indicate that the SSRS is highly reliable and stable.
The convergent validity was checked by correlating the SSRS with the Korean version18 of the SCL-90-R somatization subscale. It was found to be significant, with high correlations between the five subscale scores or the total score, and the somatization subscale scores of the SCL-90-R.
The patient group scored significantly higher than the healthy group on all of the five subscales as well as the total SSRS score. Among the patient subgroups, each of the disorder groups had significantly higher scores on the cardiorespiratory response subscale, gastrointestinal response subscale, general somatic response subscale, genitourinary response subscale and the total SSRS score than the healthy group. These findings suggest that the patient group is likely to have a broader range of stress-related somatic symptoms than the healthy group, and that the former is likely to have a higher level of stress than the latter. In addition, only the depressive disorder group scored significantly higher on the somatic sensitivity subscale than the healthy controls. This same group also scored significantly higher on the genitourinary response subscale than the anxiety disorder group (Table 6). These results could contribute to the discriminant validity of this instrument. It is also suggested that the somatic sensitivity and genitourinary responses are associated with the depressive disorder group.
Regarding the relationship between sex and scale scores in the healthy subjects, females scored significantly higher than males in the total score, which indicates that somatic symptoms are more prominent in women than in men. In terms of income and education level, these variables were found to have significant negative correlations with the total SSRS score, which indicates that these demographic variables may be associated with somatic symptoms.
The clinical application of the SSRS showed that the depressive disorder group scored significantly higher on the genitourinary response subscale than the anxiety disorder group did. This finding suggests that depressive disorder patients experience more specific somatic responses than anxiety disorder patients do.
Depressive disorder, anxiety disorder and somatoform disorder patients scored significantly higher on the somatization subscale of the SCL-90-R than did the healthy group. However, no significant differences were found between each of the disorder groups. This indicates that the SSRS is more useful than the somatization subscale of the SCL-90-R in assessing a broad range of stress-related somatic symptoms.
No significant correlations were found between the duration of illness and the total SSRS score for each disorder group. However, for the anxiety disorder group, the duration of illness had a significant negative correlation with the scores of the cardiorespiratory response subscale. This finding suggests that for this disorder group, the chronicity of illness may be negatively associated with the degree of severity in cardiorespiratory symptoms.
Some may question why the anxiety disorder patients did not obtain the highest scores on the cardiorespiratory response subscale, despite the fact that the scores of this subscale had the highest correlation with the scores of the SCL-90-R anxiety subscale in the healthy subjects. As shown in Table 6, however, the depressive disorder patients had higher scores on the anxiety subscale of the SCL-90-R than did the anxiety disorder patients. These findings indicate that the depressive disorder patients are likely to have a higher level of anxiety and its related cardiorespiratory symptoms than are the anxiety disorder patients. Higher scores on the subscales of other somatic symptoms, such as somatic sensitivity, gastrointestinal response, general somatic response and genitourinary response, were also found in the depressive disorder patients than in the anxiety disorder patients. These findings could be because depressive disorder patients are more likely to have a higher level of anxiety than anxiety disorder patients.
In conclusion, these results suggest that the SSRS is highly reliable and valid, and that it can be effectively utilized as a measure for research of the somatic symptoms related to stress. In addition, somatic sensitivity and genitourinary responses are likely to be associated with depressive disorders.
 XML Download