

 PDF
PDF ePub
ePub Citation
 Print
Print


INTRODUCTION
A substantial amount of data indicates that insulin resistance plays a major role in the development of glucose intolerance and type 2 diabetes. Insulin resistance is a consistent finding in patients with type 2 diabetes, and resistance is present years before the onset of diabetes.1 Prospective studies show that insulin resistance predicts the onset of diabetes.2 The term 'insulin resistance' indicates an impaired biologic response to either exogenously administered or endogenously secreted insulin. Insulin resistance is manifested by decreased insulin stimulated glucose transport and metabolism in adipocytes and skeletal muscle, and by impaired suppression of hepatic glucose output. Insulin sensitivity is influenced by a number of factors, including age, weight, ethnicity, body fat, physical activity, and medications. It has been reported that insulin resistance is associated with adiposity, particularly that which is centrally deposited, which is metabolically more active than that which is peripherally deposited.3,4 Insulin resistance is also associated with hypertension and dyslipidemia (increased triglyceride and decreased HDL cholesterol levels) in type 2 diabetic subjects.4-7
In this study, we compared the clinical and biochemical characteristics of insulin-sensitive and insulin-resistant type 2 diabetic subjects, in order to assess the implications of insulin resistance in these diabetic patients, and to determine their clinical and biochemical profiles.
MATERIALS AND METHODS
A total of 122 type 2 diabetic patients at the Severance Hospital (YUMC) clinic participated in this study. The study protocol was approved by the ethical committee of Yonsei University College of Medicine. Clinical data and informed consent were obtained from each patient. BMI (body mass index) and WC were recorded. Body fat content was measured by bioelectric impedance meter (InBody 3.0, Biospace, Korea). Hypertension was diagnosed if the patient had a blood pressure greater than 130/85 mmHg or was on antihypertensive therapy at the time of the study. The diagnosis of nephropathy was made when daily albumin loss exceeded 300 mg. Retinopathy was evaluated by fundoscopic examination and by fluourescein fundus angiography, and neuropathy was diagnosed with peripheral neuropathy by nerve conduction velocity. Patients with coronary disease were documented by angiography or through a history of angina and acute myocardial infarction. Patients with CVD were documented by brain MRI (magnetic resonance imaging) or a history of stroke. Plasma glucose was measured using the glucose oxidase technique on an autoanalyzer (Beckman, Fullerton, CA, USA). HbA1C was analyzed by high performance liquid chromatography (HPLC) (Variant II, Bio-Rad, Hercules, CA, USA). Insulin and C-peptide (fasting, postprandial) were measured by radioimmunoassay (Instar, Stillwater, MN, USA). Plasma lipoprotein measurements were obtained from fasting single fresh plasma samples using microplate methods (Behring ELISA Processor II Plus, Marburg, Germany). Total cholesterol and triglyceride concentrations were measured using an autochemical analyzer (Hitachi 747, Nakashi, Japan) and an enzymatic method (Roche Diagnostics, Basel, Switzerland). HDL cholesterol was assayed by the selective inhibition test (Daichii, Tokyo, Japan). LDL cholesterol was calculated according to the Friedewald formula. Fibrinogen in citrated plasma was measured using a modified clot-rate assay and a Diagnostica Stago STA instrument (Asnieres-Sur-Serine, France).8 This technique was based on the original method of Clauss.9 Insulin sensitivity was determined by the short insulin tolerance test (ITT).10,11
On the morning of the test day, a 20 G catheter equipped with a connector for blood sampling was inserted reversibly into one cephalic vein, and vessel blockage was prevented by a slow, constant infusion of saline solution. A second 20 G catheter was inserted for insulin and glucose infusion. After the second catheter was inserted, the subject was asked to lie at rest for 20-30 minutes. In order to obtain an arterialized vein, the temperature at the sampling site was maintained at 60-70℃ with a heating pad. With the subject at rest, 0.1 U per kg of body weight of a 100x diluted short-acting human insulin (Humulin-R, Eli Lilly, Indiana, IN, USA) was administered via the vein, and a blood sample was obtained from the opposite vein at 0, 3, 6, 9, 12, and 15 min. Each blood sample was immediately centrifuged and its glucose concentration determined. The insulin sensitivity index (ISI, %/min) was derived by linear regression from the rate of fall of the log glucose value between 3 and 15 min. The t1/2 was calculated when the baseline blood glucose level reached 50% of its initial value, and the ISI was calculated from the equation:
ISI=0.693/t1/2 × 100 (%/min)
Patients were classified into tertiles in accordance with ISI (0.39-4.70%/min).
We compared the clinical and biochemical characteristics of insulin-resistant (Tertile I, mean ISI=0.98 ± 0.31%/min) and insulin-sensitive subjects (Tertile III, mean ISI=3.50 ± 0.64%/min) by t-test or χ2 test (SAS Institute, Cary, NC). Multiple linear regression was performed to identify the factors affecting ISI (SAS Institute, Cary, NC). A p-value less than 0.05 was considered significant.
RESULTS
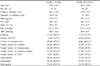
The ISI results ranged from 0.39 to 4.70%/min (mean ISI=2.14 ± 1.10%/min). According to the ISI, as measured in the short insulin tolerance test (ITT), subjects were classified into tertile I (0.39 < ISI < 1.54%/min; n=40), tertile II (1.54 < ISI < 2.55%/min; n=42), and tertile III (2.55 < ISI < 4.70%/min; n=40). The following conclusions were drawn by comparing the clinical characteristics of insulin-sensitive (tertile III) and insulin-resistant (tertile I) subjects. The insulin-resistant group was significantly older (57.3 ± 12.7 years vs. 50.0 ± 12.6 years, p < 0.05). They also had a higher prevalence of hypertension and family history of CVD (37.5% vs. 20.0% and 22.5% vs 7.5%, respectively, p < 0.05). There was no difference between tertile I and III in terms of BMI (22.6 ± 3.0 vs. 23.4 ± 3.4 kg/m2, p > 0.05), but WC (84.5 ± 5.3 vs. 82.1 ± 5.1 cm, p < 0.05) and body fat content (28.9 ± 4.3% vs. 27.0 ± 4.0%, p < 0.05) were significantly higher in the insulin-resistant group (tertile I) than in the insulin-sensitive group (tertile III). SBP was higher in tertile I than in tertile III (141.2 ± 22.4 vs. 131.0 ± 16.4 mmHg, p < 0.05), but no difference was found in DBP (88.1 ±12.6 vs. 86.0 ± 8.9 mmHg, p > 0.05). In addition, no differences were found between tertiles I and III in terms of sex, onset and duration of diabetes, smoking, CVD, family history of hypertension, diabetes, coronary disease or diabetic microvascular complications, i.e. nephropathy, neuropathy, and retinopathy (Table 1).
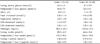
Insulin-resistant subjects had a higher fasting plasma glucose and HbA1c (10.5 ± 4.5 vs. 8.7 ± 3.9 mmol/L, p < 0.05; 9.8 ± 2.2% vs. 7.5 ± 1.8%, p < 0.05) than insulin-sensitive subjects. However, no statistically significant differences were found between tertiles I and III in terms of postprandial 2-hour blood glucose, fasting or postprandial insulin and C-peptide, total cholesterol, triglyceride, LDL-cholesterol, HDL-cholesterol, or fibrinogen levels (Table 2). There was no statistical difference in treatment modality between insulin-resistant and insulin-sensitive subjects. To evaluate the factors affecting ISI, multiple regression analysis was performed after adjusting for HbA1c. Since HbA1C and insulin resistance (ISI) were highly correlated (β=-0.39), they were not included in the same regression model. The results indicated that age, WC, SBP and body fat content were significant independent variables. The correlations between ISI and age (β=-0.21), WC (β=-0.23), SBP (β=-0.20), and body fat content (β=-0.20) were statistically significant (Table 3), which suggests that WC and body fat content provide a better measure of visceral adiposity than does BMI.
DISCUSSION
In this study, differences were found between the clinical manifestations of type 2 diabetic patients in accordance with their levels of insulin resistance. Such differences suggest that insulin resistance plays an important role in the development of clinical manifestations, and in the pathogenesis of the disease. A variety of approaches have been proposed to qualitatively and quantitatively describe insulin sensitivity;12,13 for example, fasting or postprandial insulin and C-peptide, the insulin tolerance test (ITT),14,15 the frequently sampled intravenous glucose tolerance test (FSIVGTT),16,17 and the euglycemic clamp test.18 Of these approaches, insulin concentration, especially fasting insulin concentration, although commonly used as a surrogate for insulin resistance,19,20 may not be an optimum choice as a surrogate for insulin resistance in type 2 diabetic patients. Insulin secretion decreases with increased hyperglycemia (g1ucotoxicity), and diabetic subjects have increased levels of proinsulin, which is recognized by some (but not all) insulin assays.21 Insulin is reported to have considerable cross-reactivity with proinsulin.19,20,22 While the euglycemic clamp test is widely regarded as the 'gold standard' for sensitivity measurement, it remains a laboratory procedure, because it requires sophisticated equipment, highly trained personnel, and is a lengthy procedure. Thus, there is a need for simpler alternative methods for measuring insulin sensitivity.17 Although there are limits to the validity of ITT,23,24 if it is performed while the blood glucose level is stable (subjects with a fasting glucose level < 7.8 mmol/L), then it is a valid measure of insulin resistance, as compared to the hyperinsulinemic-euglycemic clamp test.10,11,16,24
Insulin resistance is associated with increased age. Aging leads to a reduction in lean body mass, which contributes to insulin resistance; increasing fat mass also increases insulin resistance.7 Results from the current study support that aging and increasing body fat content are associated with insulin resistance.
In this study, insulin-resistant subjects did not have general adiposity, and BMI did not appear to be related to insulin resistance, but central adiposity and body fat content were significantly correlated with insulin resistance. WC and body fat content provided a better measure of visceral adiposity than did BMI. We evaluated visceral adiposity using WC or body fat content. It is a limitation of our study that visceral fat was not measured directly.
It has been reported that there is an adverse relationship between insulin sensitivity and hypertension.5,25 In this study, insulin resistance was not associated with diastolic blood pressure, but was associated with higher systolic blood pressure. Previous studies have reported that insulin resistance is associated with elevated triglycerides and lower HDL cholesterol levels in type 2 diabetic subjects.6,7,26 However, the present study shows no difference in lipid profiles. In general, during the process of atherosclerosis, which is partly involved in insulin resistance, the systolic blood pressure is more elevated than the diastolic blood pressure.27 Thus, if insulin-resistant subjects included in our study were in the preliminary stages of atherosclerosis, differences in diastolic blood pressure would not have been as evident as differences in systolic blood pressure. Similar reasoning could be applied to the lack of dyslipidemia differences between the two groups.
In addition, insulin resistance may influence not only the lipid levels but also lipid profile patterns, such as the HDL subfraction or the LDL size.28 Thus, there could be changes in the HDL subfraction or the LDL size, and no differences between the lipid levels of the two groups. The results of this study also imply that other factors, such as hypertension, dyslipidemia, or β-cell function, affect the clinical manifestations. These factors might influence the clinical course of diabetes. The present study has some shortcomings in terms of the evaluation of β-cell function, which is an important aspect of pathogenesis, and was evaluated by fasting or postprandial insulin and C-peptide. The variation between individuals and the dependency on blood glucose levels are limitations to the clinical use of fasting or postprandial insulin and C-peptide,29 and the results of this study showed that hypertension and a family history of cerebrovascular disease are more prevalent in insulin-resistant patients. After adjusting for HbA1c, the insulin resistance, as assessed by ISI, was strongly associated with age, WC, and body fat content. When type 2 diabetic patients demonstrated these clinical manifestations, they tended to be insulin resistant, and therefore insulin sensitizers, rather than insulin secretagogues, should be considered as elements of the treatment regimen.30,31 Based on the conclusions of the U.K. Prospective Diabetic Study (1998), the use of insulin sensitizers may prove beneficial, because this aspect of treatment is based on pathogenesis.32 In practice, this means that in terms of potential insulin-sensitizing agents, therapies based upon metformin or thiazolidinedione, are more likely to produce a better outcome in this insulin resistant group of patients than are sulfonylureas. Clinical trial studies should be conducted to investigate the merits of this approach, with an emphasis on clinical outcome.
In summary, we compared the clinical and biochemical characteristics of insulin-sensitive and insulin-resistant diabetic patients. Age, hypertension, central obesity, and poor glycemic control were identified as clinical parameters of insulin resistance in Korean type 2 diabetic patients.

 XML Download