

 PDF
PDF ePub
ePub Citation
 Print
Print


MR arthrography is recognized as a better diagnostic modality than conventional MR or CT arthrography for the assessment of the internal derangement of the joints because of the combination of the advantages of joint distension, high contrast resolution and multiplanar imaging (1-5). However, the use of MRI has some limitations. An MR examination is usually time-consuming and has relatively low spatial resolution so that very small or thin structures, such as cartilage are difficult to evaluate. In addition, some patients have contraindications to undergoing MR imaging due to the presence of an implanted medical device, claustrophobia or obesity, or the presence of surgical or nonsurgical ferrous metal in sensitive areas (6).
The advent of multi-detector CT with sub-millimeter spatial resolution has considerably increased the quality of current CT arthrography. This modality has been shown to be useful for the evaluation of cartilage or ligament lesions, and recurrent menisci or labral injuries after surgery as compared with the use of MR arthrography (7-10). Multi-detector CT is also used for patients with contraindications to MR imaging or MR arthrography (9). However, CT has lower tissue contrast than MRI, and thus is limited for the evaluation of bone marrow or soft tissue. In addition, there is a radiation hazard associated with CT as compared to MR imaging.
When performing direct MR arthrography, a small gauge needle is advanced into the joint under fluoroscopic guidance and a small amount of iodinated contrast material is then injected through the needle to confirm an intraarticular location. As iodinated contrast is also used for MR arthrography, it should be possible that direct MR arthrography and CT arthrography can be performed simultaneously. However, it is known that the use of an iodinated contrast agent can diminish the T1 shortening effect of gadolinium. Moreover, it has been reported that if a large amount of iodinated contrast agent is used for direct MR arthrography, it decreases signal intensity to a visually perceptible extent as seen on T1-weighted images, and degrades image quality due to low synovial fluid intensity as seen on T2-weighted images (3, 11, 12). Therefore, determination of the optimal ratio of gadolinium and iodinated contrast is important to preserve the density of iodinated contrast on CT and to minimize signal loss on MRI.
The purpose of this study was to determine the optimal gadolinium and iodinated contrast agent mixture ratio for simultaneous direct MR arthrography and CT arthrography using an in vitro approach.
MATERIALS AND METHODS
In Vitro Model
An in vitro study was performed using a mixture of 0.5 mol/L gadoterate meglumine (Dotarem; Guerbet Aulnay-Sous-Bois, Paris, France), 370 mg iodine/mL iodinated contrast agent (Ultravist 370; Schering, Berlin, Germany) and normal saline. Solutions with the following gadoterate meglumine concentrations were obtained: 0.625 mmol/L (1/800 dilution), 1.25 mmol/L (1/400 dilution), 2.50 mmol/L (1/200 dilution), 5.0 mmol/L (1/100 dilution), 10.00 mmol/L (1/50 dilution) and 20.00 mmol/L (1/25 dilution). The final iodinated contrast agent concentrations in the mixtures were as follows: 0, 12.5, 25, 37.5, 50, 75, 92-99.9 volume%. The solutions were placed in rectangular shaped tissue culture plates (6 × 7 array) (Multiwell; Falcon, Franklin Lakes, NJ) containing plastic wells of 4 mL volume and the plates (Ed-not the solutions) were sealed with plastic film, taking care not to entrap air.
CT Imaging
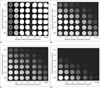
A phantom was set upright for the long axis of the plate wells to be parallel to that of the CT table at the center of the gantry. CT images were obtained in the axial plane using a 4-row multi-slice CT unit (MX 8000; Marconi Medical Systems, Cleveland, OH). The scan parameters used were as follows: tube voltage 120 kV, tube current 150 mAs, rotation time 1 sec/rotation, collimation beam 1.0 mm and pitch 0.875. The field of view (FOV) at acquisition was 220 mm. Image data were reconstructed within a 512 × 512 matrix at a slice thickness of 1.3 mm and a reconstruction increment of 0.6 mm with a D filter (for bone) (Fig. 1A).
MR Imaging
MRI was performed on a 1.5 Tesla system (Signa Horizon, Echospeed; GE Medical Systems, Milwaukee, WI) utilizing a head coil that is used clinically and thus has a fairly uniform spatial sensitivity near the coil center. The phantom was placed with the long axis of the plate wells to be perpendicular to that of the MRI table at the center of the head coil. The following sequences were acquired in the coronal plane. 1) Conventional spin echo T1-weighted sequences with TR/TE (msec) = 500/14, 3 mm slice thickness, 200 × 200 mm FOV, 512 × 512 pixel matrix (Fig. 1B). 2) Fast spin echo proton-density-weighted and T2-weighted sequences with TR/TE = 3000/14 and 3000/98, 3 mm slice thickness, 240 × 240 mm FOV, 256 × 256 pixel matrix (Fig. 1C, D).
Image Analysis
Digital data were forwarded to a picture archiving and communication systems (PACS) server (Radmax; MaroTech, Seoul) and were distributed to workstations. All images were downloaded onto a local hard drive of a display workstation prior to interpretation. A 21-inch liquid crystal display monitor (ME315L; Totoku, Nagaoka, Japan) with a resolution of 2,048 × 1,536 × 8 pixels was used. A region of interest (ROI) measuring tool (ROI diameter, 10 mm) as part of the workstation was placed in the center of the plate wells and CT numbers and ROI values of signal intensity were measured five times per plate. Maximum and minimum measurements were eliminated and the averages of the remaining three values were then calculated. Graphs were generated by plotting CT numbers or ROI values of signal intensity versus the gadolinium concentration at seven different iodinated contrast agent mixture volume percentages. Scatter diagrams were plotted for all gadolinium/iodinated contrast agent combinations and two radiologists in consensus identified the mixtures that yielded the optimal CT numbers and MR signal intensities.
Statistical Analysis
Pearson's correlation coefficients were used to assess the correlations between gadolinium/iodinated contrast agent and the CT numbers/MR signal intensities. The Kruskal-Wallis test was used to determine if the CT numbers of the seven different concentrations of the iodinated contrast mixtures were significantly different. Statistical analysis was performed using SPSS for windows (version 12.0; SPSS, Chicago, IL). P values of less than 0.05 were considered as statistically significant.
RESULTS
CT Numbers
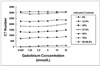
There was a strong positive linear correlation between the CT number and iodinated contrast agent concentration (r = 0.976, p < 0.001) (Fig. 2). There was a statistically significant difference in the CT number among the seven different concentrations of iodinated contrast agent mixtures (p < 0.001). A positive linear correlation was found between the CT number and gadolinium concentration (r = 0.041), but the finding was not statistically significant (Table 1).
MR Signal Intensities
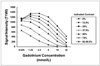
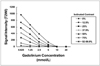
Iodinated contrast agent mixtures containing iodine at concentrations of 37.5% or less showed peak signal intensity as seen on T1-weighted images at a gadolinium concentration of 1.25 mmol/L. With a greater concentration of gadolinium, the signal intensity showed a gradual decrease with increasing gadolinium concentration. In the remaining iodinated contrast agent mixtures, the signal intensities gradually decreased with increasing gadolinium concentrations (Fig. 3). The increase in the concentration of iodinated contrast agent at a constant gadolinium concentration led to a decrease in MR signal intensity. As seen on proton-density-weighted sequences (Fig. 4) and T2-weighted sequences (Fig. 5), the signal intensities decreased as the gadolinium and iodinated contrast concentrations increased; this effect was more apparent as seen on T2-weighted images. As seen on T1-weighted, proton-density-weighted and T2-weighted images, negative linear correlations were found between signal intensity and the gadolinium concentration (r = -0.719, p < 0.001; r = -0.719, p < 0.001; r = -0.489, p = 0.001, respectively, for T1-weighted, proton-density-weighted and T2-weighted sequences). Negative linear correlations were also found between signal intensity and the iodinated contrast agent concentration (r = -0.608, p < 0.001; r = -0.619, p < 0.001; r = -0.484, p = 0.001, respectively, for T1-weighted, proton-density-weighted and T2-weighted sequences) (Table 1).
Determination of the Optimal Concentration of Contrast Agent
When variations were compared on scatter diagrams of all gadolinium and iodinated contrast agent combinations, the proportions of 0.625 to 1.25 mmol/L of gadolinium and 0 to 37.5% of iodinated contrast were satisfactory in terms of MR signal intensity. Among these combinations, the use of a mixture comprised of 1.25 mmol/ L gadolinium and 25% iodinated contrast agent represented an acceptable compromise of the MR signal intensity and the CT number. For this mixture, the CT number was 1,298.94 Hounsfield units (HU) and the ROI values of the peak signal intensity were 1,233.39 as determined on T1-weighted images, 1,122.64 as determined on proton-density-weighted images and 371.48 as determined on T2-weighted images.
DISCUSSION
Based on the results of the present study, if direct MR arthrography and CT arthrography are performed simultaneously, we recommend the use of a mixture of 1.25 mmol/L gadolinium and 25% iodinated contrast agent as the most appropriate combination for imaging. This compromise is acceptable not only for MR arthrography, but also for CT arthrography, as a density of 1,200 HU provides sufficient contrast (13).
Engel (14) proposed that a gadolinium concentration of 2.0 mmol/L in normal saline is an optimal concentration for direct MR arthrography as a large effusion excessively dilutes the 1 mmol/L gadolinium solutions and thus diminishes contrast. Masi et al. (12) proposed that concentrations of 1.25-2 mmol/L were recommended especially for T1-weighted sequences, and administration of an iodinated contrast agent should be minimized during MR arthrography due to a decline in signal intensity. Results of the present study corroborate the results of earlier studies where iodinated contrast material might not only compromise for the increase in signal intensity derived from gadolinium but might also cause a decrease in signal intensity for all pulse sequences. Montgomery et al. (3) considered that this effect could be related to an increase in viscosity or to a reduction in the proton density of the mixture, whereas Masi et al. (12) proposed that the decline in signal intensity is most likely due to the magnetic susceptibility of iodine. In addition, signal intensity loss and image distortion were more prominent as seen on proton-density-weighted and T2-weighted sequences in the present study (Figs. 1C, D, 4). We believe that the susceptibility effect is stronger for those sequences.
Our study differs from earlier studies as we have evaluated the effect of different dilutions of the iodinated contrast agent. In our study, peak signal intensities as seen on T1-weighted sequences were encountered with a gadolinium concentration of 1.25 mmol/L and iodinated contrast concentrations of 37.5% or less, and with gadolinium concentrations of 0.625 mmol/L and iodinated contrast concentrations of more than 37.5%. Montgomery et al. (3) demonstrated that dilution of gadolinium in 41% iodinated contrast shifted peak signal intensity curve to the left compared with dilution of gadolinium in normal saline, and that highest signal intensity occurred at a gadolinium concentration of 0.625 mmol/L, whereas peak signals were obtained at a gadolinium concentration of 2.5 mmol/L with dilution in normal saline. Our results support the suggestion made by Montgomery and colleagues (3) that when gadolinium and iodinated contrast agent are used at the same time, the concentration of gadolinium should be less than the usual value of 2 mmol/L in order not to lose signal intensity. We believe that this composition will also improve signal intensities as seen on T2-weighted sequences.
In the present study, test solutions at iodinated contrast concentrations of 37.5% or less produced higher signal intensity than solutions mixed with saline only at a gadolinium concentration of 0.625 mmol/L, as seen on T1-weighted sequences (Fig. 3). Jinkins et al. (15) found that iodinated contrast agents themselves have a weak T1 shortening effect that results in higher signal intensity than water as seen on T1-weighted sequences. Our findings demonstrated that a low iodinated contrast concentration of 37.5% or less does not have a negative effect on the T1 shortening effect of the use of a low gadolinium concentration of 0.625 mmol/L, but rather there is a positive or synergistic effect, although the mechanism is unclear.
The present in vitro study showed significantly higher CT numbers with the use of iodinated contrast concentrations of 75% or more regardless of the gadolinium concentration (Fig. 2). We observed marked gross attenuation decreases in mixtures containing iodinated contrast agent at a concentration of 12.5% as seen on CT, and we did not observe any visually perceptible difference between the CT attenuations of mixtures containing iodinated contrast agent at concentrations of more than 37.5% (Fig. 1A). To the best of our knowledge, no report has been previously addressed the optimal concentration of iodinated contrast agent to use when performing direct CT arthrography, and 100% undiluted contrast is generally used. Our results support that this concentration could be reduced to 37.5% without detrimentally affecting image contrast effects. Moreover, the use of lower concentrations of iodinated contrast may result in lower contrast viscosities that would enhance the delineations of small intraarticular structural irregularities.
This study has limitations primarily because of its in vitro design. We are unable to comment on the mechanisms underlying the interaction between the gadolinium-based agent and the iodinated contrast agent. An in vivo correlation is warranted to evaluate the further dilution of the injected concentration due to synovial fluid or large joint effusions.
In conclusion, the present study shows that a mixture of 1.25 mmol/L gadolinium and 25% iodinated contrast agent is optimal for simultaneous MR and CT arthrography in vitro. In addition, we recommend that to decrease the signal loss of additive iodine, an iodinated contrast agent concentration of more than 37.5% should not be used for simultaneous MR and CT arthrography.


 XML Download