

 PDF
PDF ePub
ePub Citation
 Print
Print


With the recent development of tissue-specific MR contrast agents such as superparamagnetic iron oxide (SPIO) and gadobenate dimeglumine, it is widely agreed that contrast-enhanced liver MR is the most accurate non-invasive imaging modality for the evaluation of liver malignancies, including hepatocellular carcinoma (HCC) and metastases (1-3). The combined use of gadolinium and SPIO is recommended to increase accuracy in the detection and characterization of focal liver lesions and is considered the most accurate non-invasive imaging modality for the evaluation of liver tumors (4, 5).
Superparamagnetic iron oxide-enhanced MR imaging has received attention as a non-invasive examination to replace CT arterial portography for the detection of liver malignancies (3, 6). Extensive studies have been conducted to determine the optimal pulse sequence for SPIO-enhanced MRI. Although debate still exists, T2*-weighted gradient recalled-echo (T2*W-GRE) and T2-weighted turbo-spin echo (T2W-TSE) sequences have been most widely used as optimized sequences in SPIO-enhanced MRI for the detection of focal liver lesions (7-10). However, in spite of the variety of pulse sequences now available for SPIO-enhanced liver MRI in clinical practice, there is no published data concerning the question of whether T2*W-GRE or T2W-TSE sequences alone in SPIO-enhanced MRI are sufficient for the detection of liver malignancies, or if the sequences should be combined to provide better detection. Considering the acquisition of multiple MR sequences can be time-consuming and can result in greater inconvenience to patients (particularly when double contrast MRI is considered), acquisition of objective data regarding the use of combined sequences in SPIO-enhanced MRI is reasonable. Therefore, this study was conducted to determine if combining SPIO-enhanced T2*W-GRE and T2W-TSE sequences in sequentially acquired gadolinium-enhanced and SPIO-enhanced MRI has additive value compared to each sequence alone, for the detection of small liver malignancies, including HCCs and metastases. Additionally, we wanted to analyze the relative efficacy of each MR sequence and both sequences combined, with regard to HCCs in patients with underlying chronic liver disease and liver metastases in patients with no underlying liver disease. This study was conducted in a large series of patients.
MATERIALS AND METHODS
Patients
We retrospectively reviewed our institutional database for liver MRIs conducted between January 2004 and September 2006 on patients suspected of having liver malignancy based on clinical and prior CT findings. We identified 391 patients with HCCs and 55 patients with liver metastases who underwent a double contrast MRI that consisted of a sequentially acquired gadolinium-enhanced and ferucarbotran-enhanced liver MRI. No institutional review board approval was required for retrospective review of medical records and images.
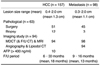
Of the 446 potential study patients, only those who met the following criteria were included in the study: (a) nodular HCC 2 cm or smaller in size that had been proven on histology or showed typical imaging findings on hepatic angiography, Lipiodol CT, and dynamic CT, (b) liver metastases 2 cm or smaller in size that had been proven on histology or showed typical imaging findings on three-phase dynamic CT and follow-up CT or MRI (rapid progression of disease), (c) follow-up contrast-enhanced CT or MRI performed for at least six months (range: 6-30 months). Consequently, the study population included 151 patients (114 men and 37 women; age range: 40-74 years): 119 patients with 157 HCCs and 32 patients with 98 metastases. The lesion distribution according to the confirmative diagnostic method is given in Table 1. Of 51 HCCs (from 38 patients) that were confirmed by pathologic analysis of surgical specimens, 45 lesions were grade I (n = 15) or II (n = 30) according to Edmondson's classification of HCC (11), and the remaining six were grade III. For the 81 patients with 106 HCCs who underwent transarterial chemoembolization, the final diagnosis was based on a combined interpretation of findings from all diagnostic procedures by two experienced radiologists in consensus. Diagnostic procedures included the following: image-guided biopsy (n = 12), characteristic imaging findings on three-phase multidetector CT (MDCT) and MRI (arterial hypervascularization and early washout on dynamic imaging and arterial hypervascularization plus hyperintensity on SPIO-enhanced MRI) (n = 106), and persistent dense compact nodular Lipiodol uptake of the detected lesions on MDCT and MRI after TACE (n = 106) (12), as well as aggravation (local recurrence or new growing HCCs) on follow-up CT or MRI (n = 19). Of all the patients with HCCs, four underwent ablation therapy, and two underwent chemoembolization before MRI. All patients with HCCs had liver cirrhosis (n = 116) or chronic hepatitis (n = 3) associated with viral hepatitis B. Seven of them also had viral hepatitis C. During the inclusion period for this retrospective study, there was no patient with small HCC (≤ 2.0 cm) who was without underlying liver parenchymal disease. The diagnosis of chronic hepatitis or cirrhosis was made by means of histology in 50 patients and by a combination of clinical course, blood chemistry tests (aspartate aminotransferase, alanine aminotransferase, alkaline phosphatase, bilirubin, albumin, and globulin), and typical CT and MRI findings in the remaining 69 patients. Based on the Child-Pugh classification, 98 patients were classified as Child class A, and the remaining 18 patients were classified as class B. Liver metastases arose from the following primary tumors: colorectal carcinoma (n = 25), gastric carcinoma (n = 5), and pancreatic carcinoma (n = 2). No patients with liver metastases had cirrhosis, and all had normal hepatic function test results, including prothrombin time and blood chemistry (serum albumin, total bilirubin level, and choline esterase).
MR Examination
All MRI examinations were performed using a 1.5 T unit (Magnetom Symphony; Siemens, Enlargen, Germany) with a combination of a phased array body coil for signal reception. Baseline MR images included a respiratory-triggered T2W-TSE sequence and a breath-hold T2*W-GRE sequence. Respiratory-triggered T2W-TSE imaging was obtained using the following parameters: TR/TE of 3300-4200/76, echo train length of 13, 150° flip angle, matrix of 202 × 384, signal averages of two, and average scan time 3 minutes. Breath-hold T2*W-GRE imaging was obtained using the following parameters: TR/TE of 180/12, 30° flip angle, matrix of 144 × 256, signal average of one, two sequential acquisitions, 20 slices, and average scan time 35 seconds (two stacks with 10 slices each in a 15-17-second breath-hold). A relatively long TE (12 ms) and lower flip angle (30°) were used for increasing the sensitivity to the field inhomogeneity induced by SPIO administration and for decreasing the T1 contrast, respectively (7, 13). For all sequences, a 6-7 mm slice thickness was used with a 10% intersection gap and a field of view of 35-40 cm, depending on the size of the liver.
In the first session, dynamic MRIs (volumetric interpolated breath-hold examination, VIBE: Siemens, Erlangen, Germany) with mSENSE were performed using the following parameters: TR/TE of 4.3/2.0, flip angle of 12°, bandwidth of 450 Hz/Px, matrix of 256 (read)×135 (phase)×40-46 (partition), effective slice thickness of 3.5-4 mm, and field of view of 32-35 cm. The determination of scan delay for the image acquisition timing was achieved using the test bolus technique, in which 1 mL of contrast media was injected, followed by a 20 mL saline flush, and the vessel of interest (the abdominal aorta) was then scanned approximately once per second. The mean delay time to peak aortic enhancement was 21 seconds (range: 17.0-23.0 sec). Thus, for a sequential mode of k-space acquisition (center lines of k-space are acquired during the middle of the acquisition time), the mean delay times (time interval between bolus administration and the start of image acquisition) for the early arterial, late arterial, portal, and equilibrium phase were 20, 30, 60, and 180 seconds, respectively. The acquisition time for each phase was 10-11 seconds. Gadopentetate dimeglumine (Magnevist®, Bayer HealthCare) was injected at a dosage of 0.1 mmol/kg body weight at a rate of 2 mL/sec. The contrast was injected into the antecubital vein using an automated injector (Spectris MR; Medrad Europe, Maastricht, The Netherlands), and a 20 mL saline flush followed the contrast injection.
In the second session, ferucarbotran (SHU-555-A; Resovist®, Bayer HealthCare)-enhanced imaging was performed immediately after completion of the dynamic MR examination. Ferucarbotran-enhanced imaging was comprised of the respiratory-triggered T2-weighted TSE sequence and the breath-hold T2*-weighted GRE sequence for the baseline MRI. Patients up to 60 kg body weight received 0.9 mL of ferucarbotran, and patients above 60 kg body weight received 1.4 mL of ferucarbotran (8-12 µmol of iron per kilogram of body weight). Ferucarbotran was rapidly injected intravenously through a 5 µm filter and was followed by a 20 mL saline flush; imaging then commenced approximately 10 minutes after the intravenous injection of contrast agent.
Imaging Analysis
Two gastrointestinal radiologists (one on-site reviewer and one off-site reviewer), who had at least six years experience interpreting liver imaging in their daily clinical practice, reviewed the images independently and separately. All images were reviewed on a 2000×2000 Picture Archiving and Communication Systems (PACS; Marotech, Seoul, Korea) monitor. The radiologists were aware of the overall goal of the study before the reading session, and they knew that the patients were at risk for HCC or metastasis, but were unaware of the presence or location of any liver lesions or of the results of other imaging studies. They independently reviewed three sets of MR images in two reading sessions: (a) unenhanced T1- and T2-weighted imaging, gadolinium-enhanced dynamic imaging, and ferucarbotran-enhanced T2*W-GRE imaging (the T2*W-GRE set), (b) unenhanced T1- and T2-weighted imaging, gadolinium-enhanced dynamic imaging, and ferucarbotran-enhanced T2W-TSE imaging (the T2W-TSE set), and (c) a combination of the T2*W-GRE set and T2W-TSE set (the combined set). In the first session, either the T2*W-GRE set or the T2W-TSE set was randomly presented with no specific patient order. In the second session, the remaining T2*W-GRE set or T2W-TSE set was randomly presented, and the T2*W-GRE or T2W-TSE reviewed in the first reading recession was added for a combined review. To minimize any learning bias, there was at least a two-week interval between the two reading sessions.
The criteria for diagnosing HCC or metastasis on the ferucarbotran-enhanced MRI were defined as a focal, discrete, nodular high signal intensity area relative to adjacent liver parenchyma (lower than the signal intensity of CSF or gallbladder on a T2W-TSE sequence to exclude the cyst) on both T2*W-GRE and T2W-TSE images. On gadolinium-enhanced MRI, early enhancement with rapid washout (typical of HCC) and irregular peripheral enhancement with a peripheral washout on delayed phase images (typical of metastases) were used as the criteria for diagnosing malignancy. For each eligible lesion, one of four confidence levels was assigned to each decision as follows: "1" as 'probably not present'; "2" as 'possibly present'; "3" as 'probably present'; and "4" as 'definitely present'. Lesions that showed only arterial hypervascularization were regarded as category 2 if they showed no delayed capsular enhancement, mosaic pattern, or moderate hyperintensity on T2-weighted imaging (category 3). During gadolinium-enhanced MRI, 115 of the total 157 HCCs showed early enhancement with rapid washout, and the remaining 42 appeared as hyperintense nodules during arterial phase imaging and were occult during portal and equilibrium phase imaging. To achieve an accurate correlation between the findings of the scored lesions and the findings of the reference standard, each observer made markings over all lesions with arrows on the PACS monitor. After the two observers conducted the two review sessions, the study coordinator, who was not involved in image interpretation, compared the scoring results of each of the observers to a gold standard, and then a possible explanation was formulated for any false-positive or false-negative findings.
Statistical Analysis
Based on the reviews submitted by the two observers, an alternative-free response receiver operating characteristic (ROC) curve analysis was performed on a lesion-by-lesion basis (14). For each imaging set (T2*W-GRE images, T2W-TSE images, and combined), an alternative-free response ROC curve was fitted to each observer's confidence rating data using a maximum likelihood estimation program (ROCKIT 0.9B; courtesy of Metz CE, University of Chicago, IL, 1998) (15). The area under the alternative-free response ROC curve (Az) was calculated to determine the diagnostic accuracy of each image, each observer, and lesion type. The differences between the imaging sets with regard to the area under the alternative-free response ROC curves were compared using a two-tailed Student's t test for paired data. The sensitivities for each image and for each observer, as well as according to the lesion type, were then calculated. The sensitivity was defined as the number of true positive diagnoses, using a confidence level of 3 or 4. The sensitivities and positive predictive values for each image set were then compared using the McNemar test. A two-tailed p value of less than 0.05 was considered statistically significantly. We also calculated the 95% confidence interval (CI) to determine a range of plausible sensitivity differences.
In order to assess interobserver agreement for evaluating the two images and the combined approach, we calculated the kappa statistic for multiple observers (16). Kappa values of less than 0.20 indicated positive, but poor, agreement, those from 0.21-0.40 indicated fair agreement, those from 0.41-0.60 indicated moderate agreement, those from 0.61-0.80 indicated good agreement, and those greater than 0.81 indicated excellent agreement.
RESULTS
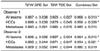
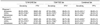
For all 255 lesions, including the 157 HCCs and 98 metastases, there was a trend toward increased diagnostic accuracy (Az values) for the combined set (mean, 0.966) when compared with each set alone (mean, 0.892 for T2*W-GRE set; 0.910 for T2W-TSE set), to a statistically significant degree (p = 0.004 [observer 1], 0.003 [observer 2] for the T2*W-GRE set; p = 0.033 [observer 1], 0.025 [observer 2] for the T2W-TSE set) (Table 2). Furthermore, considering the sensitivity for all lesions, the combined set (mean, 94.7%) was significantly more sensitive than each set alone (mean, 86.1% for T2*W-GRE set; 87.7% for T2W-TSE set, p = 0.0001) (Table 3).
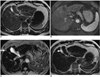
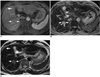
For detection of HCCs, the Az value of the combined set was significantly higher than that of each set alone, for both observers (p = 0.016 [observer 1], 0.013 [observer 2] for the T2*W-GRE set; p = 0.042 for the T2W-TSE set) (Table 2). Although the Az values of the T2*W-GRE set were slightly better than those of the T2W-TSE set for both observers (Fig. 1), no significant difference was noted for either observer (p = 0.635 for observer 1; p = 0.801 for observer 2). Among the 157 HCCs, the T2W-TSE set allowed for the depiction of 127 lesions (sensitivity, 80.9%; 95% CI: 73.9%, 86.7%) by observer 1 and 129 lesions (sensitivity, 82.2%; 95% CI: 75.35%, 87.8%) by observer 2; the T2*W-GRE set allowed the depiction of 135 lesions (sensitivity, 86.0%; 95% CI: 79.6%, 91.0%) by observer 1 and 137 lesions (sensitivity, 87.3%; 95% CI: 81.0%, 92.0%) by observer 2. There was a significant difference in sensitivities between the two image sets for both observers (p = 0.01). The combined approach allowed for the depiction of 145 lesions (sensitivity, 92.4%; 95% CI: 87.05%, 96.0%) by observer 1 and 147 lesions (sensitivity, 93.6%; 95% CI: 88.6%, 96.9%) by observer 2 (mean, 93.0%), which was significantly better than the values obtained using each set alone (mean, 81.6% for T2W-TSE set, 86.7% for T2*W-GRE set) (p = 0.0001 for T2W-TSE set, p = 0.002 for T2*W-GRE set). There were nine and eight HCCs (size range: 0.6-1.2 cm, mean size: 0.9 cm) for each observer, respectively, which were not detected on the T2*W-GRE set, but which were detected on the T2W-TSE set (Fig. 2). There were 17 HCCs (size range: 0.6-1.9 cm, mean size: 1.2 cm) for both observers that were not detected on the T2W-TSE set, but which were detected on the T2*W-GRE set. Of the 51 HCCs with surgical confirmation, four well-differentiated HCCs were not detected by either observer on the T2W-TSE set, but were detected on the T2*W-GRE set by both observers. For the remaining lesions, the two image sets showed similar results.
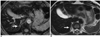
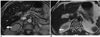
For the detection of liver metastases, the Az values of the combined set and the T2W-TSE set were better than those of the T2*W-GRE set for both observers, although the difference was not statistically significant (p = 0.134 for observer 1; p = 0.162, 0.772 for observer 2). The sensitivity of the combined set was the same as that of the T2W-TSE set (98.0%; 95% CI: 92.8%, 99.7%, for observer 1; 96.9%; 95% CI: 91.3%, 99.3%, for observer 2; mean 97.5%), which was significantly better than that of the T2*W-GRE set for both observers (84.7%; 95% CI: 76.0%, 91.2%, for observer 1; 85.7%; 95% CI: 77.2%, 92.0%, for observer 2; mean 85.2%) (p = 0.0001) (Fig. 3). There were 11 metastases (0.4-0.8 cm) that were not detected by either observer on the T2*W-GRE set, but which were clearly revealed on the T2W-TSE set (Fig. 4). However, there was no lesion detected on the T2*W-GRE set that could not be verified on the T2W-TSE set.
Each image set showed a similar positive predictive value for each observer (Table 3). Both observers had six false-positive findings on the T2*W-GRE set, four false-positive findings on the T2W-TSE set, and two false-positive findings on the combined set. All false-positive findings were attributed to the end-on of vessels or fibrosis in the case of cirrhotic patients. The kappa values for the two observers were 0.746 for the T2*W-GRE set, 0.762 for the T2W-TSE set, and 0.685 for the combined set, indicating good inter-observer agreement with regard to the presence of lesions.
DISCUSSION
T2*W-GRE and T2W-TSE are techniques mainly used with SPIO-enhancement (7-10). T2*W-GRE in SPIO enhancement provides the highest lesion to liver contrast because of its strong magnetic susceptibility resulting from local field inhomogeneity (7, 8), but it suffers from low signal-to-noise ratio (SNR) and has poor pre-contrast image quality. Furthermore, T2*W-GRE might be limited in advanced cirrhotic livers because the decrease in signal intensity of cirrhotic livers on T2*W-GRE sequences is less pronounced than on T2W-TSE sequences (17). Meanwhile, the respiratory-triggered T2W-TSE sequence offers higher spatial resolution because of its large image matrices, less blooming effect because of the robustness of the T2* effect, and preferable T2-weighted image contrast; small rounded areas of hyperintensity caused by hepatic cysts or hepatic vessels are efficiently differentiated from small malignant tumors (18). However, TSE is less sensitive to SPIO, probably because of increased magnetization transfer saturation and decreased susceptibility effects due to the use of multiple 180° refocusing pulses (19). Furthermore, image degradation from motion artifact could be severe on TSE. In the present study, we hypothesized that combining SPIO-enhanced T2*W-GRE and T2W-TSE sequences had additive value compared to each sequence alone for the detection of small liver malignancies, including HCCs and metastases, due to these theoretical relative advantages and disadvantages of T2*W-GRE and T2W-TSE sequences.
Our study showed that there was a trend toward increased Az values for the combined approach compared to each image set alone. Regarding the sensitivities for the detection of HCCs, the combined approach was significantly better than each image set alone (p < 0.05), and the T2*W-GRE set was better than the T2W-TSE set for both observers (p < 0.05). The higher detectability of T2*W-GRE for HCC could be explained by its higher inherent lesion to liver contrast and possible inclusion of well differentiated HCCs in study cases; most lesions included in this study were 2 cm or smaller (17, 20). Tanimoto et al. (17, 20) showed that relative post-SPIO-enhanced SNR changes in the liver parenchyma between cirrhotic and non-cirrhotic patients were remarkable on the T2*W-GRE sequence, but not on the T2W-TSE sequence. They claimed that small intracellular SPIO clusters caused by decreased Kupffer cell function in cirrhosis caused little SNR drop in the liver parenchyma on the T2*W-GRE sequence compared to the T2W-TSE sequence, because SNR loss on the magnetic susceptibility-insensitive T2W-TSE sequence is related to the greater free water interaction made possible by the relatively larger surface area of the small SPIO clusters (20). However, given that Kupffer cells density in well-differentiated HCCs would be maintained, but Kupffer cells function would be reduced compared to the surrounding liver, small intracellular SPIO clusters in well-differentiated HCCs also produce little SNR decrease on the T2*W-GRE sequence, which could result in better lesion conspicuity than on the T2W-TSE sequence (21). Of the 51 HCCs in our study with surgical confirmation, four lesions were not detected by either observer on the T2W-TSE set, but were detected on the T2*W-GRE set by both observers. All four lesions proved to be well-differentiated HCCs.
With regard to the detection of metastases that do not contain Kupffer cells, the sensitivity of the combined approach was the same as that of the T2W-TSE set, which was significantly better than that of the T2*W-GRE set for both observers. Despite the higher inherent lesion to liver contrast on the T2*W-GRE, the better detection capability of the T2W-TSE for metastases could be explained by signal loss caused by a magnetization transfer effect, with the TSE sequence being lower in metastases than in HCC because tumor necrosis and abundant interstitial space in metastases generally contain more abundant free water compared with HCC (22, 23). There were 11 metastases (0.4-0.8 cm) that were not detected by either observer on the T2*W-GRE set, but which were clearly revealed on the T2W-TSE set. When we retrospectively reviewed these lesions on the T2*W-GRE image, all were depicted as tiny high signal intensities with irregular margins, and some small lesions were abutted on intrahepatic venous structures. These lesions were difficult to differentiate from the end-on of the vessel because vessels are depicted with bright hyperintensity, as is true malignancy on the T2*W-GRE image (8, 10). We assumed that this was also attributable to an exaggerated T2*-shortening effect on the T2*W-GRE sequence, which has a relatively long TE (12 ms), that may have partially obscured the margins of the smaller liver lesions, especially those located at the dome abutting the lung or the left hepatic lobe abutting the gastric lumen (13). Moreover, the relatively lower spatial resolution of the T2*W-GRE sequence (144 × 256) compared to the T2W-TSE sequence (202 × 384) and the inherent blurring of high signal intensity structures on the T2*W-GRE sequence may also be behind this phenomenon. In addition to the shortcomings of the T2*W-GRE sequence in advanced cirrhotic livers, these could also explain the nine and eight HCCs detected only on the T2W-TSE set, but not on the T2*W-GRE set, by observers 1 and 2, respectively.
There are several limitations to our study. First, not all lesions were surgically confirmed, which could have resulted in overestimation of the sensitivity of each image by reducing false-negative lesions. However, our study was not intended to determine the absolute diagnostic accuracy and sensitivity of the MR sequence, but to determine the relative diagnostic efficacy of combined MR sequences compared to single sequences for the detection of liver malignancy. Furthermore, the relatively thick slice thickness (0.6 or 0.7 cm) of ferucarbotran-enhanced MR sequences is inherently limiting in the detection of small hepatic tumors. A second limitation is that a quantitative analysis to determine the conspicuity of HCC according to the histologic differentiation or the number of Kupffer cells was not made. In addition, quantitative analysis was not done regarding the tumor-to-liver contrast. However, optimal contrast-to-noise ratio does not necessarily translate into better detecting capability (24). In this regard, the 12 ms TE for the T2*W-GRE sequence used in our protocol might be slightly long to obscure the margin of small hyperintense nodules (13). HCCs only detected on the T2W-TSE set (mean size, 0.9 cm) tended to be smaller than those only detected on the T2*W-GRE set (mean size, 1.2 cm). Additionally, since the image quality of the liver was higher with the respiratory-triggered TSE sequence owing to its large image matrices, exact direct comparison between the two sequences in this study could not be made. In our study, the diagnostic accuracy of the combined set for metastases was slightly better than that for each image set for observer 2. Although diagnostic confidence is a subjective parameter that cannot be directly translated into diagnostic performance, such as sensitivity, an increase in physician confidence might contribute significantly to patient management. Therefore, considering the higher inherent lesion to liver contrast of T2*W-GRE in SPIO enhancement, we believe that the T2*W-GRE sequence has the potential to provide an additional role for T2W-TSE in the detection of metastases. Third, the results of this study do not necessarily reflect the pure diagnostic capabilities of SPIO-enhanced images for the detection of HCC, because we included an analysis of all sequences combined. Lastly, differences in the MR imager, MR parameters, and methods for image review used may result in different results. Therefore, the results of this study might not be able to be extrapolated to other facilities with different MR imagers or sequences. Additionally, we did not evaluate other commercially used sequences for SPIO-enhanced MRI in this study (19).
In conclusion, a combination of ferucarbotran-enhanced T2*W-GRE and T2W-TSE images in combining gadolinium and ferucarbotran-enhanced MRI had better diagnostic capability compared to each sequence alone for the detection of HCC in cirrhotic patients. No difference in sensitivity for the detection of metastases was noted between the T2W-TSE set and the combined T2*W-GRE/T2W-TSE set, suggesting that the respiratory triggered T2W-TSE sequence in ferucarbotran-enhanced MRI is preferred for the detection of small liver metastases in non-cirrhotic patients.
 XML Download