

 PDF
PDF ePub
ePub Citation
 Print
Print


Prostate cancer has ubiquitously become the second most common cause of cancer-related deaths in men and poses a growing health problem (1). Since the 1980s the rate of prostate cancer has increased in significance every year in China. In Shanghai, the mean annual rate of increase has been over 6.2% (2). Hence, a method is needed to aid in distinguishing patients who have a clinically indolent prostate cancer (3). The current modalities for evaluation and diagnosis of prostate cancer include transrectal ultrasound, digital rectal examination (DRE), prostate specific antigen (PSA), random biopsies of the prostate, and magnetic resonance imaging (MRI) with an endorectal coil. However, their diagnostic capabilities have not been satisfactory (4). MR spectroscopy (MRS) has been a relatively new modality in the diagnosis of prostate cancer since the 1980s. The MRS has the ability to discriminate prostate cancer from the normal peripheral zone based on a reduced citrate and elevated choline in the cancerous region. The value of citrate as a tissue marker for differentiation of BPH (benign prostatic hyperplasia) from cancer prostate has been demonstrated in animal models, cell lines, and tissue extracts (5, 6). However, there is no systemic assessment on its value when used in a clinical setting. Evidence-based medicine is an important concept that has been proven to be a popular and useful method for identifying and evaluating evidence in producing the guidelines for medical practice. Here, we provide a meta-analysis for the review of the published literature for two aims: 1) to assess the accuracy of the prostate cancer with the the ratio of (choline + creatine) / citrate detected by MRS and, 2) to compare the value of two clinical dignostic criteria: cut-off values 0.75 and 0.86.
MATERIALS AND METHODS
Inclusion and Exclusion Criteria
The inclusion and exclusion criteria were established based on the standards of diagnostic research published by the Cochrane methods group for screening and diagnostic testing (http://www.Cochrane.org/docs/sadtdocl.htm).
Type of Research
This systematic review includes only prospective observational studies in which the results of the diagnostic test of interest were compared with that of a reference standard - histological biopsy, radical prostatectomy, or surgery.
All case reports, letters, reviews, and common reviews were excluded.
Objective of Original Random Control Test
The objective of this study is to evaluate the value of MRS in diagnosing prostate cancer. A positive study for a malignant prostate mass was defined by Kurhanewicz et al. (6). All scans were read by radiology medicine doctors which were "blinded" to the patients' history, clinical presentation, and physical examination. The studies which were "blindly read" were not mentioned to be in the exclusion criteria. Moreover, the subjects had not previously undergone hormone or radiotherapy before they underwent an MRI and MRS. The studies without information on the specificity or sensitivity were excluded.
Search Strategy
The relevant publications were identified in the database by querying the Medline (http://www.ncbi.nlm.nih.gov/entrez/query.fcgi?), Elsevier, Springer, OVID, CNKI (China National Knowledge Infrastructure), and Embase databases by computer from 1994 to 2006. Next, a manual research of the reference lists cited in the original articles of the relevant journals had also been done. All medical subject headings with diagnosis were combined with words: (carcinoma of prostate OR prostate cancer OR prostate carcinoma OR prostate tumor) AND diagnosis AND (MRS OR MR spectroscopic imaging OR magnetic resonance spectroscopic imaging OR MR spectroscopy OR magnetic resonance spectroscopy) AND sensitivity AND specificity. The publication languages were restricted to English and Chinese and the research subjects were human. There was no limitation set on the reporting date. All articles were checked by two independent reviewers and any disagreement was resolved employing the arbitration of a third reviewer.
Quality Assessment
According to a hierarchy of evidence in the diagnostic test studies from the Cochrane methods group (7, 8), only studies in Grade A (an independent, blind comparison with reference standard among an appropriate population of consecutive patients) and Grade B (an independent, blind comparison with reference standard among an appropriate population of non-consecutive patients or confined to a narrow population of study patients) were included in this review.
Data Extraction
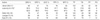
The common information including the articles' Grade, author, published time, number of subjects, mean age, lesions, and level of PSA. were extracted. Other data such as true positive value (TP), true negative value (TN), false positive value (FP), false negative value (FN), sensitivity (SEN), specificity (SPE), accuracy (ACC), positive likelihood ratio, negative likelihood ratio were also extracted.
Data Analysis and Synthesis
The meta-test software (VERSION 0.9 Joseph Lau, MD-New England Medical Center, Boston, MA) was used for the data analysis and synthesis. Group differences between two diagnosis criteria were considered significant at a p value of < 0.05 by Fisher's Exact test.
I) Homogeneity test: Diagnostic meta-analysis achieved by pooling the results of individual studies. The results produce a common effect size. As a result, before the data were pooled and calculated, a test of the homogeneity of results between the different studies was necessary using the Q statistic of the Chi-square value test.
2) Statistical model: The statistical model used in the meta-analysis included a fixed effects model which was chosen following the determination of the absence of heterogeneity. Alternatively, if the heterogeneity test failed, a random effects model was selected to analyze the data (9).
3) Meta-analysis: The appropriate statistical model was selected to calculate pooled weighted values of sensitivity and specificity with the corresponding 95% CI (95% Confidence Interval). According to Moses et al. (10), we established a linear regression equation between D and S as follows: D = logit (TPR) - logit (FPR); S = logit (TPR) + logit (FPR) (TPR - true positive rate, FPR - false positive rate). The model is D = A + BS (A is the regression intercept and B is the regression coefficient). A and B can be calculated by the least square method. Moreover, the model can be transformed back to the conventional axes of TPR against FPR, which facilitates the determination of a SROC curve to calculate the area under the SROC. If the curve is closer to top-left corner, the area under curve (AUC) is larger, which means that the diagnosis is more accurate.
RESULTS
The Characteristics of Included Articles
According to criteria set in the index words, a total of 140 papers were screened from the above-mentioned databases. However, only 7 studies remained after taking into account the inclusion and exclusion criteria. Among these articles, two were of Grade A, whereas the other five were of Grade B (Table 1). In clinical practice, the classification system described by Kurhanewicz et al. (6) was often used: normal - a voxel of signal intensity ratios of (choline + creatine) / citrate lower than 0.75; suspicious - between 0.75 and 0.86; definitive tumor - above this threshold. To calculate the sensitivity and specificity, descriptive statistical data (TP, TN, FP, and FN) were determined by using two dichotomized rating systems: one with a voxel ratio of less than 0.75 which was not determined to be cancer, as opposed to a voxel ratio greater than 0.75 which represented a finding of cancer. While another cut-off value was 0.86. Five studies used a diagnostic value of 0.75 as a cut-off criteria (Table 2), as opposed to five studies, which used a diagnostic cut-off value of 0.86 (Table 3).
Data Analysis
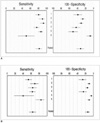
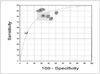
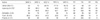
The homogeneity test showed: Q1 = 37.20, P1 < 0.01, Q2 = 23.17, P2 < 0.01. Therefore, in these two groups, the random effects models was used for the meta-analysis. Forest plots for two groups were constructed and the pooled weighted sensitivity, specificity, and corresponding 95% CI were calculated (Fig. 1, Table 4).
Statistical Testing
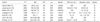
The pooled weighted sensitivity of the first criterion was higher 0.82 (0.73, 0.89) than the second 0.64 (0.55, 0.72), in which the p-value was < 0.0001, Chi-square value = 57.13 However, its specificity is lower [0.68 (0.58, 0.76) vs. 0.86 (0.79, 0.91)] than, a p-value < 0.0001, Chi-square value = 118.30. However, the difference between the two AUCs was not significant, 83.40 versus 82.70 (if the difference between two AUCs was greater than 5%, the diagnostic performance between two objects had statistics significance, which suggested that the accuracy would be same) (Table 4).
DISCUSSION
In the diagnosis of prostate cancer, conventional modalities have their limitations. DRE misses up to 45% of all cancers subsequently detected on subsequent biopsies. Further, cancers detected by DRE are in an advanced stage in up to 50% of cases. Using a PSA cut-off value of 4 ng/ml as an indication of carcinoma of the prostate, up to 25% of men with cancer may be missed. In addition, the positive predictive value of the test is only 30% in asymptomatic men (4). An MRI performed using an endorectal coil is unsuitable as a primary diagnostic tool for detecting prostate cancer due to its low specificity and low positive predictive value (19); although, the accuracy of MRI staging for stages B and C is 77% and there is a high sensitivity of detection for extraprostatic tumor extension and seminal vesicle infiltration (20, 21). To date, the histopathologic examinations of biopsy tissue remain the gold standard for diagnosis of prostate cancer. However, this method only results in a sensitivity of 50% and specificity of 82%. In these cases, malignancies are easily overlooked because of their multi-focal and heterogeneous nature, which happens in as many as 85% of patients (22, 23). It has been reported that after a radical prostatectomy, the biopsy-determined result increased in as many as 54% of patients (24). Therefore, an accurate and noninvasive way of determining prostate cancer is needed to improve the ability to define subsets of patients in which a cure is possible and necessary.
The MRS can detect a resonance spectrum from different chemical compounds in tissues, which in turn, reveals structural information about the chemical compound as well as the metabolic information of the tissues. In normal prostate tissue, high levels of citrate are found. However, in the case of prostate cancer, citrate levels diminish or are undetectable because of a conversion from citrate-producing to citrate-oxidating metabolism. Moreover, the choline level is elevated due to a high phospholipids cell membrane turnover rate in the proliferating malignant tissue. Hence, the method for depicting tumors is based on an increased (choline + creatine) / citrate ratio (22).
A meta-analysis is a statistical analysis that combines or integrates the results of several independent studies considered to be combinable. The reliability of the results depends on the quality of the included studies and whether the result of the analysis is reliable. According to Cochrane's methods of screening and diagnosis (Table 5), the suggested quality in the five levels of diagnostic procedures were (Grade A and Grade B) for analysis by two reviewers' independent evaluation, which may lead to a selection bias with more information. All the studies we used for this study are prospective observational (independent), blind comparisons with a reference standard, in which radiologists scan and diagnose the patients after the scientific experiment design. According to our selection criteria this meta-analysis included only 7 studies out of the many reviewed articles. One reason for this low number is that MRS has been used in diagnosing prostate cancer for only a few years and related studies are scarce. Another factor is that the quality of these studies on the basis of inclusion in meta-analyses are not high. Case in point, only two studies qualified as Grade A, whereas the other five studies included subjects that all had prostate cancer, which represented a selection bias of the subjects, though the MRS tests the peak of choline, citrate, and creatine in the different voxels of whole prostates. Moreover, the two radiologists are unaware of which patient has prostate cancer. According to Table 1, our intentions were to analyze the homogeneity of the basic information of all studies including PSAs, Gleason grades which may affect the assessment of the results (6). However, it is impossible to achieve this because data is not integral.
In some studies detected voxels are determined by biopsy sites. However, a biopsy is inaccurate because prostate cancer is multi-focal and heterogeneous in nature, and it is limited in examining all cancers, sites, and grades (24). Hence, their (15, 16) positive results are much smaller than the negative results and the sensitivity is not so reliable.
According to Kristen et al. (25) who measured the MR spectroscopic imaging, and the ratio of prostate tumor for (Cho +Cr) / Cit ratio. A positive correlation was found with the pathologic Gleason score. His data indicated that in the diagnosis, cancer with a Gleason score of 3 +3, the MR spectroscopic imaging tumor detection sensitivity was 44.4%, and the sensitivity increased to 89.5% in cancers with a Gleason score of more than 8. Thus, a large proportion of tumors with a Gleason score of 6 and under 6 did not generate abnormal voxel metabolite ratios. One possible explanation for this finding is that these tumors tended to be smaller, thereby permitting a volume averaging with noncancerous tissue. Another is that low-grade tumors (below 6) may be missed, due to slight alterations in citrate and choline levels. In all studies except that of Prando et al. (17) we have not talked about tumor or volume, so we didn't further analyze it.
We use SROC to analyze our meta-analysis results. The advantage of SROC curves is that the curves may be tested for symmetry and therefore can be determined if a subgroup analysis is appropriate. A disadvantage of SROC curves is that if a large variability is present between subgroups, the goodness of fit using SROC curves will be limited (26). In this meta-analysis, we have only compared the value of two criteria. The two AUCs are similar; however, their sensitivity and specificity possess noticeable differences. Hence, the combination of the two criteria may improve the accuracy in clinical use.
In China, the cut-off value for diagnosing prostate tumors has not yet been determined. Different researchers have studied different values. Wang et al. (27) and Li et al. (28) compared the value of MRS. However, their study results were compared to biopsy and non-pathologic results, which yielded a different set of outcomes. At the present time, we still need large samples and multi-center studies to increase the confidence in the results.
In conclusion, we could not analyze the literature with a more reasonable option than we have now, due to poor reporting in the primary studies and small quantity of studies. Here, we supply just the primary assessment of the value for MRS in clinic. More prospective studies will be needed to consummate it.


 XML Download