

 PDF
PDF ePub
ePub Citation
 Print
Print


Magnetic resonance imaging (MRI) is widely used in the morphologic assessment of the renal parenchyma and excretory system. It is especially useful in evaluating renal masses, the prenatal genitourinary system, urinary obstructions or infections (1). The functional evaluation of kidneys has been of interest for many years (2-7). A very high percentage of the functional kidney studies concern renovascular diseases (RVDs). An RVD can be a cause of hypertension and 1-5% of patients with hypertension have a RVD (8, 9). Although rare, diagnosis is important because RVD is potentially curable. More than 50% of high-grade stenosis progress to occlusion within two years (10, 11). MR can demonstrate structural and functional changes and plays an important role in the diagnosis of RVD.
Gadobutrol (Gadovist, Schering, Berlin, Germany) is a gadolinium-based paramagnetic contrast agent. It is freely filtered by the glomerulus without tubular secretion or re-absorption. The total plasma clearance of gadobutrol is very close to renal clearance, so glomerular filtration is the main pathway of elimination (12-14). The recommended gadobutrol dose changes depending on the region of interest (ROI), and ranges from 0.1 to 0.27 mmol/kg (15). The use of a concentration of 1 M, gadobutrol allows a reduction of the injection volume by 50% as compared with the use of equimolar doses of MR contrast agents used at a concentration of 0.5 M. It has been shown that a reduced injection volume can cause a sharper bolus peak and increased intravascular first-pass gadolinium concentration (13-18). A relative high contrast material concentration allows a reduction in injection volume and results in a sharper bolus peak that is important for MR angiography and perfusion imaging, but can cause a signal loss due to the T2* effect (19, 20). A higher concentration would potentially cause a reduction in dose. The purpose of this study is to test the use of low dose (0.05 mmol/kg) of gadobutrol in MR renography and angiography and compare the findings with the use of a dose of 0.1 mmol/kg.
MATERIALS AND METHODS
Patients
A total of 134 patients (70 female, 64 male) with a mean age of 49 years referred for MR angiography for suspected RVD participated in the study. Patients were divided into two groups randomly: fifty-seven (43%) patients were included in the first group and 77 (56%) patients were included in the second group. The mean patient age was 50 ± 15 years in the first group and 48 ± 16 years in the second group. No age and sex difference were noted for patients in either group (p > 0.05). The study was designed and performed according to the principles of the Helsinki Declaration. All participants provided informed consent. Patients were recruited in the study based on an impaired renal function and/or poorly controlled hypertension. Patients were excluded from the study when they had a single functional kidney or when they had bilateral or unilateral renal atrophy with impossible cortical differentiation as seen in the early phase of contrast-enhanced images.
MR Imaging
Contrast enhanced MR renography was performed on a 1.5-T Siemens Symphony system (Siemens Medical Solutions, Erlangen, Germany) using a phased array body coil. A bolus of 0.1 mmol/kg gadobutrol (Gadovist, Schering, Berlin, Germany) was administered to 57 patients and a bolus of 0.05 mmol/kg was administered to 77 patients in randomized order. Contrast material was delivered at 2 mL/second into an antecubital vein using an infusion pump injector (Misissipi, Ulrich Medizintechnik, Germany), and nine coronal three-dimensional image datasets were acquired at baseline, 18, 36, 54, 72, 90, 300, 420 and 540 seconds using a three-dimensional FLASH (fast low angle shot) sequence (TR = 3.0 msec, TE = 1.2 msec, flip angle = 25°) (7). The thickness of the slice block was variable and ranged from 70 to 90 mm, depending upon the size of patient and the tortuosity of the aorta as determined by scout examinations. A total of 46-54 coronal slices were acquired across the slice block, generating an objective slice thickness of 1.63 mm. The field of view (FOV) was also variable, and ranged from 257 to 512 mm, depending upon the size of patient. The scan time was restricted to 18 seconds to minimize respiratory artifacts. For morphologic assessment, a coronal 2D-trufi (TR = 4.3 msec, TE = 2.1 msec) MR sequence was applied to all patients before the administration of contrast material. All examinations were performed with breath holding at the end of inspiration.
Image Analysis
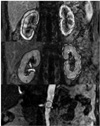
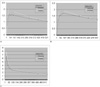
Images were transferred to a dedicated offline computer workstation (Leonardo, Siemens Medical Solutions, Erlangen, Germany). An ROI was placed over the entire peripheral renal cortex and parenchyma on coronal images, and a circular ROI was placed covering the full thickness of the aorta at the level of the renal arteries (Fig. 1). Time-intensity curves were generated in each region (Fig. 4).
To correct for possible variations in MR signal intensity among patients due to receiver gain and coil positioning, measured signal intensities (SIi) were standardized relative to baseline values prior to contrast material administration (SI0), according to the calculation (SIi - SI0)/SI0. Cortical and parenchymal intensity changes in the kidneys and luminal intensity changes in the aorta by the time were plotted and the relative signal intensity-time curves were obtained (5). The long and short axis and parenchymal thickness of the kidneys were measured in coronal trufi images.
MR Angiography
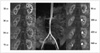
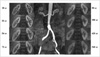
MR angiographic images were formed by using the three-dimensional FLASH sequence used for MR renography (3.0/1.2, flip angle of 25°, FOV of 257-512 mm, and rectangular FOV depending on the body habitus). A nonenhanced image was acquired first to serve as a mask for subtraction. Image acquisition times were 18 seconds and the first sequence was used for MR angiographic evaluation. MR angiograms were subjected to a prospective qualitative analysis based on a segment-by-segment review. The MR angiography data sets were available on a workstation that allowed for viewing of the source images, maximum intensity projections (MIPs), and multiplanar reconstructions (Figs. 2, 3). Two radiologists assessed the image quality for arterial visualization. These reviewers were blinded to the dose of contrast material and patient identity and clinical history. To achieve objective evaluation, qualitative assessment was performed for nine vessel segments covering the entire vascular territory of interest. The vessel segments evaluated were defined as follows: segment I, the suprarenal abdominal aorta; segment II, the juxtarenal aorta (including the part approximately 2 cm above and below the renal arteries and any accessory renal arteries); segment III, the infrarenal aorta down to the bifurcation; segments IV, V, the proximal third of the renal arteries (left and right); segment VI, VII, the middle third of the renal arteries (left and right); and segments VIII, IX, the distal third of the renal arteries (left and right). Accessory renal arteries and proximally bifurcated renal arteries, if present, were similarly divided into proximal, middle, and distal segments; and were assessed together with each principal renal artery segment. For each of the nine vessel segments, an image quality score between 0 and 2 was assigned, with the scores defined as follows: 0, poor diagnostic information (impossible to detect or exclude vascular lesions); 1, moderate diagnostic information; 2, adequate diagnostic information. A total image quality score was determined for each contrast-enhanced MR angiographic examination as the sum of the numeric scores assigned to each of the nine vessel segments and ranged from 0 (poor diagnostic information for all nine segments) to 18 (adequate diagnostic information for each of the nine segments) (21). Insufficient studies (a score ≤ 3; one case in the 0.1 mmol/kg-dose group and three cases in the 0.05 mmol/kg-dose group) were repeated with the same dose. Only arterial enhancement was assessed; no scoring was performed for renal venous enhancement. Image artifacts, if present, were noted, but no specific scoring for artifacts was performed.
Statistical Analysis
The student t-test was used to compare age and sex, renal morphologic measurement and relative intensity values. To compare the total image quality scores of observers between the two dose groups, the Mann-Whitney U test was used. The Wilcoxon Signed Ranks test was used to compare the difference of total image quality scores between two observers. To analyze the mean and standard deviation values of the total image quality scores, descriptive statistics were used. We used the Kappa test to asses the concordance of the readers in quality assessment of MR angiography.
RESULTS
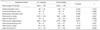
No age difference was noted between the two patient groups. The long and short axis length and parenchymal thickness of the kidneys showed no differences between the two groups. The areas and pixel counts in the ROI drawn to form relative signal intensity-time curves of the cortex and parenchyma showed no difference. The pixel count in the aorta showed a significant difference, but there were no differences in areas (Table 1).
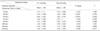
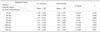
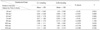
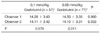
The relative signal intensity with the low dose was significantly lower in the peripheral cortex for 36, 54, 72 and 90 seconds (Table 2), for the renal parenchyma in 36, 54, and 72 seconds, and for the aorta in 18, 36, 54, and 72 seconds (Tables 3, 4). These decreases in early phase obtained with low dose caused a decrease in amplitude of the relative signal intensity-time curves (Fig. 4).
The quality assessment scores of angiography showed moderate agreement between the two readers with a Kappa value of 0.567 (p < 0.001). No statistically significant difference between the two dose groups according to the each reader individually was noted (p > 0.05). The difference in the total score between the two observers was significant in the low dose group (p < 0.05) and was not significant for the normal dose group (p > 0.05) (Table
5).
DISCUSSION
Dynamic MR imaging is a well-known technique that provides both morphological and functional information for RVD (2, 4, 22-24). Schoenberg et al. (6, 22) described that either a normal curve or partial loss of the early systolic peak in time intensity curves is consistent with a low grade of stenosis. Complete loss of the early systolic peak and a decrease of the midsystolic peak indicated moderate stenosis (50%); a flattened profile with no systolic peaks was representative of high-grade stenosis.
The neutral gadolinium chelate agent gadobutrol allows the use of gadolinium concentrations of 1.0 M for intravenous injection (12). The high concentration provides increased gadolinium concentrations at the temporal bolus peak and a sharper bolus profile because of reduced injection volumes, which can be advantageous for perfusion imaging and angiography (14, 25, 26). An intravenous injection of 1.0-M gadobutrol at a dose of up to 0.1-0.27 mmol/kg in the indication of contrast enhanced MR angiography is safe and causes no clinically relevant changes (12, 14, 27). To the best of our knowledge, no study has reported about the use of low dose gadobutrol in MR angiography and renography.
In this study, we compared MR angiography and MR renography findings of patients where doses of 0.1 mmol/kg and 0.05 mmol/kg gadobutrol were administered. The mean relative signal intensity-time curves made by drawing ROI to include peripheral cortex, parenchyma and aorta showed a lower intensity for the low dose than for the normal dose group of patients, especially in the first 90 seconds of the study with a duration of 9 minutes. The early arterial peak in the relative signal intensity-time curves obtained by renal functional MR imaging is known to be important in renal arterial stenosis (1, 6, 7, 22, 23). Although the curves in both groups were almost similar, early differences can alter dynamic functional evaluation of the kidneys, especially for renal arterial stenosis, because of blunt early arterial peeks.
The relative signal intensity-time curve in the aorta was significantly higher in 18, 36, 54, 72 seconds for the regular administered dose of gadobutrol. Theoretically, a dose of 0.1 mmol/kg would be better for angiography than a dose of 0.05 mmol/kg because of the higher relative intensity in the first sequences. The angiographic quality assessment scores of the two readers showed moderate agreement with a Kappa value of 0.588 (p < 0.001). The body habitus, circulatory condition and adaptation to the technique, especially by breath holding, can affect the quality of images. In addition, we did not use objective criteria for quality assessment. All of these cause could be the reason of the moderate Kappa value. Although there is a moderate agreement, both readers did not note a difference in the quality scores between the two dose groups. The difference of the relative signal intensity in the very early phase of the aorta did not affect the angiographic quality scores of the readers.
A lower and blunter early cortical phase in relative signal intensity-time curves with a low dose may potentially affect the MR angiography and functional evaluation for renal arterial stenosis. However, these differences of the relative signal intensity-time curves did not affect angiographic quality. A lower dose can be used in renal angiography alone, but for functional evaluation, the normal dose should be used. We believe that a low dose can also be used for renal parenchymal evaluation or magnetic resonance urography; as the renal parenchyma and late excretion phases showed no significant difference.
 XML Download