

 PDF
PDF ePub
ePub Citation
 Print
Print


Multi-detector computerized tomography (MDCT) provides volumetric images of the lungs and bronchial tree geometry to the sub-lobal level with sub-millimeter resolution. It is possible to measure quantitatively various anatomical features including the airway wall thickness, luminal diameter, wall area, lumen area, wall-lumen area ratio and wall-lumen diameter ratio, which were previously studied only by the use of indirect methods such as pulmonary function tests. Quantification of the peripheral geometry using MDCT images provides an important tool for evaluating the regional airway physiology and structure. Dimensions of the bronchial tree can be used to evaluate and track the development of disease affecting the airways, such as asthma and chronic obstructive pulmonary disease (COPD), and the determination of bronchial tree dimensions can be used to assess the efficacy of new therapeutic approaches (1, 2).
A variety of techniques has been proposed for the measurement of extra- and intra-thoracic airways in two-dimensional (2D) sections on volumetric X-ray CT images. Simpler methods to assess airway dimensions include the use of manual or semi-automatic border tracing and measurement on film, a computer monitor or by the use of a projected image with the adjustment of window and level (3-5); these methods are not free from intermeasurement variability. The full-width-half-maximum (FWHM) method is a typical technique as an objective, quantitative approach to automatic airway measurement (6-8). The half-maximum criteria assume that the image gray level at the true airway wall will be halfway between the minimum and maximum gray levels along a ray crossing the wall. By casting a number of rays at different angles from the centroid of the airway, inner and outer wall locations can be estimated by examining the graylevel profile along each ray. Although the FWHM method is regarded as a simple and robust method (6, 7), in previous studies, it has been shown that the measuring accuracy of the FWHM method is strongly influenced by the target size, shape, and imaging parameters (8).
It is known that the critical site of airway obstruction in patients with COPD is in the small airways that are defined as having a luminal diameter of less than 2 mm (9-11). Accordingly, accurate measurement of small airway dimensions on CT has been of importance and there have been several reports on the measurement of small airway dimensions using the FWHM method (11, 12). However, measurement of small airway dimensions may not be accurate as edge detection using the FWHM method is known to be influenced by several factors, such as the imaging parameters of the CT scanner and the size of the airways (13).
The aim of this study is to evaluate the influence of variable factors such as the size of the airway and the CT image reconstruction parameters for measurement of an airway dimension using the FWHM method. Using CT scans of a physical phantom, we attempted to determine the optimal imaging parameters and limitations of the FWHM method for obtaining an accurate measurement of an airway dimension.
MATERIALS AND METHODS
Airway Phantom
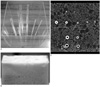
The phantom consisted of eleven poly-acryl tubes that simulated airways, with various inner diameters and wall thicknesses. The measured density of the artificial airway wall on CT images was 150 HU. The tubes were contained in a poly-acryl box. The airspace outside of the tube was filled with polyurethane foam ( -900 HU) to simulate the lung parenchyma with emphysema. The actual dimension of the artificial phantom was repetitively measured using a digital caliper (Digimatic Caliper, Mitutoyo, Kawasaki, Japan). The resolution of the caliper was 0.01 mm and its accuracy was ± 0.02 mm. Measurement was performed ten times at different locations along the z-axis of each tube, and the mean value was used as a reference standard.
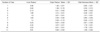
The actual dimensions of the tubes are shown in Table 1. The ranges of the inner lumen radius and the outer lumen radius were from 0.63 mm to 4.23 mm and from 1.08 mm to 6.04 mm, respectively. The range of the wall thickness was from 0.45 mm to 3.08 mm. Figure 1 presents the physical phantom with and without polyurethane foam. The representative CT image of the phantom was scanned at an angle perpendicular to the axis of the tubes.
CT Imaging and Data Storage
The phantom was scanned on a 16-multi-detector row CT scanner (Siemens Sensation 16, Siemens Medical Solutions, Erlangen, Germany) with a 16 × 0.75 mm collimator 100 effmAs, pitch 1.0 and 120 kVp, which are similar to the parameters of a routine chest CT scan protocol. The CT images were reconstructed using a 512 × 512 matrix with every combination of the following parameters: five different reconstruction kernels (B10f, B30f, B50f, B70f and B80f) and three different slice thicknesses (0.75, 1, and 2 mm) with a 360-mm field of view (FOV). The B10f reconstruction kernel corresponds to a soft reconstruction kernel, the B50f reconstruction kernel corresponds to a standard reconstruction kernel and the B80f reconstruction kernel corresponds to a sharp reconstruction kernel. In addition, data were reconstructed in three different FOVs: 180, 270, and 360 mm (corresponding to an in-plane pixel size of 0.352 mm × 0.352 mm, 0.527 mm × 0.527 mm and 0.703 mm × 0.703 mm, respectively), with a standard reconstruction kernel (B50f) and a 0.75-mm thickness. The resulting 2D image data were stored in the Digital Imaging and Communications in Medicine (DICOM) format, the international standard for interconnecting medical imaging devices on standard networks.
Data Processing and Analysis Procedure
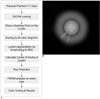
In-house software was developed at the Asan Medical Center for airway measurement. Figure 2 shows a schematic diagram of the data processing and analysis. The software was developed for interactively analyzing pulmonary images and for providing measurement tools for the quantification of the airways. For each of the eleven phantom tubes, the software provided a graphical user interactive interface to identify the approximate airway center by pointing with the use of a computer mouse. For pre-processing, the software magnified the image ten times using a bi-cubic interpolation algorithm, segmented the airway lumen using the lumen threshold parameter (HU), and calculated the center of inertia of the airway lumen. In general, the FWHM algorithm is regarded as a robust interpolation algorithm. The software was then used to make the half-maximum measurements and to collect the gray-level profiles for airway dimension measurements. By analyzing the 120 rays cast around 360 degrees from the center point, the luminal radius (inner boundary), outer boundary, wall thickness, and wall thickness inside two standard deviations (SD) were measured using the FWHM method which is one of the most typical airway wall measurement algorithms (6-8, 13). On a 10 × magnified image, the pixel values were interpolated along the ray using a bi-linear algorithm. Final estimations included the area of the airway lumen, the lumen radius, mean wall thickness, and mean wall area.
Statistics
The luminal radius and wall thickness of each tube were measured on CT images. Each measurement was performed ten times at different locations along the z-axis, and the average measurement was used for statistical analysis. To determine the effects of parameters on the airway dimension measurement using the FWHM method, the actual dimension of each tube and the measured dimensions of the CT scans of the physical phantom, were compared using the Bland-Altman method. The distribution of measurement discrepancies across the lumen radius and the airway wall thickness were examined using Spearman correlation analysis between the absolute value of the measurement discrepancy and the actual measurements. The paired t test was used to determine the presence of a significant difference between each set of measurements and the actual reference dimensions. A p value less than 0.01, i.e. the Bonferroni adjustment to account for multiple comparisons, was considered as statistically significant. All other statistical tests were performed using Statistica 7.0 (StatSoft, Tulsa, OK).
RESULTS
Feasibility of Airway Dimension Measurement Using the FWHM Method
In cases of the use of the smoother reconstruction kernels (B10f, and B30f), the small airway lumen and wall thickness of the first and second tubes could not be measured. A severe partial volume effect made the profile of these tubes, which have a lumen radius of less than 0.66 mm, unrepresentative of the typical curve of the airway lumen and wall. Therefore, these measurements were treated as missing measurements. In addition, all of the measurements of the first and second tubes were excluded in all statistical tests, as there is a measurement limitation of the spatial resolution of MDCT below a 1-mm wall thickness with the use of the FWHM method (Fig. 3).
Airway Wall Thickness Effect of the CT Reconstruction Kernels
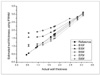
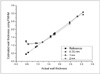
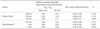
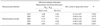
Figure 3 shows the mean absolute errors for estimating the inner and outer radii of the phantom tubes listed in Table 1 with the use of the various reconstruction kernels with a 360-mm FOV and a 0.75-mm slice thickness. There is a clear overestimation bias in measuring the wall thickness using a soft kernel (B10f and B30f) and an underestimation bias using a sharp kernel (B80f) (Table 2). Airway wall thickness measured automatically with soft reconstruction kernels was significantly different from the reference size (for B10f, p = 0.006; for B30f, p = 0.009), whereas the airway wall thickness determined with the use of standard or sharp reconstruction kernels was not significantly different from the reference size (Table 2).
Effect of the FOV and Slice Thickness
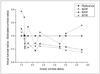
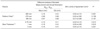
The measured airway wall thicknesses on CT images with various FOVs were not significantly different from the actual wall thicknesses (Table 3). There were rapidly increasing errors of the airway wall measurement when the thickness of the phantom was less than 1 mm. Even with the use of a smaller FOV, the measurement accuracy of wall thicknesses of less than 1 mm could not be improved (Fig. 4). Similarly, slice thickness did not affect the measurement accuracy (Fig. 5). The measured airway wall thicknesses determined with the various reconstructed slice thicknesses were not significantly different from the actual wall thicknesses (Table 3).
Effect of the Size of the Airway Wall Thickness
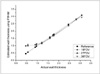
Correlation analyses showed strong correlations between the estimated and actual airway wall thicknesses for all of the reconstruction kernels (for all of the reconstruction kernels r > 0.95, p < 0.001). In case of the use of the standard reconstruction kernel (B50f), the correlation between the measured wall thickness on images and the actual wall thickness was statistically significant (r = 0.98, p < 0.001).
Luminal Radius Effect of the CT Reconstruction Kernels
Table 4 shows the difference between the estimated and the actual luminal radius with the use of the various reconstruction kernels with a 360-mm FOV and a 0.75-mm slice thickness. There is a clear underestimation bias when measuring the luminal radius on CT image reconstructed with a soft kernel (B10f) and an overestimation bias on CT images reconstructed with a sharp kernel (B70f and B80f). Figure 6 shows the differences between the actual and estimated airway luminal radii as compared to the actual airway luminal radii on the images reconstructed using various reconstruction kernels.
Effect of the FOV and Slice Thickness
The measured airway luminal radii on CT images with various FOVs were not significantly different from the actual radii (Table 5). Similarly, slice thickness did not affect the measurement accuracy, although there was a general tendency of overestimation of the luminal radii on images reconstructed with the use of B50f (Table 5).
DISCUSSION
In airway diseases, noninvasive measurement of wall dimensions is critical for research and clinical studies. There have been a number of trials to assess airway wall dimensions by the use of high resolution CT (HRCT) in asthma and COPD (12, 14-22). Recently, MDCT has been shown to provide volumetric data of the whole lung. However, in previous studies various methods of image acquisition and measurement were used (12, 14-22). In most studies, airway dimensions were measured by semi-quantitative assessment by manual tracing of the inner- and outer-perimeter of an airway wall on film, a computer monitor or by a projected image with the adjustment of window and level (14, 17-19). By this semi-quantitative method, problems occurred when small bronchi were measured as the interfaces between the lumen, wall and lung parenchyma became more difficult for the operator to define as they became increasingly indistinct. Therefore, there is a need to standardize the CT protocols and measurement methods.
Nakano and coworkers measured airway dimensions in 114 smokers by the use of an automatic computerized method using the "full width at half maximum (FWHM)" principle (16). The FWHM method is one of quantitative methods of automatic airway measurement.
This study has shown that among the evaluated CT parameters, the reconstruction kernel is the most important for accurate measurement of airway dimensions, and this is in concordance with the results of a previous study (12). As measurements of airway dimensions are based on the determination of the half-level of the CT density profile, the choice of reconstruction kernel may largely affect the accuracy of the measurement. The CT density profile is broadened by use of a softer reconstruction kernel, which results in an overestimation of the airway wall thickness and underestimation of the lumen diameter (23). In addition, the actual size of the airway also influenced the accuracy of measurement, because limitation of spatial resolution results in broadening the CT density profile. The correlation study of the measurement error and the actual airway wall dimension indicate that a thinner wall thickness and softer reconstruction kernel result in an overestimation of the wall thickness. The current study shows that the most accurate luminal radius and wall thickness may be obtained by use of a standard kernel (B50f); these results are similar to the findings of a previous report (12).
There has been increasing interest on the measurement of smaller airways as it has been recognized that the critical site of airway obstruction in patients with COPD is in small airways that are defined as less than 2 mm in the luminal diameter (9-11). Accordingly, accurate measurement of small airway dimensions on CT has been considered as important and there have been several reports on the measurement of the small airway dimensions using the FWHM method (11-13). It is important to acknowledge the limitation of an airway thickness above which an accurate or reliable measurement can be acquired. Hasegawa et al. (12) determined that airway dimensions can be measured if the airway has an inner diameter larger than 2 mm located anywhere in the lung. These investigators focused a phantom study on defining the measurable inner diameter rather than the measurable wall thickness. In the present study, we showed that airways with a wall thickness of less than 1 mm could not be accurately assessed using current CT techniques. Anatomically, airways that are 1 mm in wall thickness correspond to the sixth level of airways in humans (1). This finding suggests that the FWHM method can be used in the fourth to fifth generation segmental airways in clinical practice.
To overcome the limitation of spatial resolution, we adopted the use of the bi-cubic interpolation technique, by which the number of pixels of a given region of interest (ROI) were increased by 100 fold. However, limitation of spatial resolution could not be improved. Interestingly, the accuracy was not improved even when the FOV was reduced to 180 mm. This limitation seems to stem from the mechanical limitations of CT. Therefore, an airway with a wall thickness less than 1 mm is not accurately measured using the FWHM method with current clinical CT equipment (24). The slice thickness did not affect the measurement accuracy of the wall thickness, which was expected, as the phantom was placed perpendicular to the gantry orientation. If the airway is oriented obliquely to the imaging plane, these parameters also affect the measurement accuracy (25).
McNamara et al. (26) measured airway dimensions using HRCT in the excised canine lung and this experimental study suggested that HRCT might allow measurement of airway wall thickness and determination of the site of airway narrowing in patients with asthma. Several investigators have attempted to measure airway dimensions by the use of HRCT and to demonstrate a correlation between airway wall thickness and pulmonary function in asthma and COPD (12, 14-22). In asthmatic patients, many studies have shown a good correlation between airway dimensions and clinical functional parameters in various clinical settings (14, 15, 17, 18). In COPD patients, it is known that the extent of emphysema can only partially predict the severity of the pulmonary functional changes (27, 28). Several studies have shown that pulmonary function abnormalities are more accurately predicted by a combined evaluation of the extent of low attenuation areas or emphysema as well as by the airway wall thickening seen on HRCT (12, 16, 20). In addition, by combining the information of the lung density and airway dimensions, sub-grouping of the COPD patients into airway dominant or emphysema dominant types may be possible, which can be important to optimize the treatment strategy (29).
There are several limitations to this study. First, the density of tubes used for the phantom is higher than that of real airways and this may affect the results. However, the FWHM method is known to be resistant to the density differences of various measured materials. Second, the results of this study regarding the threshold of a measurable airway may not be transferred directly to clinical CT images, as there are additional factors that hamper the accurate measurement of airway dimensions, such as cardiac motion, respiratory motion, and mucosal edema or secretions. Lastly, we have used a CT scanner for this study. There may be a difference in results with use of different CT equipment from different manufacturers, although the difference would be small because as each manufacturer uses similar reconstruction kernels and other imaging parameters.
In conclusion, the accuracy of airway wall measurement using the FWHM method is strongly influenced by the reconstruction kernel. Due to the limits of spatial resolution using MDCT and to the partial volume effect, an airway wall thickness less than 1 mm could not be accurately measured. For clinically acceptable measurement of airway dimensions, CT images should be reconstructed using the standard kernel.

 XML Download