

 PDF
PDF ePub
ePub Citation
 Print
Print


Ultrasonography (US) has been used as a primary diagnostic modality for renal vein thrombosis (RVT), which is the most frequent renovascular disease in neonates and a major complication of the nephrotic syndrome (1, 2). The early diagnosis of RVT is especially important in children and younger patients, because it presents an acute problem, which is more favorably responded to, in the early treatment for younger age groups (2). The US findings associated with acute RVT include an enlarged echogenic kidney with poor corticomedullary differentiation. The echogenic filling defects can be seen in the renal vein or in the inferior vena cava (3, 4). However, conventional gray-scale and spectral Doppler (SD) have been shown to have a low sensitivity and specificity for the diagnosis of RVT, and only a limited role in early diagnosis prior to morphological changes of the kidney (5-7).
A power Doppler (PD) is more sensitive than color Doppler (CD) for detection of blood flow. Recent development of this technique has made it possible to objectively quantitate the PD signal (8-10). However, the usefulness of PD for the diagnosis and monitoring of RVT has not been determined. The purpose of this study was to assess the feasibility of using a PD for the diagnosis and monitoring of RVT by evaluating the hemodynamic changes of the PD signal in complete or partial obstruction and recanalization of the renal vein in a canine model.
MATERIALS AND METHODS
Animal Preparation
All procedures were conducted with the approval of the animal research committee at our institution. We used nine adult mongrel dogs (mean body weight of 25 kg). Each dog was sedated with an intramuscular injection of 4 mg/kg xylazine hydrochloride (Rompun, Bayer Korea, Seoul, Korea) and 10 mg/kg ketamine hydrochloride (Ketara, Yuhan Yanghang, Seoul, Korea) for the procedure and examination. All the dogs were immobilized in the supine position on a fluoroscopy table and subsequently intubated, mechanically ventilated, and anesthetized with 2% enflurane gas. Next, after the cutdown of the left jugular vein, a 7 Fr introducing sheath (Cook, Blooming, IN) was placed. Moreover, the left renal vein was selected and an 11-mm occlusion balloon catheter (B5F-25-70-C2; Clinical Supply Co., Ltd, Hashima-gun, Japan) was placed within the left renal vein. According to a predetermined amount of contrast media for the graded occlusion of the left renal vein (which was obtained through a pilot study using seven dogs with similar body weights), the balloon occlusion of the renal vein was performed by injecting contrast media 0.0, 0.3 and 0.6 mL at each step resulting in no, partial, and complete occlusion respectively, followed by a venography to confirm the occlusion. The balloon position was intermittently monitored with fluoroscopy to minimize the change in position during US examination. After a complete occlusion, a graded recanalization was performed by a sequential balloon deflation, followed by a venography to confirm the recanalization.
Image Acquisition
A US examination was performed by the same radiologist using a HDI 3000 (Advanced Technology Laboratories, Bothwell, WA) and a convex 7-4 MHz transducer. A conventional gray-scale US of each kidney was carried out along its long axis, followed by a PD with an identical setting (dynamic range 50 dB, persistence Med, Frame rate Med, 2D opt: general, color gain: 85%, wall filter Med, PRF 700 Hz, flow opt: low V) in each kidney. PD images were captured for 5 minutes in each step at 1-min intervals between the steps according to the timetable. The image with the maximum flow by visual inspection was captured and scanning was performed with a hand-held technique to maintain a constant imaging plane during the examination. In addition, care was taken to minimize motion artifact. Next, a SD was also obtained in the segmental artery of the upper pole at each corresponding step. Moreover, special precaution was taken to maintain the conditions of the examined artery constant at each step.
Image Analysis
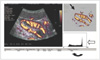
The captured images were saved on a hard disc and were transferred onto a personal computer using a Magneto Optical Disk. The images were converted to 24-bit color BMP format files using ACDSee software (ACD Systems, Arlington, TX). In a PD image, the background gray-scale image is mapped with gray pixels and the PD signal is mapped with color pixels. A personal computer-based image-analysis software (quant PDI®), which was specially developed to quantify the PD signal, was used to analyze the PD signal. The algorithm for the analysis was based on the separation of color and grayscale information by digital processing from digitized PD images. Moreover, the higher PD signal was mapped into a pixel with higher intensity in a linear fashion. The software calculated the integrated PD signal within the region of interest drawn by an operator along the border of the kidney (Fig. 1). For the SD imaging, peak systolic and end diastolic velocity was obtained by means of a manual caliper measurement. The resistive index (RI) ([peak systolic velocity-end diastolic velocity]/peak systolic velocity) was calculated as a mean of three subsequent cardiac cycles.
Statistics
The sequential change of the PD signal and RI was assessed by plotting the PD signal at each step during occlusion and recanalization of the renal vein in each dog. The statistical analyses were performed using two-way analysis of variances (ANOVAs) and Duncan multiple-range tests to assess the sequential change of the mean value of the PD signal and RI in nine dogs. Statistical significance was set a priori at p < 0.01.
RESULTS
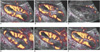
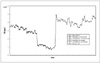
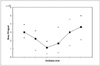
The PD images revealed a decrease in the signal intensity as the renal vein was occluded, and an increase after recanalization, as measured on the visual scale reading (Fig. 2). The time course of the PD signal during renal vein occlusion and recanalization in a dog is shown in Fig. 3. Prior to a balloon occlusion, the mean±standard deviation PD signal was 2.88×10⁶±5.43×10⁵. During the partial and complete occlusion, the PD signal decreased to 2.23×10⁶±9.63×10⁵ and 1.15×10⁶±8.82×10⁵, respectively. After balloon deflation, the PD signal increased to 1.60×10⁶±1.32×10⁵, and 2.92×10⁶±1.18×10⁵ during partial and complete recanalization, respectively. After removing the balloon catheter, the PD signal was 3.52×10⁶±8.73×10⁵, which was greater than at the observed baseline. The sequential change of the mean PD signal value was statistically significant (Fig. 4, p < 0.01).
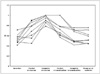
In the SD study, the RI increased as the renal vein was occluded, and decreased as occlusion was relieved (Fig. 5). The sequential change, of the mean RI value in nine dogs, showed a gradual increase during balloon inflation (0.54±0.07, 0.71±0.20, 0.93±0.14 at baseline, partial, and complete occlusion, respectively), and a decrease during deflation (0.74±0.20, 0.59±0.16, 0.55±0.11 at partial, complete recanalization, and catheter removal, respectively). The sequential change in the mean RI value was also statistically significant (p < 0.01).
DISCUSSION
We performed this study to determine whether PD can distinguish the hemodynamic change in acute renal vein obstruction and recanalization. According to our results, PD has the ability to detect the decreased renal perfusion immediately after a partial or complete renal vein occlusion. In addition, PD also demonstrated increased renal perfusion as the occluded renal vein was relieved. Based on these results, we suggest that PD may allow for the early diagnosis of acute RVT prior to the appearance of morphological changes.
Power Doppler is based on the integrated Doppler power spectrum, and the color map displays the integrated power of the Doppler signal, which is primarily related to the number of moving red blood cells. It is a technique suitable for assessing slow flow in small vessels because of its greater sensitivity to flow and reduced angle dependence. It is superior to the CD in the imaging of renal perfusion abnormalities and allows improved evaluation of the renal parenchymal microvasculature (11-14). Recent studies using an experimental animal model have shown that PD shows the hemodynamic change of the kidney with renal artery occlusion by quantification of the PD signal (8, 9). Helenon et al. (15). previously reported the potential of PD imaging for the diagnosis of RVT; however, this study used PD to visualize the vascular pedicle itself. To our knowledge, the use of PD for the evaluation of renal perfusion in renal vein obstruction has not yet been reported.
Ultrasonography is the primary diagnostic modality for the evaluation of patients with suspected RVT. The sonographic findings of RVT depend on the stage and severity of the venous occlusion. Immediately after obstruction of the renal vein, the kidney becomes enlarged and echogenic due to edema and hemorrhage. As time progresses, the echogenicity of the kidney decreases with poor corticomedullary differentiation and as cellular infiltration and fibrosis develop, the kidneys again become echogenic and vary in size. At any stage, the echogenic filling defects, representing thrombus formation, may be identified in the renal vein or inferior vena cava (4, 5, 16-19). Most of the previously mentioned gray scale US findings are secondary changes and may be absent in some patients with RVT. These changes are neither highly sensitive nor specific for this diagnosis (5-7). Furthermore, the demonstration of echogenic thrombi of the renal vein, which establishes the diagnosis, is difficult to achieve (6, 7, 20). A spectral and CD image can support the diagnosis by demonstrating either absence of venous signal or partial flow around the thrombus in the main renal vein or inferior vena cava. The venous outflow obstruction also diminishes the arterial flow, which leads to a narrow systolic arterial peak and an absent, reduced or reversed diastolic flow in the segmental renal arteries (3, 21). Despite this, previous studies have demonstrated that the classic SD signs of RVT (absent venous flow and reversed diastolic arterial flow within the kidney) were present only in the acute phase of transplanted kidneys, and these Doppler signs may not be present in the RVT of native kidneys, due to the prompt development of venous collaterals (3, 16, 22). Data on native kidneys have shown that venous collaterals could be formed in as little as 24 hours and often within the first two weeks after the onset of RVT (23). We also observed the prompt formation of venous collaterals during the occlusion of the renal vein by venography.
Our results showed that the mean PD signal, after removal of the catheter, increased compared to the baseline. The mechanism associated with this phenomenon is not fully understood; however, we speculate that it is likely due to compensatory arterial hyperperfusion following the release of temporary venous occlusion.
Advances in technology allow the objective quantification of the PD signal by counting the number of color pixels in a specific region of interest (8, 9). We quantified the renal perfusion based on the analysis of PD images with the aid of application software developed to quantify the PD signal automatically. This image analysis technique, in which the local statistical PD features such as mean power value (PV), peak PV, standard deviation of PV, percentage PD area, and integrated PV per unit area are extracted within the region of interest as defined by the operator, allow for an objective and reproducible assessment of renal perfusion (10).
Despite our results, this study had several limitations. Firstly this experimental study was conducted immediately after the balloon occlusion or recanalization of the renal vein. Most patients with RVT in the clinical practice are presented with variable chronicity of occlusion, with the formation of collaterals. Furthermore, thrombosis usually begins in small intrarenal veins. The result of our study may not be applicable to subacute or chronic RVT. Further studies are needed to assess the feasibility of PD imaging in a subacute or chronic model with peripheral thrombosis simulating the clinical situation. Another limitation relates to the technical aspect of PD, which is susceptible to an attenuation effect (i.e. loss of signal with increasing depth). This may not be a problem in superficial small organs such as the prostate. However, for the abdominal viscera including the kidneys, the attenuation effect is a significant issue. To take into account the US attenuation at the different depths of the investigated tissue, a normalization technique was introduced by Rubin et al. (24), which states that PD signals within a region of interest can be normalized for depth by assigning 100% of the power in regions composed entirely of blood, at similar depths. In our experimental study, the attenuation effect was not so problematic since the mongrel dogs used were about the same size, and their kidneys were located superficially. In addition to the attenuation effect, PD is also susceptible to a motion artifact of the probe or of the patient (breathing and gas), which can simulate blood flow. Therefore, PD has drawbacks when used in patients unable or unwilling to lie still or those who do not hold their breath during scanning (8). On a follow-up examination of patients with RVT, different Doppler parameters by different examiners may significantly affect the results. Therefore, scanning procedures should be performed uniformly to minimize inter- and intra-observer variation.
Although our study was performed primarily for the investigation of PD, we additionally examined the sequential change of the RI value during acute venous occlusion and recanalization. Overall, as expected, the RI value increased as the renal vein was occluded and subsequently decreased as the renal vein was recanalized. However, in two of the subject dogs, the RI values decreased during partial occlusion, in comparison with those at baseline values. We speculate that this phenomenon may be caused by the prompt development of collaterals, which allow for venous drainage, which also may contribute to relatively lower RI values during complete occlusion compared to those in the other dogs (Fig. 5). The overall results of the RI change in our study are somewhat in conflict with previous reports which demonstrated the limitations of RI in RVT of the native kidneys. This apparent inconsistency may be attributable to the aforementioned limitations of our study which do not allow for direct extrapolation to RVT with variable chronicity in the native kidneys. However, we think that our observations could be applicable to thrombosis of the renal allograft, which usually occurs at the anastomotic site of the renal vein acutely in the early post-transplant period.
In conclusion, PD reflects a hemodynamic change in acute renal vein occlusion and recanalization in a canine model. Although there are concerns that should be addressed prior to clinical application, PD may be used as a helpful tool for the early detection of acute RVT and the monitoring of renal perfusion. Further studies will be required to investigate PD in subacute or chronic renal vein obstruction.
 XML Download