

 PDF
PDF ePub
ePub Citation
 Print
Print


Dynamic contrast-enhanced magnetic resonance (MR) imaging has emerged as a promising modality for the detection, diagnosis, and staging of breast cancer. MR imaging provides important information not only on the morphology of lesions but also on the functional aspects reflected by the temporal and spatial uptake of contrast medium. Integration of both kinetic and morphological features is important for accurate diagnosis (1, 2). In addition to these roles, the relationship of MR features and prognostic factors of breast cancer recently have been studied. However, these studies showed various results that might be due to variable MR techniques and interpretation criteria (3-11). Moreover, to the best of our knowledge, there has been only one study to correlate the MR features based on the breast imaging and reporting data system (BI-RADS)-MR imaging lexicon (12) with prognostic factors of breast cancer, but the study did not correlate various early phase kinetic parameters (13).
The purpose of this study was to correlate MR features of invasive ductal carcinomas according to the BI-RADS-MR imaging lexicon with prognostic factors including tumor size, axillary lymph node status, histological grade, estrogen receptor (ER), progesterone receptor (PR), p53, c-erbB-2, and Ki-67.
MATERIALS AND METHODS
Patients
Between March 2004 and November 2004, 270 consecutive patients with a histopathologically confirmed invasive ductal carcinoma not otherwise specified (NOS) underwent MR imaging within two weeks prior to surgery. Due to having undergone a previous excisional biopsy, 47 patients were excluded and 29 patients were excluded due to previous neoadjuvant chemotherapy. The remaining 194 patients (age range 29-76 years, mean 47 years) constituted the study group. In patients with multifocal, multicentric carcinoma, the largest lesion was analyzed. The institutional review board of our institution approved the study and informed consent was obtained from all patients.
MR Imaging
MR imaging was performed with a 1.5 T imager (Sonata; Siemens Medical Systems, Erlangen, Germany). The affected side of each patient was examined by using a dedicated double-breast coil, with the patient in a prone position. Dynamic contrast-enhanced images with one precontrast and four post-contrast series were obtained, using a T1-weighted three-dimensional fast low-angle shot (3D-FLASH) sequence with fat suppression in a one-sided sagittal plane (TR 4.9 ms, TE 1.8 ms, flip angle 12°, field of view 170 mm, matrix 224 × 448, time of acquisition 84 seconds, 1.0 mm section thickeness with no gap). A bolus of gadopentetate dimeglumine (Magnevist; Schering, Berlin, Germany) was injected intravenously by hand at a dose of 0.1 mmol per kilogram of body weight within 15 seconds, followed by a 20 mL saline solution flush.
Image Analysis
Post-processing subtraction of the dynamic images was performed for all patients. We obtained two different series of subtracted images for each patient: images obtained before the administration of contrast material were subtracted from the early phase (84 seconds) images obtained after the administration of contrast material, and delayed phase (336 seconds) images were subtracted from the early phase postcontrast images. The first set of the subtracted images showed early enhancement of the lesions, and the second set showed temporal changes in the enhancement pattern between each pair of early and delayed phase images.
Two breast radiologists who were blinded to other information retrospectively analyzed the images by consensus according to the BI-RADS-MR imaging lexicon. Abnormal enhancement was classified as mass or non-mass enhancement. The shape of a mass was described as round, oval, lobulated, or irregular. The margin of a mass was described as smooth, irregular, or spiculated. The internal enhancement pattern of a mass was described as homogeneous, heterogeneous, or rim enhancement. Signal intensities were obtained from the precontrast and each postcontrast series using operator-defined regions of interest (ROI). Measurement was performed in at least three areas within the tumor and the maximally enhancing ROI was selected for analysis. The smallest possible pixel size (four pixels) was used for the ROIs. The parameters of MR kinetics were the enhancement ratio (signal intensity after contrast injection baseline signal intensity/baseline signal intensity ×100%), the peak time, the initial slope (enhancement ratio/peak time), and the type of enhancement curve. The curve shape rather than the absolute value of the enhancement distinguished the type of enhancement curve. The shape of the enhancement curve was described as persistent, plateau, and washout. A persistent curve was continuous enhancement increasing with time. A plateau curve showed maximal signal intensity approximately 2 to 3 minutes after injection, and the signal intensity remained constant at this level. A washout curve showed decreasing signal intensity within 2 to 3 minutes after peak enhancement.
Histopathological Analysis
Histopathological features were analyzed by one pathologist with 20 years of experience in the practice of breast pathology. The tumor size, axillary lymph node status, and histological grade were assessed as classical prognostic factors (14). The Elston-Eillis method of tumor grading was used for histological grading (15), in which a score of 1-3 was assigned for tubule formation, pleomorphism, and mitotic count. The total score could range from 3 to 9, with a total of 3-5 representative of grade 1, a total of 6 or 7 representative of grade 2, and a total of 8 or 9 representative of grade 3.
The expression of ER, PR, c-erbB-2, the p53 tumor suppressor gene, and Ki-67 were assessed as immunohistochemical prognostic factors. A re-cut of the corresponding paraffin block was immunostained with commercially available antibodies to ER (Dako, Glostrup, Denmark), PR (Dako, Glostrup, Denmark), c-erbB-2 (Novocastra, Newcastle, UK), p53 (Dako, Glostrup, Denmark) and Ki-67 (Zymed, San Francisco, CA). The cutoff point for ER and PR positive expression was 10%. Positive expression of p53 was accepted in any case presenting with well-defined nuclear staining. The c-erbB-2 expression was semiquantitatively assessed as follows: 0 for no membranous staining, 1+ for weak uneven membranous staining in some of the tumor cells, 2+ for weak to moderate membranous staining in a large number of tumor cells, and 3+ for distinctive membranous staining in almost all of the tumor cells. The cutoff point for Ki-67 positve expression was 20%.
Statistical Analysis
For univariate analysis, to test whether there was a difference between categorical variables, the Pearson χ2-test for two by two crosstabs and the linear-by-linear association test for more than two variables in ordinal scale were performed. In order to find the most significant and independent relationship, multivariate analyses were performed. Variables found to be significant by univariate analysis were tested in regression models. For dichotomous dependent variables, a binary logistic regression with forward-likelihood-ratio covariate selection method was performed. Logistic regression was applied to analyze the effects of the different MR parameters as follows. Tumor size by grouping 2 cm or less than 2 cm versus more than 2 cm, by grouping the histological grade of grade 1 and grade 2 lesions versus grade 3 lesions, by grouping expression of ER and PR positive versus negative, by grouping the expression of c-erbB-2 with 0, 1+, 2+, versus the 3+ category, by grouping expression of p53 negative versus positive, and by grouping Ki-67 negative versus positive.
A p value less than 0.05 was considered as statistically significant. The statistical analyses were performed with statistical software (SPSS for Microsoft Windows, version 10.0; SPSS, Chicago, IL).
RESULTS
Imaging Analysis
Of the 194 cases of invasive ductal carcinoma NOS, there were 170 (88%) mass lesions and 24 (12%) non-mass enhancement lesions. Of the 170 masses, there were eight (5%) oval shape, 54 (32%) lobulated shape, and 108 (64%) irregular shape lesions. There were 105 (62%) irregular margin, and 65 (38%) spiculated margin lesions. There were 86 (51%) cases of heterogeneous enhancement, and 84 (49%) cases of rim enhancement. Round shape, smooth margin, and homogeneous enhancement were not noted. Of the 194 invasive ductal carcinomas NOS, the curve types were persistent in 13 (7%) lesions, plateau in 98 lesions (51%), and washout in 83 (43%) lesions. A peak time occurring at the first postcontrast phase was seen for 51 (26%) lesions, at the second postcontrast phase was seen for 101 (52%) lesions, at the third postcontrast phase was seen for 29 (15%) lesions, and at the fourth postcontrast phase was seen for 13 (7%) lesions.
Histopathological Analysis
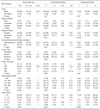
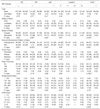
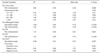
Tumor size ranged from 0.1-6.0 cm (mean 2.2 ± 1.0 cm). The number of axillary lymph node metastasis ranged from 0-29 (mean 1.6). Of the tumors, 60% (117 of 194) had no axillary lymph node metastasis and 29% (55 of 194) had one to three metastatic lymph nodes. Of the tumors, 52% (101 of 194) were assessed as high grade and 48% (93 of 194) were low grade (Table 1). Of the tumors, 63% (123 of 194) were ER positive, 60% (116 of 194) were PR positive, 72% (140 of 194) were p53 positive, and 39% (75 of 194) were Ki-67 positive. In 58% (113 of 194) of the tumors no expression of c-erbB-2 protein was evident, 20% (39 of 194) were 1+, 9% (18 of 194) were 2+, and 12% (24 of 194) were 3+ (Table 2).
Statistical Analysis
By univariate analysis, the shape of the mass was significantly associated with the ER (p = 0.01), and PR expression status (p = 0.02). The margin of mass was significantly associated with the histological grade (p < 0.001), expression of ER (p = 0.02), expression of PR (p = 0.007), and Ki-67 status (p < 0.001). The internal enhancement pattern was significantly associated with tumor size (p = 0.009), histological grade (p < 0.001), expression of ER (p = 0.001), expression of PR (p < 0.001) and Ki-67 status (p = 0.001). The curve type was significantly associated with tumor size (p = 0.02), histological grade (p < 0.001) and Ki-67 status (p < 0.001). Of the parameters of the initial phase, peak time was significantly associated with the histological grade (p = 0.02) and Ki-67 status (p < 0.001). The enhancement ratio was significantly associated with tumor size (p = 0.005). The initial slope was significantly associated with the histological grade (p = 0.006), and Ki-67 status (p = 0.003). A correlation was not found between MR features with lymph node status, p53 status and c-erbB-2 status (Tables 1, 2).
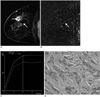
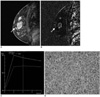
Parameters found to be significant by univariate analysis were selected for logistic regression analysis. The internal enhancement pattern of mass, curve type, and enhancement ratio entered into the regression model of tumor size. The margin, internal enhancement pattern of mass, curve type, peak time, and initial slope entered into the regression model of histological grade. The shape, margin, and internal enhancement pattern of mass entered into the regression model of ER and PR status respectively. The margin, internal enhancement pattern of mass, curve type, peak time, and initial slope entered into the regression model of Ki-67 status. By multivariate analysis, spiculated margin was a significant, independent predictor of a lower histological grade (p < 0.001), and lower expression of Ki-67 (p = 0.007) (Fig. 1). Rim enhancement was a significant, independent predictor of a higher histological grade (p < 0.001), negative expression of ER (p = 0.001), negative expression of PR (p < 0.001) (Fig. 2), and a larger tumor size (p = 0.006). A washout curve may predict higher a Ki-67 status (p = 0.05). An enhancement ratio more than 200% may predict a larger tumor size (p = 0.05) (Table 3).
DISCUSSION
In this study, a spiculated margin of breast cancer on high spatial resolution dynamic MR was able to predict a lower histological grade and lower Ki-67 status. This result was consistent with previous studies. It is well-known that high grade breast cancers show circumscribed margins because of their high cellularity and rich hyaluronic acid extracelluar matrix and inflammatory host reaction, whereas low grade cancers show a spiculated margin because of their low cellularity, rich collagen matrix and desmoplastic host reaction (16, 17). However, this finding differed from that reported by szabó et al. (4) who found that there was no correlation between the margin of a breast cancer and prognostic factors. This difference might be due to the different resolution of the MR imaging. Spatial resolution in this study (0.29 mm2 pixel size, 1 mm thickness, and unilateral sagittal scan) was higher than in the szabó et al. study (3.6 mm2 pixel size, 2.2 mm thickeness, bilateral axial scan). A high resolution image is necessary for an accurate analysis of the margin.
Another important result of this study was that rim enhancement was a significant, independent predictor of a higher histological grade (p < 0.001), negative expression of ER (p = 0.001), negative expression of PR (p < 0.001), and a larger tumor size (p = 0.006). The mechanism of rim enhancement of breast cancer as seen on MR imaging can be explained by high angiogenesis in the periphery of the tumor, central necrosis, and central desmoplasia (6, 18-20). There have been several studies showing a correlation between rim enhancement and a higher histological grade, negative expression of ER, higher expression of Ki-67, lymph node status (4-6, 13), and the percentage of cells in DNA-S phase, a measure of cellular proliferative activity (21). Although Mussurakis et al. (3) reported that there was no correlation between rim enhancement and histopathological prognostic factors, results of this study suggest that there is a correlation between rim enhancement and poor prognostic factors.
The parameters of the initial enhancement phase (2 to 3 minutes after contrast injection or when the curve starts to change) had a role in the differentiation of benign and malignant tumors of the breast. Faster and stronger enhancement suggests a malignant lesion. However, there has been a considerable overlap between benign and malignant tumors in the initial enhancement parameters (22). The parameter of delayed enhancement phase determines the type of enhancement curve. In general, benign lesions show a persistent curve and malignant lesions show a washout curve, and a plateau curve can be seen in both benign and malignant lesions (1, 2). Controversies exist for the relationship between kinetic parameters and prognostic factors. There have been several reports about the significant correlation between the enhancement ratio and the axillary lymph node status or histological grade (7, 8) or high cellular proliferation (8). There have been reports about a significant correlation between washout and higher tumor grade (4, 8) or a higher histological grade, positive Ki-67 (4, 6, 13), and negative ER status (4). Tuncbilek et al. (11) also reported that parameters of the initial enhancement phase were correlated with grade. However, Stomper et al. (9) reported that time-intensity curves showed no significant correlation with pathological size, nodal status, or the hormone receptor status of an invasive carcinoma. Fischer et al. (10) reported that there was no correlation between the enhancement ratio and the histological type of carcinoma, grade, and lymph node status. Among these kinetic parameters, our study demonstrated that the washout curve was a significant, independent predictor of Ki-67 positive expression, suggesting higher proliferative activity and that most of parameters of initial enhancement phase could not reflect prognostic factors.
This study has some limitations. First, we did not follow patients. To draw a prognostic significance from our analysis, follow-up of patients and multifactorial survival analysis are required. Second, MR images were interpreted by two observers in consensus, so interobserver variability could not be determined.
There are some differences in this study from previous studies. First, our study included only patients with invasive ductal carcinoma NOS. Thus, we excluded bias from the histopathological variability. Second, highly spatial and temporal resolution images were obtained using a 1.5 T dynamic 3D MR instrument, allowing the morphologic and kinetic features of breast cancers to be meticulously analyzed. Finally, we used the BI-RADS-MR imaging lexicon enabling a standardized communication.
In conclusion, of the BI-RADS-MR features, a spiculated margin may predict a favorable prognosis, whereas rim enhancement and washout may predict an unfavorable prognosis of breast cancer. These MR features can be used to select subgroups of breast cancers with different biological behavior.
 XML Download