

 PDF
PDF ePub
ePub Citation
 Print
Print


Balloon-occluded retrograde transvenous obliteration (BRTO) is now increasingly accepted as an effective treatment for gastric varix, and it is indicated for those gastric varices with a major portosystemic shunt such as a gastrorenal shunt or a shunt involving the left inferior phrenic vein (1-10). BRTO has achieved an initial high rate of success (87-100%) and a low rate of relapse (0-10%) (5, 9, 11-13) because the sclerosant is injected directly into the gastric varix through a draining vein, while at the same time, the variceal blood flow is stopped by retrograde balloon occlusion.
Balloon-occluded retrograde transvenous obliteration has two main effects on the portal hemodynamics due to its obliteration of the major portosystemic shunt (i.e., gastrorenal shunt); it increases the portal hepatic blood flow and elevates the portal venous pressure (14-16). It is known that increasing the portal hepatic blood flow after BRTO can improve liver function, indicating that BRTO can be performed in patients with severe liver dysfunction (15-17). On the other hand, elevation of portal venous pressure after performing BRTO implies that BRTO can aggravate a variety of portal hypertensive changes, including ascites, splenomegaly, the development of portosystemic collaterals and edema of the gall bladder (GB) or the intestinal wall. It has been well established that BRTO induces delayed or late worsening of esophageal varices (8, 10, 11); however, the effects of BRTO on the other portal hypertensive changes have not been established.
Thus, we aimed to evaluate the short-term effects of BRTO, which was performed to treat gastric variceal bleeding, on the portal hypertensive changes. This was done by comparing the CT scans that were obtained just before and after the BRTO procedures.
MATERIALS AND METHODS
Subjects
Between December 2002 and November 2005, a total of 54 patients suffering with liver cirrhosis and portal hypertension underwent BRTO procedures at our institution to treat their bleeding from gastric varices. This study intended to evaluate the short-term effects of BRTO on portal hypertensive changes; therefore, we excluded 24 patients who did not undergo CT scanning immediately prior to BRTO, and for whom the presence of a gastrorenal shunt had been already confirmed by previous CT scanning. We also excluded one patient for whom BRTO failed to completely eradicate the gastric varix. In addition, we excluded two patients who had a factor that could have potentially interfered with our analysis of the effects of BRTO on portal hypertensive changes (a partial portal vein thrombosis that existed before the procedure in one patient and the other patient had previously undergone transjugular intrahepatic portosystemic shunt). 27 patients were finally enrolled in the study. Institutional review board approval was obtained for the required retrospective review of the patients' records, but informed patient consent was not required for this retrospective analysis.
There were 18 men and nine women (age range: 32 to 83 years, mean age: 56.3 years). BRTO was electively performed in 19 patients following initial hemostasis for gastric variceal bleeding and BRTO was performed on an emergency basis in eight patients because of persistent active bleeding or rebleeding after initial hemostasis. The mean systolic blood pressure at the time of arrival to our hospital was 113 mmHg (range: 60-164 mmHg). The lowest systolic blood pressure and hemoglobin level around the time of the pre-procedural CT scans ranged from 54 to 127 mmHg (mean: 86 mmHg) and from 2.9 to 11.3 g/dL (mean: 7.6 g/dL), respectively. Transfusion of red blood cells was required in 23 patients to maintain their hemodynamic parameters such as the blood pressure, pulse rate and hemoglobin levels. The endoscopically defined gastric varix locations were the cardiofundal region in 14 patients, the fundal region in 12 and the cardiac region in one. Gastric varices were associated with portal hypertension as a result of viral liver cirrhosis in 22 patients, alcoholic liver cirrhosis in four and liver cirrhosis of an unknown cause in one. Six patients were of Child-Pugh class A, 14 were of class B and seven were of class C. Four patients had a history of previous cholecystectomy. Ten patients had complicating hepatocellular carcinoma with no tumor thrombosis in the portal vein.
BRTO Procedures
A written informed consent for the procedures was obtained from all the patients or their responsible family members. The pre-procedural CT scans were obtained from three to 99 hours (mean: 41 hours, median: 36 hours) prior to BRTO, and these confirmed the presence of a gastrorenal shunt. BRTO was performed as previously described (5, 6, 18). Briefly, a 7-9 Fr balloon catheter with an 8.5-33 mm occlusion balloon (Boston Scientific, Watertown, MA) was inserted in the gastrorenal shunt through the right femoral vein (n = 26) or the internal jugular vein (n = 1) under local anesthesia. After inflating the balloon to stop the gastrorenal shunt blood flow, retrograde venography was performed to identify the gastric varices and their feeding and draining vessels. In 19 patients, microcoils, gelfoam or both were used to embolize other blood-draining collaterals of the gastric varices, such as the inferior phrenic and/or retroperitoneal veins. A mixture of 5% ethanolamine oleate (Keuk Dong Pharmaceuticals, Incheon, Korea) with contrast medium (Ultravist 300, Schering AG, Berlin, Germany) or lipiodol (Laboratories Guerbet, Aulnay-sous-Bois, France) (ratio = 4-5:1) was injected slowly and intermittently under fluoroscopic control until a small amount of reflux into the feeding vessels was observed following varix opacification. The volume of the injected mixture ranged from 12 to 50 ml (mean: 30.7 ml). The balloon catheter was left in the gastrorenal shunt for 3-29 hours at the discretion of the treating interventional radiologist; this decision was based on the shunt size, the timing of the procedure and the platelet count. The balloon catheters were removed after checking for the formation of stable thrombus via fluoroscopy. Haptoglobin was not administered during the procedure because this agent was not available on our domestic market. For all the patients, complete obliteration of their gastric varices with thrombus formation was confirmed on the post-procedural CT scans; these were obtained within five to 150 hours postoperatively (mean: 58 hours, median: 51 hours). The interval between the pre- and post-procedural CT scans ranged from 44 hours to 186 hours (mean: 99 hours, median: 86 hours).
CT Imaging and Analysis
The CT examinations were performed using one of four randomly selected CT scanners (Brilliance 40, Philips, Eindhoven, Netherlands; LightSpeed QX/I, Lightspeed 16 or Lightspeed Ultra, GE Healthcare, Milwaukee, WI). The helical CT images were obtained in a craniocaudal direction from the top of the liver to the level of the lower pole of the right kidney, with using a 2.5-mm to 5-mm reconstruction interval and a 5-mm slice thickness. A total of 120-mL of nonionic contrast material (Ultravist 300, Schering AG, Berlin, Germany) was administered at a rate of 3 mL/sec with using an automated power injector. The images were obtained 30, 60 and 180 sec after initiating intravenous injection of contrast medium; these images represented the hepatic arterial, portal venous and equilibrium phases, respectively. The images taken during the equilibrium phase were extended to the level of the pelvis in the patients who had a spleen that extended below the lower kidney pole. The images taken before contrast medium injection were routinely available among the post-procedural CT scans.
The pre- and post-procedural CT scans were retrospectively compared by two radiologists working in consensus with respect to the short-term effects of BRTO on the following portal hypertensive changes; ascites, splenomegaly, portosystemic collaterals other than the gastrorenal shunt, GB edema and intestinal wall edema. In addition, the follow-up CT scans obtained at least one month after BRTO, if they were available, were also compared to determine the serial changes of these evaluated points.
For objective comparisons of ascites, the ascites' thicknesses at eight points were measured and scored. The bilateral ascites thicknesses were measured horizontally at the mid antero-posterior portion to the abdominal wall on the four axial CT image planes: the dome of the liver at the level of the junction between the right hepatic vein and the inferior vena cava, the middle of the liver at the level of the portal bifurcation, the bottom of the liver and the lower pole of the right kidney. The ascites' thicknesses at every point were scored from zero to 3 based on the value that was measured as 0: no ascites, 1: ascites < 2.5 cm in the distance, 2: ascites between 2.5 and 5 cm, 3: ascites > 5 cm) and then the scores were summed up. If a difference in the total ascites score was found between the pre- and post-procedural CT scans, then the ascites was regarded as either aggravated or improved.
The spleen volumes were calculated by the sum-of-areas method (19, 20). At a workstation, the outline of the spleen on each section of the axial CT scan was traced and we computed the area that was enclosed. The splenic volume in each section was obtained by multiplying the area by the section thickness, and all the sections were summed to determine the total splenic volume. The uncertainty of the assigned volumes with using this method was reported to be 3.6±4.5% (19); therefore, volume changes > 15% (greater than 2 standard deviations) after BRTO were considered to indicate real increases or decreases (21).
The presence of portosystemic collaterals other than the gastrorenal shunt was evaluated in four locations, including the gastroesophageal, paraumbilical, mesenteric and retroperitoneal locations (22, 23). We considered that there was the development of alternative collaterals when a new collateral vessel ≥ 3 mm in the diameter was detected, and there was worsening of alternate collaterals when the diameter of an existing collateral vessel was enlarged ≥ 2 mm. No evaluation of esophageal varix was included in this study because our routine CT scans covered only a limited part of the distal esophagus and we considered endoscopy as the optimal method of evaluation for esophageal varix.
GB edema was defined as diffuse wall thickening (≥ 4 mm) (24, 25). The maximum GB wall thicknesses were measured, and aggravation or improvement was considered to have happened when a change of ≥ 2 mm was noted in the wall thickness between the pre- and post-procedural CT scans.
Intestinal wall edema was considered present when there was diffuse wall thickening (> 6 mm in the colon, > 3 mm in the small bowel) (26, 27). Because the CT images did not include the pelvis, the anatomic distribution of the bowel was divided into four segments: small bowel and the ascending, transverse and descending colon. The number of edematous bowel segments was recorded (no segment to 4 segments). Intestinal wall edema aggravation/improvement was defined as a change in the number of edematous bowel segments on the pre- and post-procedural CT scans.
Laboratory findings such as serum albumin levels, red blood cell (RBC), and platelet counts, which were checked on the days of the pre- and post-procedural CT scans, were also compared to reveal the association between other factors such as hypoalbuminemia and the portal hypertensive changes and to determine whether there was any difference in the splenic function between the patients with and those without splenic enlargement after BRTO.
The Wilcoxon signed ranks test was used to analyze changes in the amounts of ascites, and the paired t-test was used to analyze the changes in the splenic volumes, the GB wall thicknesses and the number of edematous bowel segments before and after BRTO. The Kruskal-Wallis test was used to analyze the association between the changes in the serum albumin levels and the portal hypertensive changes before and after BRTO. The Mann-Whitney test was used to analyze the difference in the changes of the RBC and platelet counts between the patients with and those without splenic enlargement after BRTO. All the statistical analyses were performed with using a commercially available software package (SPSS version 11.5; SPSS, Chicago, IL).
RESULTS
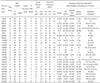
The detailed CT comparative results of the portal hypertensive changes observed in the 27 patients are presented in Table 1. Follow-up CT scans were available in 19 of 27 patients, and their comparative results are also presented in Table 1. The time of follow-up CT examinations ranged from one to 17 months after BRTO, with a mean of 3.9 months (median: 2 months).
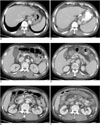
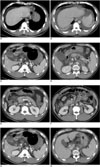
With regard to ascites, the total ascites scores on pre- and post-procedural CT scans ranged from 0 to 14 (median score: 0) and from 0 to 15 (median score: 5), respectively. Ascites developed or it was aggravated in 22 of 27 patients (82%), this was improved in two (7%), and unchanged in 1 (4%) following BRTO (Figs. 1, 2). No development of ascites after BRTO was observed in the other two patients (7%). Thus, there was significant aggravation or the development of ascites after BRTO (p = 0.001). For two patients who displayed improvement of their ascites after BRTO, the serum albumin level was elevated from 2.9 g/dL to 3.7 g/dL in one patient and it was reduced from 2.1 g/dL to 2.0 g/dL in the other. Follow-up CT scans were available for 17 of the 25 patients who had ascites noted on the post-procedural CT scans; on these scans, the ascites disappeared or was improved in 14 patients (82%), it was aggravated in two (12%), and it was unchanged in one (6%). The other two patients had no ascites on both the post-procedural and follow-up CT scans.
The pre-procedural spleen volumes ranged from 119 cm3 to 1,290 cm3 with a median volume of 438.2 cm3, and the post-procedural spleen volumes ranged from 151 cm3 to 1,306 cm3 with a median volume of 580.8 cm3. The median change of the spleen volume was 21% with a range of -11% to 120%. Based on a volume cut-off of 15%, the spleens were enlarged in 15 of the 27 patients (56%) after BRTO. Thus, the spleens were found to be significantly enlarged after BRTO (p < 0.001) (Fig. 2). The mean values ± standard deviations of the RBC and platelet counts were 3.04±0.67×10⁶/µl and 79.00±49.63×10³/µl before BRTO, respectively, and 3.33±0.43×10⁶/µl and 57.8±29.13×10³/µl after BRTO, respectively. There were no statistical differences in the changes of the RBC and platelet counts between the patients with and those without splenic enlargement after BRTO (p = 0.329 for the RBC count, p = 0.283 for the platelet count). The follow-up CT scans were available for 11 of the 15 patients with splenic enlargement after BRTO; this splenic enlargement was static in eight (73%) of the 11 patients, but the volume of the spleen returned to the baseline in the other three patients. Eight of the other 12 patients with no splenic enlargement after BRTO underwent follow-up CT scans; new splenic enlargement was observed on the scans of one patient.
The portosystemic collateral veins found on the pre-procedural CT, other than a gastrorenal shunt, were coronary (n = 6), umbilical (n = 4), or both (n = 3), and none of them were enlarged (≥ 2 mm in diameter) on the post-procedural CT scans. No development of new collateral veins (≥ 3 mm in diameter) was observed on the post-procedural CT scans. Coronary veins acting as feeder veins, which were confirmed by obliteration of the veins on post-procedural CT scans, were not viewed as the other portosystemic collateral veins. On the follow-up CT scans of 19 patients, six (32%) patients had developed new collateral veins or there was worsening of the existing collateral veins (development of the umbilical vein in two patients and worsening of the existing coronary or umbilical veins in the other 4 patients).
The GB wall thicknesses observed on the pre- and post-procedural CT scans ranged equally from 2 to 10 mm with a median wall thickness of 3 mm (p = 0.418). GB edema developed or was aggravated in four of 23 patients (Fig. 1) and this disappeared or was improved in five patients after BRTO (Fig. 2). The GB wall thickness was unchanged in 14 (61%) of 23 patients. The follow-up CT scans were available for five of the 10 patients with GB edema seen on the post-procedural CT scans; on these follow-up scans, the GB edema disappeared in two patients, it was unchanged in two and it was aggravated in one. Ten of the other 13 patients with no GB edema seen on the post-procedural CT had follow-up CT scans, on which GB edema had developed in one patient. The other four patients with follow-up CT scans had all undergone previous cholecystectomy.
As for the intestinal wall edema, the number of edematous bowel segments on the pre- and post-procedural CT scans ranged equally from zero to 4, but with medians of 0 and 1, respectively. However, no statistical difference was found in terms of the number of edematous bowel segments (p = 0.284). Intestinal wall edema developed or was aggravated in nine of the 27 patients (33%) (Fig. 1) and this disappeared or was improved in five patients (19%) after BRTO (Fig. 2). No change in the number of edematous bowel segments was observed in 13 patients (48%). Follow-up CT scans were available for eight of the 15 patients with intestinal wall edema seen on the post-procedural CT scans, on which the intestinal wall edema disappeared in seven patients and it was unchanged in one. Eleven of the other 12 patients with no intestinal wall edema on the post-procedural CT had follow-up CT scans done, on which intestinal wall edema developed in two patients.
Aggravation of the four portal hypertensive changes, including ascites, splenic enlargement and edemas of the intestine and GB, was found in three of the 27 patients after BRTO; one to three of these four portal hypertensive changes developed or was aggravated in 13 of 27 patients after BRTO and none of them was changed in two patients. For other eight patients, some of the portal hypertensive changes were aggravated, but the others were ameliorated after BRTO. In one patient (patient 15), improvement of ascites, GB edema and intestinal wall edema was observed after BRTO.
The mean values ± standard deviations of the serum albumin levels before and after BRTO were 2.72±0.51 g/dL (range, 1.9-3.8 g/dL) and 2.75±0.45 g/dL (range, 2.0-3.7 g/dL), respectively. There was no significant association between the changes of the serum albumin levels and the changes of the ascites (p = 0.502), splenomegaly (p = 0.642), GB edema (p = 0.449), and intestinal wall edema (p = 0.152) before and after BRTO.
DISCUSSION
The risk of aggravating the portal hypertensive changes by performing BRTO has been raised as a major concern because this procedure requires obliteration of a gastrorenal shunt that acts to reduce portal hypertension (16, 28). Many previous studies concerned with the effects of BRTO on esophageal varices have demonstrated that it worsens or develops esophageal varices (8, 10, 11). Thus, it is important to reveal the effects of BRTO on other portal hypertensive changes.
CT scans are of considerable value for detecting a variety of portal hypertensive changes, including ascites, splenomegaly, the development of deep portosystemic collaterals, and GB or intestinal wall edemas. In addition, the CT scans before and after BRTO should be routinely obtained to evaluate whether or not there is a gastrorenal shunt through which gastric varix obliteration can be performed, and also to assess the therapeutic results of BRTO. Thus, we evaluated whether BRTO aggravates a variety of portal hypertensive changes by comparing CT scans. Only the cases with CT scans obtained within one week before and after BRTO were included in this study in order to minimize the effects of other factors, such as the deterioration of liver cirrhosis.
In terms of the concern that BRTO could aggravate ascites, a small number of studies have reported a very low incidence of developing ascites, i.e., ascites occurred in 0-10% of the patients after BRTO, but these studies did not describe how and when they evaluated this ascites (8, 9, 13, 29). Yet in the present study, ascites developed or was aggravated in 82% (22 of 27 patients) after BRTO, and this was statistically significant (p = 0.001). Although direct comparison of results is impossible due to the lack of information from the previous studies, this discrepancy may be greatly attributed to the timing for evaluating the ascites. According to the previous studies on portal hemodynamics (14-16), the portal venous pressure is significantly elevated immediately after BRTO and the elevated portal venous pressure gradually decreases to baseline in four weeks after BRTO. Because the timing of the post-procedural CT scans to assess the therapeutic effects of BRTO has not been standardized, the timing to evaluate ascites is quite different between institutions, with a range of 24 hours to four weeks after BRTO. Based on our results, where the ascites was evaluated on the post-procedural CT scans obtained within one week after BRTO, we believe that BRTO can induce aggravation or the development of ascites in the short term.
On the other hand, improvement of ascites after BRTO was observed in two patients in the present study. Fukuda et al. (30) reported two cases of refractory ascites that were ameliorated after BRTO and they suggested that two different outcomes (in relation to ascites) could be expected after BRTO; these were aggravation of the ascites induced by portal hypertension and the amelioration of ascites due to elevated serum albumin levels. Still, the mechanism by which BRTO influences ascites seems to be more complex because the serum albumin level was reduced from 2.1 g/dL to 2.0 g/dL after BRTO in one of our two patients who showed improvement of ascites.
It is interesting that BRTO also seems to be able to induce splenic enlargement in a short time. In the present study, splenic enlargement ≥ 15% was observed in 56% of the patients (15 of the 27 patients) after BRTO. The median volumes of the spleens before and after BRTO were 438.2 cm3 and 580.8 cm3, respectively, with a median change of 21%, which was significant (p < 0.001). Sixteen patients had splenomegaly before BRTO, when a splenic volume of greater than 314.5 cm3 was used to indicate splenomegaly as in previous studies (31, 32), and in eight of these 16 patients, the spleen was enlarged after BRTO. Because destruction of the blood cells is one of the major functions of the spleen (33), we evaluated the difference in the splenic function between the patients with and those without splenic enlargement after BRTO by comparing the RBC and platelet counts before and after BRTO. We did not find a significant difference in the changes of the RBC and platelet counts between the two groups, which may suggest no association between splenic enlargement after BRTO and the alteration of splenic function. We presume that the splenic enlargement in a short time was mainly attributable to splenic congestion secondary to portal hypertension, but there was no objective evidence for this.
BRTO does not seem to induce significant aggravation or development of GB and intestinal wall edemas. In this study, development or aggravation of GB edema after BRTO was found in four (17%) of 23 patients, and development or aggravation of intestinal wall edema was found in nine (33%) of 27 patients. However, most commonly, there was no new development or change of GB and intestinal wall edemas after BRTO (GB edema: 61%, 14 of 23 patients, intestinal wall edema: 48%, 13 of 27 patients). No statistical differences were observed in the GB wall thickness or in the number of edematous bowel segments before and after BRTO.
In addition to portal hypertension, hypoalbuminemia and ischemia due to hemodynamic instability can be associated with the short term development or aggravation of ascites, GB edema and intestinal wall edema (24-27, 34-36). Conversely, resolution or improvement of such conditions may counteract the effects of BRTO on those portal hypertensive changes. We have revealed no significant association between the changes of the serum albumin levels and the changes of ascites, GB edema and intestinal wall edema before and after BRTO. However, this is a retrospective study, and it cannot evaluate whether or not ischemia due to hemodynamic instability is associated with those portal hypertensive changes. This requires comparison with the CT scans obtained just before variceal bleeding, but this is very difficult in practice. Also, indirect comparison of such hemodynamic parameters as blood pressures, pulse rates and hemoglobin levels is difficult in practice because those values are frequently measured in the patients with variceal bleeding and CT scans following variceal bleeding are obtained with correction for those values.
It is thought that the susceptibility of each organ to the portal hypertension aggravated by BRTO should also be considered because some portal hypertensive changes were aggravated, but others were not in 13 of the 27 patients. On the other hand, some portal hypertensive changes were aggravated, but others were ameliorated in eight patients after BRTO. Unfortunately, we cannot explain these discordant results because this study was simply designed to compare the CT findings before and after BRTO.
As was expected, there was no development of new collateral veins (≥ 3 mm in the diameter) or enlargement of the preexisting collaterals (≥ 2 mm in the diameter) other than the gastrorenal shunts. According to previous studies, the development or worsening of collaterals to the esophageal varices usually occurs one month after BRTO or even later (8, 11).
Miyamoto et al. claimed that the elevated portal venous pressure immediately after BRTO returns to baseline in four weeks as alternate collaterals develop (15). Those results can imply that effects of BRTO for elevating the portal venous pressure would be attenuated with time and this mostly disappears in four weeks. At the CT follow-up (range: 1-17 months, median: 2 months) of our 19 patients, six (32%) patients had developed new collateral veins or there was worsening of the existing collateral veins (development of a umbilical vein in two and worsening of the existing coronary or umbilical veins in the other 4). At CT follow-ups of this study, some portal hypertensive changes, including ascites and intestinal wall edema, were improved or completely resolved in most patients (ascites: 82%, 14 of 17 patients; intestinal wall edema: 88%, 7 of 8 patients), whereas splenic enlargement persisted in most patients (73%, 8 of 11 patients). However, this tendency should be validated in a larger series because follow-up CT scans were not available for all the patients of this study.
The present study has some drawbacks. First, the pre- and post-procedural CT scans should be obtained at fixed times to accurately evaluate the effects of BRTO on portal hypertensive changes, but due to the retrospective nature of this study, the interval between the pre- and post-procedural CT scans was not fixed. Second, this study did not evaluate changes of the clinical signs and symptoms associated with the portal hypertensive changes after BRTO. Yet it would seem important to evaluate whether these portal hypertensive changes after BRTO can cause clinically significant signs and symptoms.
In conclusion, our findings indicate that some portal hypertensive changes, including ascites and splenomegaly, can be aggravated shortly after BRTO, but the mechanisms involved in this remain a bit obscure.
 XML Download