

 PDF
PDF ePub
ePub Citation
 Print
Print


Severe acute respiratory syndrome (SARS) is an infectious disease with high infectivity and fatality rates caused by the respiratory SARS-associated coronavirus (1-3). It was first reported in the Guangdong Province in southern China in November 2002, followed by an outbreak in Hong Kong in early March 2003 (1-3). Due to extensive business ties with Hong Kong and mainland China, there were sporadic probable cases of SARS in Taiwan from mid-March to 21 April 2003. An outbreak of SARS occurred in one of the hospitals in Taipei on 22 April 2003 (4). Subsequently, the disease rapidly spread throughout the island, and was primarily associated with hospital settings.
The epidemiologic, clinical, laboratory and imaging features of SARS have been reported (5-9). On chest radiographs or CT, SARS typically manifests as unilateral or bilateral peripheral air-space disease with rapid progression (10-15). A small percentage of patients have evidence of fibrosis-like patterns on follow-up CT scans and radiographs after hospital discharge (16). A number of reports have described the clinical prognostic factors of SARS (17-28) and the relationship between the imaging findings and clinical outcomes or laboratory parameters (10, 29-37).
It has been reported that bilateral and diffuse confluent air-space opacities almost exclusively occurred in subjects with a poor clinical outcome or in those who had a more protracted clinical course (10, 14). Patients with multifocal opacities that progressed to diffuse air-space opacification and patients presenting with diffuse air-space opacification had a high fatality rate, but patients in this group were also older and more likely to have comorbid diseases (31). A recent study disclosed that a maximal SARS-related lesion on radiographs with a score of 7 or higher is a strong predictor of mortality, especially in patients with comorbid lung illnesses and involvement of four or more lung zones (38). The aim of this study was to quantify the severity of lung lesions on chest radiographs in patients with SARS and to analyze the relationship between the quantified abnormalities of lung lesions and the clinical course and laboratory parameters.
MATERIALS AND METHODS
During the epidemic period of SARS from March to July 2003 in Taiwan, 28 patients with probable cases of SARS were treated in our hospital. The 28 subjects include four males and 24 females with ages ranging from 13 to 87 years (mean ± SD = 40.78 ± 18.02). Two patients were less than 15 years old, 20 patients were 18 to 49 years old, three patients were 50 to 59 years old, and three patients were older than 60 years. All subjects experienced fevers exceeding 38℃ (100.4°F) and fulfilled the WHO criteria for probable SARS (9). All 28 patients were subsequently shown to have significant seroconversion of the SARS-associated coronavirus (SARS-CoV) antibody indicating arecent infection by the coronavirus. In addition to having a respiratory illness of unknown cause, during the 10 days prior to onset of symptoms, 12 patients had either lived in an area in which community transmission of SARS was documented, eight patients had traveled to such an area, and eight patients had come into close contact with a person known to have SARS. The institutional review board of our hospital approved the study, and informed consent was not required from the patients.
In total, 481 chest radiographs were obtained for the 28 patients to monitor the disease process. The chest radiographs included 379 in the anteroposterior view, 94 in the posteroanterior view, and eight in the lateral view. The studies were obtained using either conventional radiography (274 examinations, AMX-4, General Electric Medical Systems, Milwaukee, WI) or computed radiography (187 studies, Fuji Medical Systems, Tokyo, Japan) with images archived through a picture archiving and communications system (PACS, Centricity Workstation, version 1.0, General Electric Medical Systems). Hard-copy images from both the conventional and computed radiographies were viewed for all reports. The settings for portable radiography were 72-80 kVp at 1.25-1.5 mAs. The number of radiographs obtained for each patient ranged from 4 to 50 (mean ± SD = 17.18 ± 9.84). The hospitalized days ranged from 11 to 29 with a mean of 18.17 days; thus, an average of approximately one radiograph was obtained each day for each patient, particularly during the critical period. The frequency of radiography decreased as patient symptoms abated.
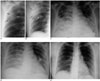
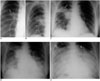
Two radiologists who had 15 and 26 years of professional experience, respectively, reviewed the radiographs together. The radiographic findings were recorded without the knowledge of the clinical data but with the knowledge that the patients were victims of suspicious or probable cases of SARS. Any differences in opinion were resolved by consensus. On each radiograph, each lung was divided into upper, middle and lower lung zones transversely, with each zone spanning one-third of the craniocaudal length of the lung. The severity of the SARS-related lesions within each lung zone was evaluated by scoring the radiographs with a four-point scale based on visual assessment, as follows: 0 = normal, 1 = up to one-third of lung zone involved, 2 = between one-third and two-thirds of lung zone involved, and 3 = more than two-thirds of lung zone involved. The scores for all 6 zones on each radiograph were added to provide a cumulative score that had a range from zero to 18 (Figs. 1, 2). In addition, data collected from all available chest radiographs included the following: whether the SARS-related lesions were unilateral or bilateral; were associated with radiographically identifiable pleural effusion (defined as increased pleural density with obscuration of the costophrenic sinuses and the hemidiaphragm with meniscus-shaped or horizontal upper border); mediastinal or hilar lymphadenopathy (defined as widening or increased opacity of the mediastinum and pulmonary hila); cavitary lung lesions. The mean radiographic score for each patient during hospitalization was obtained by summation of the radiographic score on each radiograph divided by the total number of radiograph obtained. The maximal radiographic score for each patient represented the worst condition of lung opacities during the clinical course.
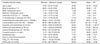
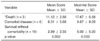
For each patient, we retrospectively recorded the age, severity of fever (degree of elevated body temperature above 38℃ or 100.4°F), leukocyte count, decreased percentage (< 20%) of lymphocytes in the leukocyte count, lymphopenia (absolute lymphocyte count < 1,000/mm3), thrombocytopenia (platelet count < 15,000/mm3), elevated levels of aspartate aminotransferase (AST), alanine aminotransferase (ALT), lactate dehydrogenase (LDH), creatine kinase (CK), C-reactive protein (CRP), the number of hospitalized days, the duration of endotracheal intubation, the severity of hypoxemia (PaO2), the level of retained CO2 in arterial blood (PaCO2), death, and the presence of comorbid disease. The patient status, mean value of the body temperature and laboratory data during hospitalization were analyzed if the data statistically correlated with the mean and maximal radiographic scores. The normal values, range, median, mean and standard deviation of each variable are shown in Table 1. Seven of our 28 patients had associated comorbid diseases; these include two cases of malignancy including one associated with hypertension, and one case each of hypertension, chronic lung disease, valvular heart disease, thalassemia and diabetes mellitus associated with hypothyroidism. Three of 28 patients expired due to SARS: these included two women without comorbidity, aged 47 and 72 years, and one 41-year-old woman with diabetes mellitus. The onset of illness was based on the clinical manifestation of fever or body temperature above 38℃.
A correlation among continuous variables including the clinical parameters and radiographic scores was assessed with the Pearson correlation coefficient. A forward stepwise multiple linear regression analysis was performed for all variables with a p-value less than < 0.1 in an univariate analyses. The Kruskal Wallis test was used to analyze whether the radiographic scores were related to the categorical variables including death, survival without comorbidity, and survival with comorbidity. Post hoc comparison using the Bonferroni-corrected Mann-Whitney U tests was performed for further analysis of the categorical variables. A p-value less than 0.05 was considered statistically significant.
RESULTS
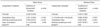
No mediastinal abnormality, pleural effusion and cavitation in the parenchymal lesion were observed on the chest radiographs. By univariate analysis, both the mean and maximal radiographic scores significantly correlated with fever, age, elevated white blood cell count, a decreased percentage (< 20%) of lymphocytes in the leukocyte count, lymphopenia, elevated LDH, the number of hospitalized days, the number of days of endotracheal intubation, and the level of retained arterial CO2 (Table 2). In addition, the maximal radiographic score also correlated with the severity of hypoxemia (p = 0.050) (Table 2).
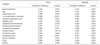
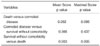
Using the Kruskal Wallis test, the mean as well as maximal radiographic scores significantly correlated with death and the presence of comorbid disease. The mean radiographic score of the patients who died, patients with comorbidities and without comorbidity were 11.12 ± 2.56 (mean ± SD) and 6.31 ± 5.69 and 2.89 ± 2.55, respectively (p = 0.032). The corresponding values for the maximal radiographic score were 17.67 ± 0.58, 9.67 ± 8.09 and 6.00 ± 5.00, respectively (p = 0.033) (Table 3). A multiple comparison by the Bonferroni-corrected Mann-Whitney U test revealed that there was a significantly difference between the number of deaths and survival without comorbidity with respect to the mean as well as maximal radiographic score (p = 0.003 and p = 0.005, respectively) (Table 4).
A forward stepwise multiple linear regression showed that the mean radiographic score correlated most significantly with the number of hospitalized days (p < 0.001), while the second most significant factor was the absolute lymphocyte count (p < 0.001) and the third most significant factor was the number of days of intubation (p = 0.025). The maximal radiographic score correlated best with the percentage of lymphocytes in the leukocyte count (p < 0.001). The second most significant factor was the number of hospitalized days (p < 0.001), and the third most significant factor was the absolute lymphocyte count (p = 0.13) (Table 5).
DISCUSSION
Several series have described the clinical prognostic factors of SARS. These factors include the severity of hypoxemia and platelet count (17, 38), an age over 60 years and elevated LDH (18, 20), comorbidities (19, 27, 38), and a high neutrophil count on admission (20). Poor prognostic factors for SARS in radiological findings comprise the number of involved lobes during the acute phase, multifocal opacities with progression to diffuse airspaces opacification or an initial radiographic presentation with multifocal or diffuse airspaces opacities (17, 30-32, 38).
Univariate Analysis Age, Comorbid Diseases and Mortality
Three of the 28 patients expired with a mortality rate of 10.7%, which is comparable to that seen overall in Taiwan (12.3%), Hong Kong (11.7%), and worldwide (9.6%) (4, 27). It has been reported that for patients with SARS, old age and comorbities are more likely to be associated with a high mortality (17-20). In patients with SARS, the mortality rate for patients over the age of 50 years was 13 times higher than for patients younger than 50 years (17). In contrast, two of our three expired patients were younger than 50 years; such an inconsistency might be partly attributed to a small number of patients in this series, a variable virulence of the infective agent, and the immune status of the host (17, 39).
Hematopoietic Changes
Univariate analysis in this study revealed a significant correlation between elevated leukocyte counts and radiographic scores. Leukocytosis were observed in 61% of our patients that was most prominent on day 20 after the onset of fever, while leucopenia was found in 52% of cases that was most severe on day 10 of the illness; 91% of the patients had lymphopenia with the lowest lymphocyte count (mean: 347.97/mm3 ± 247.28) at a mean time of 13.7 days. The above findings were consistent with a previous report (40).
Thrombocytopenia in patients with SARS was closely related to prognosis by multivariate analysis (17), but it was related neither to prognosis in other series (1, 2) nor to radiographic scores in our study. Actually, 55-61% of the patients with SARS had thrombocytopenia initially, and 35-49% of victims had reactive thrombocytosis in the late stage (17). In our series, the lowest (mean 91.00/mm3 ± 23.06) and highest (mean 487.13/mm3 ± 60.52) platelet count was observed at the mean on day 16 and day 23 after the onset of fever, respectively.
Pulmonary Changes, Severity of Hypoxemia and Retained Arterial CO2
Hypoxemia is the most sensitive and reliable marker of pulmonary failure. Hypoxemia occurred in 60% of our cases (mean 52.53/mmHg ± 13.42) that was most severe on average on day 19 (17). However, the mean and maximal radiographic scores in this series were significantly correlated with the severity of retained arterial CO2, and the maximal radiographic scores also correlated with the degree of hypoxemia. Retained CO2 reflects the severity of lung dysfunction when there is increase of intrapulmonary shunt; this occurred in 71% of our patients (mean 64.93/mmHg ± 28.73) that was most obvious on day 24. The relationship between the severity of lung change and blood gas found in this series is consistent with previous reports describing an inverse relationship between radiographic scores and the percentage of oxygen saturation, particularly at the time of maximal disease (29, 30). The maximal percentages of the involved lung in the mortality and survival groups were significantly different (41.5% ± 8.6 vs 16.4% ± 10.0, p < 0.001) (38).
Changes in Serum Enzyme Levels
Severe acute respiratory syndrome coronavirus particles, some with vacuolation, have been observed in myocardium, kidney, liver and spleen cells (17). Damage to those organs was associated with elevated enzymes by a frequency of 85% for AST, 74% for ALT, 43% for LDH, 13% for creatine kinase, and 95% for C-reactive protein, as shown in our series and in previous reports (17, 20). Higher the levels of the above enzymes are associated with the presence of lung lesions or damage to the other organs (17, 18).
Multivariate Analysis
Statistical analysis in this study showed that the number of hospitalized days, the absolute lymphocyte count, and the number of days of intubation significantly correlated with the mean radiographic score. The maximal radiographic score correlated best with the percentage of lymphocytes in a leukocyte count, followed by the number of hospitalized days and the absolute lymphocyte count.. The above findings were somewhat different from findings in other series (27, 29, 32, 38).
Our study has several limitations. First, this was a retrospective study dependent on data collection from case records; thus, some important information may have been ignored and the laboratory data may be incomplete. Second, the sample size in this study is small: three of the 28 (11%) patients died, and the statistical power was not strong enough to analyze prognostic factors in detail. However, the small number of cases did not affect the significant correlation between the radiographic findings and clinical parameters from a statistical point of view. Third, the mean value of clinical parameters, instead of the worst abnormal laboratory data, was used to analyze the relationship to the maximal radiographic score.
Fourth, this study only described the radiographic abnormalities in patients with SARS pneumonia; pathological changes were not elucidated by either histopathological studies or an animal model. Fifth, medical treatments such as administration of steroids, antibiotics or antiviral agents, rather than SARS, might have affected the clinical parameters and the radiographic findings.
In conclusion, this study showed that the number of hospitalized days correlated most significantly with the mean radiographic score, while the percentage of lymphocytes in a leukocyte count correlated best with the maximal radiographic score. The averages of mean and maximal radiographic scores of the patients who died, with comorbidities and without comorbidity were also significantly different. The severity of abnormalities quantified on chest radiographs in patients with SARS correlated with the clinical course and laboratory parameters.
 XML Download