

 PDF
PDF ePub
ePub Citation
 Print
Print


Abbreviations
COPD
chronic obstructive pulmonary disease
DLCO
diffuse capacity of the lung for carbon monoxide
ECG
echocardiogram
EF
ejection fraction
FEV1
forced expiratory volume in 1 second
FEV1/FEC
the ratio of the forced expiratory volume in 1 second to the forecd vital capacity
GOLD
Global Initiative for Chronic Obstructive Lung Disease
MDCT
multidetector computed tomography
MPR
multiplanar reformation
PFT
pulmonary function test
RV
right ventricular
RVEDV
right ventricular enddiastolic volume
RVEF
right ventricular ejection fraction
RVESV
right ventricular end-systolic volume
RVSV
right ventricular stroke volume
SD
standard deviation
VC
vital capacity
The evaluation of the right ventricular (RV) function and mass is clinically important for management of chronic obstructive pulmonary disease (COPD) because this disease is known to be complicated by development of cor pulmonale. The development of cor pulmonale in these patients is associated with mortality, and proper treatment may improve the quality of the patient's life and prolong the survival (1-3).
Measurement of RV volumes and mass, either by echocardiography or radionuclide study, has proven difficult due to the complex RV geometry (4, 5). Furthermore, emphysema is often encountered in patients with COPD and it may disturb the transmission of the echocardiographic signals, especially when the emphysema extends between the heart and the thorax wall (6).
The recently introduced multi-detector computed tomography (MDCT) with sub-second rotation times and a dedicated cardiac reconstruction algorithm has the ability to acquire thin-section spiral CT coronary angiograms (7, 8). Using the helical scan technique, the image data can be continuously acquired throughout the entire cardiac cycle. Thus, the additional end-diastolic and the end-systolic images can be reconstructed retrospectively from the same MDCT data for the purposes of the functional analysis. Previous reports have shown that using cardiac MDCT for assessment of the RV function is a possible and acceptable technique (9, 10).
The purpose of this study was to assess the relationship between the measurements of the RV function and the mass with using cardiac MDCT and the disease severity in patients with COPD, as determined by pulmonary function test (PFT).
MATERIALS AND METHODS
Patients Selection
This study was approved by the institutional review boards at our hospitals, and an informed consent in respect to the PFT and cardiac MDCT was obtained from all the patients. The data were collected prospectively. From June 2004 to April 2005, 33 patients with COPD underwent the PFT and cardiac MDCT examinations. The group of the patients consisted of 29 men and four women, aged from 50 to 71 years (mean age, 62 years). The diagnosis of COPD was made by the clinical examination, chest radiographs and lung function parameters based on the Global Initiative for Chronic Obstructive Lung Disease (GOLD) Workshop Report (11). The following patients were excluded from our study: patients who had severe primary cardiac disease, diffuse or focal parenchymal abnormalities affecting more than one segment, and pleural effusions.
Pulmonary Function Test
Pulmonary function test was performed in a dedicated pulmonary function laboratory, under the supervision of a certified pulmonary technologist, before the cardiac MDCT examinations. For all the patients, the interval between the PFT and cardiac MDCT examinations was less than one week.
The PFT indexes were measured using a spirometer (Vmax 229, Sensormedics, Yorda Linda, CA). The PFT parameters included the vital capacity (VC), the forced expiratory volume in 1 sec (FEV1), the ratio of the forced expiratory volume in 1 sec to the forced vital capacity (FEV1/FVC) and the diffusing capacity of the lung for carbon monoxide (DLCO). The values of VC, FEV1, FEV1/FVC and DLCO were expressed as the percentages of the predicted values (percentage of predicted).
All the patients were divided into three groups, according to the disease severity, based on the GOLD classifications (11); stage I (mild, FEV1/FVC < 70% of predicted, and FEV1/predicted FEV1 > 0.8), stage II (moderate, FEV1/FVC < 70% of predicted, and 0.3 ≤ FEV1/predicted FEV1 < 0.8) and stage III (severe, FEV1/FVC < 70% of predicted, and FEV1/predicted FEV1 < 0.3 or FEV1/predicted FEV1 < 0.5 with respiratory failure or clinical signs of right heart failure).
Multi-Detector Computed Tomography Examination
The cardiac MDCT scan was performed using a sixteen-slice helical CT (Somatom Sensation 16, software version VA20, Siemens Medical Solutions, Forchheim, Germany) in the caudo-cranial direction within a single breath-hold. The patient's echocardiogram (ECG) trace was simultaneously recorded. The mean heart rate of the patients was 67±12 beats per minute (range 52-97 beats/min) during the CT examination. No beta-blocker was used to control the heart rate. The scan parameters were as follows: 420 ms the gantry rotation time, 120 kV, 500 mAs, 0.75 mm slice collimation, 1 mm slice width, and 2.8 mm table feed/rotation. The contrast solution was composed of 100 ml of contrast media (Ultravist 300; Schering, Berlin, Germany), and it was mixed with 20 mL of normal saline; this was administered intravenously at a rate of 4.5 ml for the first 20 seconds followed by the rate of 1.5 ml for 20 seconds using a power injection (Envision®CT, Medrad, Pittsburgh, PA). As a single head power injector was used in this study, the contrast medium was diluted with saline in order to reduce the streaky artifact in the right heart caused by a high concentration of contrast media.
The image reconstruction was performed on the scanner's workstation using commercially available software (Syngo®, Somaris/5®, Siemens Medical Solutions, Germany). We used a partial scan algorithm, which provided a heart rate dependent temporal resolution between 70 msec and 210 msec from the 420-millisecond gantry rotation. The reconstruction parameters were as follows: a 1 mm slice thickness, a 0.5 mm increment, a 512 × 512 pixels image matrix, a medium smooth kernel and a 20 cm field of view.
In order to identify the maximum systolic contraction and diastolic relaxation phases, we reconstructed two image sets based on the retrospective ECG triggering. The end-systolic phase was reconstructed when the reconstruction window was located at the halfway point of the ascending T-wave on ECG, and the end-diastolic phase was reconstructed when the window was at the start point of the QRS complex on the ECG.
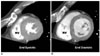
The multiplanar reformation (MPR) images in the 4-chamber view and the long and short axis orientation were reformatted using the scanner's standard 3D-software. From the short axis orientation, the MPR images with a section thickness of 6 mm, without gap, were produced to encompass the entire RV from the base to the apex (Fig. 1).
Multi-Detector Computed Tomography Data Analysis
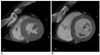
Two radiologists evaluated the right ventricular end-systolic volume and right ventricular end-diastolic volume independently with using commercially available software (Argus®, Wizard®, Siemens Medical Solutions, Germany). The endocardial contours of all the systolic and diastolic short-axis reformation images were manually traced on the analysis software screen. Both papillary muscles and trabeculations were considered as a part of the RV cavity. The basic problem of the short-axis method is determination of the basal slice. Because of the parallel orientation of the tricuspid valve to the short axis, difficulties may be faced for detecting the valve itself and thus the basal slice. Therefore, the areas containing a recognizable RV outflow tract below the pulmonary valve were included in the ventricular portion. The right ventricular stroke volume and ejection fraction were obtained by the analysis software. The measurement of the RV myocardial mass was performed from a short-axis plane as described in a previous report (8). The endocardial and epicardial volumes were obtained with using commercially available software by manually tracing the endocardial and epicardial contours (Fig. 2). The ventricular septum was not considered as a part of the RV, and it was not included in the mass measurements. The myocardial mass was assessed using the following equation: myocardial mass = (epicardial volume-endocardial volume) *1.05 (the specific gravity of myocardium).
Statistical Analysis
The mean volumetric measurements by the two observers were used for the analysis. To evaluate the statistically significant differences in the RV volumes, the ejection fraction and the mass among the three COPD patient groups, one-way ANOVA with the Student-Newman-Keuls method was used. The right ventricular ejection fraction results and the mass results were correlated with the PFT results using Pearson's correlation. P-values less than 0.05 were considered statistically significant.
Pearson's correlation and the Bland-Altman analysis were used to determine the correlation and limits of agreement between the two observers, who used the two-phase reconstruction method of cardiac MDCT for the right ventricular ejection fraction and mass measurements. The Wilcoxon signed rank test was used to evaluate statistically significant differences in the right ventricular ejection fraction and the mass between the two observers. P-values less than 0.05 were considered statistically significant.
SPSS software (Version 10.0; Statistical Package for the Social Sciences, Chicago, IL) was used for the statistical evaluations.
RESULTS
The short axis reformations of cardiac MDCT allowed clear delineation of the endocardial contours of the RV in all the COPD patients. In some patients, the stair-step artifacts were visualized, which were more prominent in stage III than in stage I or II. However, there were no obstacles in the RV volume and mass evaluation.
The results of PFT are summarized in Table 1.
Table 2 shows the results of the right ventricular end-diastolic volume, right ventricular end-systolic volume, right ventricular stoke volume, right ventricular ejection fraction, and right ventricular mass in 33 patients with COPD. The right ventricular end-diastolic volume was significantly lower in stage III than in stage I and II (p < 0.01), whereas the RVESV was not significantly different among the three stages (p > 0.05). In concordance with this, the RVEF was significantly lower in stage III than in stage I and II (p < 0.01). The RV mass was significantly different among the three stages, according to the COPD disease severity (p < 0.05). There were no significant differences between stage I and stage II in the right ventricular end-diastolic volume, right ventricular end-systolic volume, right ventricular stroke volume, and right ventricular ejection fraction (p > 0.05).
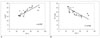
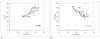
Correlation was excellent between the MDCT results and the FEV1 (r = 0.797 for RVEF and r =-0.769 for RV mass) (Fig. 3) and FEV1/FVC (r = 0.745 for RVEF and r =-0.718 for RV mass) (Fig. 4).
The interobserver agreement was good, with a correlation coefficient of 0.907 for RVEF and a correlation coefficient of 0.894 for RV wall mass. There were no significant differences between the RVEF and RV mass (p = 0.74 for RVEF, and p = 0.71 for RV mass, respectively) (Table 3).
DISCUSSION
This study shows that the mean RV wall mass and EF, as measured by MDCT scan, correlate with the COPD disease severity.
It is known that RV hypertrophy occurs in numerous disorders and conditions, including valvular disease, lung disease, and chronic left-sided heart failure (12, 13). Chronic hypoxemia, which is not unusual in patients with COPD, leads to hypoxic pulmonary vasoconstriction and later to structural changes in the pulmonary vasculature. Thus it contributes to the development of pulmonary arterial hypertension and causes an increased RV afterload (4). RV hypertrophy may results from a response to this RV pressure overload (14, 15). In a recent study by Vonk-Noordegraaf et al. (16), RV hypertrophy is described as the earliest sign of the RV pressure overload in COPD patients with mild hypoxemia. However, RVEF is well preserved in most patients with advanced emphysema during rest (4, 17-19). Pattynama et al. (17) have described that RVEF is not decreased in COPD patients, and it is well preserved in most stable COPD patients. Biernacki et al. (19) also demonstrated that in patients with stable COPD, despite the presence of pulmonary hypertension, the RVEF remained relatively normal. In our study, the RVEF between stage I (mild COPD patients) and stage II (moderate COPD patients) was not significantly different (47±3% vs 46±6%, p > 0.05), whereas it was significantly lower in stage III (severe COPD patients). These results may reflect that with a persistent RV pressure overload, the compensated RV function falls, which eventually results in RV failure (4).
In addition, it has been strongly suggested that even in a hypertrophied RV, the EF is preserved until relatively late in the course of COPD (19, 20). However, if RV hypertrophy progresses and the RVEDV decreases, the compensated RV function can eventually fall. In our study, the RV mass was significantly different among the three stages of the disease severity, and it gradually increased with preservation of RVEF in stage I and stage II (mild and moderate COPD patients); however, in stage III (severe COPD patients), the RVEF fell, although the RV mass increased.
Several imaging modalities, including echocardiograph, angio-cardiography and radionuclide imaging, have all been used to evaluate RVEF and the mass; however, the success of these techniques is limited. Because of the complex shape and substernal location of the RV, it is difficult to estimate the RV function and mass with most of the imaging techniques (21).
Magnetic resonance imaging (MRI) has recently been introduced for more accurate measurements of the RV function and the wall mass in COPD patients (17, 18). Pattynama et al. (17) used MRI to evaluate the RV function and the wall mass in 17 patients with moderate COPD. They concluded that detection of RV myocardial hypertrophy with MRI may aid in the early diagnosis of cor pulmonale that complicates COPD. The advantages of cardiac MRI as compared with MDCT are the lack of radiation exposure, avoidance of iodinated contrast media and an improved temporal resolution in the evaluation of the RV volumes and the mass. Furthermore, short-axis images are readily available, and the secondary reformations required in cardiac MDCT are not needed with cardiac MRI. However, cardiac MRI cannot evaluate lung parenchyma, and it is difficult to perform MRI in patients with dyspnea and heart failure due to a much longer examination time.
The recently introduced MDCT scanners have demonstrated their ability to assess the RV function and the wall mass (9, 10). Koch et al. (9) demonstrated that the mean RVEDV, RVESV and RVSV determined with MPR by 16-detector-row CT correlated well with those parameters measured by cardiac MRI. However, to our knowledge, there have been no studies that have evaluated the RV function with using MDCT in COPD patients.
Although cardiac MDCT can be used as a modality for evaluating the RV volume, function and the wall mass in COPD patients, it has certain limitations in routine use. Cardiac MDCT requires contrast media to discriminate the ventricular cavity, and its temporal resolution is inferior to either electron beam CT or MRI (22). Ritchie et al. (23) have reported that a temporal resolution of about 20 milliseconds is needed to completely avoid any motion artifacts in cardiac imaging by CT. Thus, the limited temporal resolution used in our study may have been insufficient to acquire a precise end systolic volume. Furthermore, in COPD patients, dyspnea often makes it difficult to perform breath-holding more than 10 seconds long, and the stair step artifact can affect evaluation of the ventricular function. It is hoped that with technological developments, the image quality will further improve and the imaging time will be shortened. Another limitation is the radiation exposure. The total radiation dose was calculated to be approximately 4 to 6 mSv, depending on the scan range and the patient's body weight.
Our study includes the following limitations. First, the study population was too small to generalize the results, especially in respect of the stage I patients (mild COPD patients). Second, we did not include normal control subjects for correlation of the RV function. Third, the MDCT results were not compared with the cardiac MRI results, which is the accepted gold standard modality. These problems will need to be solved in future studies.
CONCLUSION
Cardiac MDCT has a potential to become a useful modality for assessing the RV function and RV myocardial hypertrophy in COPD patients. Our results show that the mean RV wall mass measured by cardiac MDCT correlates well with the disease severity of COPD as determined by PFT, and that the mean RVEF is significantly lower in patients with severe COPD than it is in those patients with mild or moderate COPD.


 XML Download