

 PDF
PDF ePub
ePub Citation
 Print
Print


With improvement in resolution broad use of the multi-detector row CT (MDCT), has resulted in detection of an increased number of small pulmonary nodules (1). Although a majority of small pulmonary nodules are benign (2-5), a specific diagnosis for a nodule frequently remains undetermined. Diagnostic evaluation of such small, probably benign but indeterminate pulmonary nodules frequently involves serial CT scanning, to detect growth as evidence of a possible malignancy.
Reliable estimates of nodule size are important for identifying subtle growth in small nodules, to diagnose a malignancy as early as possible. Computer-aided volumetric assessment, of small pulmonary nodules, for estimating growth may provide this reliability, and is gaining wider acceptance. However, several variables affecting the relative error, in nodule volume measurement, have been recognized; these include: nodule size, section thickness, reconstruction algorithm, radiation dose, and segmentation thresholds (6-9). The error for in vivo nodules is expected to be greater than for phantoms, this is because it includes measurement error from greater partial-volume effects, vascular geometry and motion artifacts.
Precision and reproducibility are important factors in the clinical application of an automatic three-dimensional nodule volume measurement program, and have been the focus of many published reports (6, 7, 10, 11). Although obtaining follow-up scans at a fixed lung volume is ideal, this is difficult to achieve in practice. As a part of our ongoing investigation of intrinsic measurement variability, and imaging variables that affect volumetric measurements of lung nodules, we evaluated how changes in lung volume affect volumetric measurements of lung nodules with a multi-row detector CT.
MATERIALS AND METHODS
Subject Selection and CT Scans
The data used in the present study is from CT scans obtained from subjects in an on-going Severe Asthma Research Program (SARP). We included subjects with severe persistent asthma and chronic bronchitis. The subjects included in our study with severe persistent asthma were required to have a history of physician-diagnosed asthma, and to have received asthma therapy for at least 12 months. The diagnosis of asthma was based on demonstration of reversible airway obstruction (i.e., 12% increase in FEV1), and was confirmed by airway hyperreactivity to methacholine (i.e., methacholine PC20 ≤ 8 mg/ml) (12). Subjects were classified as having severe persistent asthma using the criteria of the National Asthma Education and Prevention Program (NAEPP) and the ATS (American Thoracic Society) Workshop on Refractory Asthma (13). The diagnosis of chronic bronchitis was based on the ATS definition (12) and included having a cough and sputum on most days of the month for at least three months of the year during the previous two years, as well as a current or previous smoking history with a minimum of 20 pack years. Patients were excluded from analysis if their CT scans did not meet protocol specifications. Institutional review board approval and patient informed consent were obtained for the SARP study.
At the time of this study, CT scans from 23 subjects enrolled for the SARP were available. One experienced chest radiologist (J.M.G., 13 years of experience with chest CT) reviewed CT scans and identified the presence of lung nodules with the assistance of LungCare (Siemens, Forchheim, Germany). Of the 23 subjects, 10 (4 men and 6 women; age range, 26-55 years; mean age, 42 years) who had nodules on both inspiratory and expiratory CT scans were included in this study. This group included seven subjects with severe persistent asthma and three subjects with chronic bronchitis. Calcified nodules were included in the study.
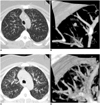
All patients underwent full inspiratory and expiratory CT of the thorax in the supine position. Images were obtained during suspended full inspiration, and suspended relaxed (not forced) expiration.
The scans were performed using a 16-detector-row CT scanner (Somatom Sensation 16; Siemens, Germany), with 16×0.75-mm collimation, 120 kVp, 50 effective mAs, 500-msec gantry rotation time, 18 mm table feed per rotation, 1-mm slice thickness, and 0.7 mm reconstruction increment. CT images were reconstructed with a field of view large enough to cover the complete lung cross-section (262-424 mm). This corresponds to an in-plane pixel size of approximately 0.51-0.83 mm. No contrast media was administered.
Measurements
All CT studies were transferred from the CT scanner to a Siemens workstation, and were analyzed using LungCare including "Nodule enhanced viewing" and Volume software.
Lung nodule volume was measured semiautomatically. After marking a nodule with a mouse click, a volume of interest (VOI) was defined. The volume of the nodule was computed by clicking on the nodule within the VOI. No manual postprocessing of the segmentation result was performed. The apparent diameter of each nodule was calculated from the computed nodule volume on the basis of the volume-diameter relationship of spheres. Nodules were categorized as isolated, juxtavascular, or juxtapleural nodules.
For the computation of the lung volume and whole lung attenuation, lung regions were segmented from the background. The Volume program uses a threshold-based 3D region growing technique to separate the lung regions from other tissues and structures, and selects all voxels between -500 and -980 HU (14). The threshold range was chosen to exclude nonaerated lung tissue such as vessels, major airway or hyperinflated lung tissue. Thus, the segmented lung region corresponds to the sum of the voxels whose attenuation values fall within these threshold values. The volume and mean attenuation of the lung were calculated from the total count and the mean attenuation of the voxel sums. These values were defined as lung volume and whole lung attenuation.
To compute the nodule attenuation and regional attenuation of the lung, we selected a transverse section with the largest nodule cross section area. For each nodule, a region of interest (ROI) that covered about one-half of the diameter of the nodule was placed over the nodule. The edges of the nodule were avoided to prevent partial volume averaging. A larger ROI of 2.0-2.5 cm2 was then placed adjacent to the nodule to measure the regional lung attenuation of the lung. Care was taken to exclude extrapulmonary tissue or large vessels. These measurements were performed by one radiologist (J.M.G.). The volume and mean attenuation of the nodule, and regional lung attenuation were measured twice after an interval of several days. The mean of the two measurements was used for statistical analysis.
Statistical Analysis
Differences between nodule volume on inspiration and expiration were compared with a paired t-test.
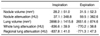
The percent difference was defined as a percentage of the absolute difference between inspiration and expiration measurements divided by the mean of the two values. The percent difference in nodule volume, nodule attenuation, lung volume, whole lung attenuation, and regional lung attenuation were computed. The association between lung nodule volume and nodule attenuation, lung volume, whole lung attenuation, or regional lung attenuation was calculated using the Pearson correlation coefficient. Data analysis was performed repeatedly for all nodules and for nodules ≥ 3 mm. A p < 0.05 indicated a statistically significant difference. The statistical analysis was performed using SPSS 10.0 (SPSS Inc. Chicago, IL).
RESULTS
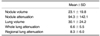
A total of 33 nodules were identified. Nodule volumes ranged from 4.0 to 297.5 mm3 (mean, 28.2 mm3) on inspiration CT and from 4.8 to 307.4 mm3 (mean, 31.5 mm3) on expiration CT. These measures correspond to nodule diameters ranging from 2.0 mm to 8.3 mm (mean, 3.8 mm) on inspiration CT, and from 2.1 to 8.4 mm (mean, 3.9 mm) on expiration CT. There were 10 nodules ≤ 3 mm, 21 nodules 3-5 mm, and two nodules > 5 mm. Twenty-seven were isolated, four were juxtavascular and two were juxtapleural. The mean values for lung nodule volume, nodule attenuation, lung volume, whole lung attenuation, and regional lung attenuation are summarized in Table 1. Ten of 33 nodules > 60 HU were considered to be calcified nodules.
The difference between inspiration and expiration nodule volume was significant (p = 0.001 for all nodules; p = 0.005 for nodules ≥ 3 mm). The mean percent difference in lung nodule volume was 23.1% (range, 0.5-76.9%) for all nodules and for nodules ≥ 3 mm (Table 2, Fig. 1). The volume of the nodules studied was found to measure larger on the expiration CT than on the inspiration CT (28 out of 33 nodules; 19 out of 23 nodules ≥ 3 mm).
A statistically significant correlation between the percent difference of lung nodule volume and lung volume (R = 0.45, p = 0.03) or regional lung attenuation (R = 0.51, p = 0.01) was found for nodules ≥ 3 mm. A correlation between the percent difference of lung nodule volume and nodule attenuation or whole lung attenuation for nodules ≥ 3 mm was not statistically significant (p > 0.05). A correlation between lung nodule volume and nodule attenuation, lung volume, whole lung attenuation, or regional lung attenuation for all nodules was not statistically significant (p > 0.05). There were statistically significant correlations between: lung volume and whole lung attenuation (R = 0.99, p < 0.0001), between lung volume and regional lung attenuation (R = 0.85, p < 0.0001), and between whole lung attenuation and regional lung attenuation (R = 0.86, p < 0.0001).
DISCUSSION
Radiologists have the common challenge of accurate characterization of lung nodules as malignant or benign; this differentiation of nodules is critical for appropriate medical management. Recently, computer-aided diagnosis (CAD) programs have assisted in nodule detection (15-19), and have been used to assess change in size of nodules on serial CT scans (6, 7, 10, 11, 20).
The use of such programs could substantively enhance the accuracy and efficiency of detecting changes in nodules over time. Several lung nodule CAD programs have been developed and are commercially available. Of primary concern is whether a nodule, that appears to have grown on the basis of sequential volume measurements, actually has grown, and whether the difference in measurements is significant or due to error. By using estimates of the variation in percentage volume change, in stable nodules as a function of initial diameter, Kostis et al. (20) suggested that one could formulate an optimal follow-up time at which growth in a nodule can be reliably detected.
Parameters for acquiring or reconstructing images, as well as measurement methods, can affect measurement error in nodule volumetry (7-9). Even when a nodule is intrinsically unchanged between two scans, it may be measured differently due to altered technique such as scanning position. For instance, Wormanns et al. (11) reported that the volume measurement error in 151 nodules ranged from -41 to 29% (mean, 0.7±10.6%) when two consecutive CT scans were performed within 10 minutes after new positioning. Ninety-five percent of all measurements had a volume measurement error between -22.5 and 24.1%. These values were comparable to our results, allowing for the difference in definition of the percent difference between the two studies. In our study, no variation was identified due to acquisition or reconstruction parameters or scanning position.
Our results demonstrated that the nodule volume measurements were significantly affected by variation in respiratory phase. Similar findings, of variability of lung nodule volume measurements with respiration, have been previously reported (21, 22). Novak et al. (21) reported that change in nodule volume measurements, between different respiratory phases, was significantly larger than for nodules scanned twice at full inspiration. In another study, nodule size was measured bi-dimensionally, and a significant difference in the size of the lung nodules during inspiration and expiration was identified (22).
In our study the lung nodules measured larger on expiratory scans. The explanation for this difference in measured values is speculative. One possibility is that the difference observed reflects a real change of nodule volume during the respiratory cycle; another possibility is that this difference is caused by a change in segmentation between the nodule and the background. Because many of the nodules in our study were apparently calcified nodules, the chance to identify real change in nodule volume was low. Some collapsed or partially collapsed alveoli around the nodules on expiration, however, may have contributed to apparent increased nodule volume. Our study demonstrated that volumetric measurements of pulmonary nodules were significantly correlated with changes in lung volume. Nodule volume measurement programs employ threshold techniques used to separate background voxels (11). It is well known that lung attenuation is affected by the respiratory phase (23, 24). A change of background attenuation may affect the segmentation process of the lung nodule, this was observed in our study. Although we measured both the regional lung attenuation and the whole lung attenuation, only the regional lung attenuation had a significant effect on the lung nodule volume measurement. By contrast, a significant correlation between lung nodule volume and nodule attenuation, lung volume, whole lung attenuation, or regional lung attenuation was not observed for all nodules studied. Because measurement variation in smaller nodules is larger, and there are many nodules < 3 mm in all nodule groups, the effect of background attenuation may be lost as a result of the larger variation in the nodule volume measurement itself.
There are several limitations to this study. First, the number of cases in our study was small, and the sizes of all studied nodules were relatively small. Calcified nodules were included in the study. We attempted to avoid unnecessary radiation exposure to subjects by using an existing database. Second, the differences observed in lung volumes on inspiration and expiration scans are likely far larger than those typically expected on routine inspiratory follow-up clinical CT scans. The results of our study reflect upper range variations in nodule volume due to respiratory differences, and were not related to positional variation on follow up studies.
In conclusion, volumetric measurements of pulmonary nodules were significantly affected by changes in lung volume. This variability in respiration-related measurements should be considered when a change in a pulmonary nodule consistent with growth is identified.
 XML Download