

 PDF
PDF ePub
ePub Citation
 Print
Print


CT is the most sensitive and specific diagnostic modality for detecting pulmonary nodules (1-3). The reliable detection of small pulmonary nodules is crucial for the early detection of lung cancer and other nodular lung diseases (1). However, the radiologist's sensitivity for the detection of small pulmonary lesions is limited (1). Nodules may not be detected on CT images because of factors such as a failure to perform the necessary systematic search, or an understandable inability to assimilate the vast amount of information contained in the multiple images contained in a CT examination (2, 4, 5). Especially in the central lung regions, nodules can go undetected because they are confused with blood vessels imaged in cross section (1, 2). For the differentiation between spherical (nodules) and tubular (vessels) structures, contiguous slices have to be evaluated. This is a time-consuming task and susceptible to error. However, the utilization of automatic nodule detection in clinical situations has recently become possible, due to the dramatic increase in computer performance that has come about over the past decade (1, 3). The purpose of this study was to evaluate the efficacy of using a computer-aided detection (CAD) workstation for the detection of lung nodules in clinically acquired chest CT examinations.
MATERIALS AND METHODS
This study was performed with the approval of our Institutional Review Board. Two observers (both chest radiologists) reviewed 210 consecutive outpatient CT examinations on 195 subjects, obtained during a four-month period. The CT studies were obtained with an exposure time in mAs that varied with the patient's weight, 120 kVp, and contiguous slices with 2.5-mm collimation. The scanner was a four row GE LightSpeed Ultra (GEMS, Milwaukee, WI). Each CT series was completed in one breath-hold of less than 30 seconds. The images were displayed on the CAD system monitor using a window width of 1500 HU and level of -600 HU. In this study, the CAD system was an ImageChecker® CT LN-1000, developed by R2 Technology, Inc. (Sunnyvale, CA). Its algorithm was designed to detect nodules with a diameter in the range of 4-20 mm.
Of the original 210 CT chest examinations, those studies with consolidation, lobar or greater atelectasis, airways disease, interstitial lung disease, masses larger than 2 cm, multiple nodules (more than six), and large pleural effusions were excluded. Non-solid or partly solid nodules were also excluded. Two observers reviewed all of the cases with and without the CAD system working in unison to select appropriate cases with and without nodules. The 70 selected CT examinations corresponded to 39 men and 31 women, whose ages were between 19 and 85 years (mean 57.2 years). There were 37 cases with 1-6 nodules and 33 cases without nodules. The number, size and location of the nodules were also recorded. The length and width of each nodule was measured and the mean diameter calculated as the (length+width)/2. The location of each nodule was recorded as being in the inner, middle or outer 1/3 of the lung on the axial images. The combined observations of the two observers, the original interpretation, and the results of the CAD analysis formed the basis for the determination of the presence or absence of nodules in this study.
Four radiologists (observers), not including the abovementioned two radiologists who selected the 70 cases, independently interpreted the 70 sets of CT images first without and then with the CAD system. They were aware that this was a nodule detection study and that there were cases with and without nodules, but were otherwise blinded to all information regarding the CT scans. Two of the four observers were chest radiologists and the other two were senior radiology residents. All of the nodules detected by each observer were recorded as to their slice and position. When interpreting the scans with CAD, each observer decided whether the structures detected by the CAD system were true nodules or false positive nodules. These results were also recorded as to the position and slice of the nodules.
True positive nodules were defined as those nodules determined to be present by the initial two chest radiologists using all available information. True negative cases were those determined not to have nodules by these same criteria. False positive nodules were those detected by an observer or CAD, but which were not in the true database. False negative results were those nodules not detected either by any of the observers or by CAD.
The differences between the results obtained by the four observers working with and without CAD were analyzed using SPSS version 12.0 software (SPSS Inc. Chicago, IL) to generate free-response receiver operating characteristic (FROC) curves. Kappa analysis using McNemar's test was done to analyze the degree of agreement between the four observers without and with CAD.
RESULTS
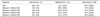
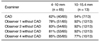
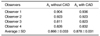
There were 78 pulmonary nodules in the 37 scans with nodules. Their mean diameter was 7.2 mm (range 4-15.4 mm). The size distribution of the nodules was 65 (83%) in the diameter range of 4-10 mm, 12 (16%) in the range of 10-15 mm, and one (1%) in the range of 15-20 mm. The zonal distribution of the nodules was 54 (69%) in the outer third of the lung, 21 (27%) in the middle third, and three (4%) in the inner third. CAD correctly identified 47 of the 78 nodules (60%) (Table 1). Of these 47 nodules, 34 were in the outer third, 12 in the middle third and one in the inner third. The CAD detection rate was thus 63% (34/54) for peripheral lung nodules, 57% (12/21) for the middle third, and 33% (1/3) for the inner third (Table 2). The CAD detection rate was 62% (40/65) for the nodules with a diameter in the range of 4-10 mm and 54% (7/13) for the nodules with a diameter in the range of 10-15.4 mm (Table 3). In addition, the CAD system detected eight nodules ≥ 4 mm in diameter that were not mentioned in the original clinical written reports. CAD identified 109 false positive nodules. This resulted in an average of 1.56 false-positive nodules per CT examination. Structures falsely identified as nodules by CAD were: vessels (n = 68), scars (n = 17), post-operative suture material (n = 9), calcified hilar lymph nodes (n = 5), focal pleural thickening (n = 4), small foci of atelectasis (n = 3), a rib (n = 1), a segment of bronchial wall (n = 1), and a thickened fissure (n = 1). CAD failed to identify 31 nodules, whose locations were peripheral (n = 20), middle third (n = 9) and central (n = 2). The diameters of these 31 nodules were between 4 and 15 mm (mean, 6.7 mm). The detection failure rates for these nodules were 37% (20/54) for the periphery, 43% (9/21) for the middle lung and 67% (2/3) for the central lung. CAD produced seven true negative results amongst the 33 cases without nodules.
The four observers had detection rates without CAD of 81% (63/78), 85% (66/78), 83% (65/78), and 83% (65/78), respectively. There were zero, seven, 12, and 18 false positive results for the four observers' readings, respectively (Table 1). These false positive structures were scars (n = 19), vessels (n = 14) and pleural plaques (n = 4). There were 0, 0.1, 0.17, and 0.26 false-positive results for the four observers per CT study, respectively. For the three inner third lung nodules, the four observers' detection rates were 1/3, 1/3, 1/3, and 2/3, respectively. For the 21 middle third lung nodules, the four observers' detection rates were 86% (18/21), 100% (21/21), 81% (17/21), and 81% (17/21), respectively. For the 54 outer third lung nodules, the four independent observers' detection rates were 81% (44/54), 81% (44/54), 87% (47/54), and 85% (46/54), respectively (Table 2). For the 65 nodules with a diameter in the range of 4-10 mm, the detection rates of the four observers were 78% (51/65), 83% (54/65), 81% (53/65), and 85% (55/65), respectively. For the 13 nodules with a diameter in the range of 10-15.4 mm, the detection rates of the four independent observers were 92% (12/13), 92% (12/13), 92% (12/13), and 77% (10/13), respectively (Table 3). The four independent observers failed to detect 15, 12, 13, and 13 nodules, respectively. The locations of the 15 nodules (diameter 4-15 mm) not detected by the first observer were peripheral (n = 10), middle (n = 3), and central (n = 2). The locations of the 12 nodules (diameter 4-15 mm) not detected by the second observer were peripheral (n = 10) and central (n = 2). The locations of the 13 nodules (diameter 4-15 mm) not detected by the third observer were peripheral (n = 6), middle (n = 5) and central (n = 2). The locations of the 13 nodules (diameter 4-15 mm) not detected by the fourth observer were peripheral (n = 8), middle (n = 4) and central (n = 1). Of the 33 cases without nodules, the numbers of true negative results for the four independent observers were 33, 33, 26, and 27, respectively. After each observer's second reading with the help of CAD, five, two and one additional nodules were detected by three of the observers, respectively. The fourth observer did not detect any additional nodules. The number of false positive results increased when the observers used CAD, increasing by five, seven, four, and nine, respectively, for the four observers.
There was one nodule, which was not detected either by CAD or by any of the four observers. The CAD system did not detect 14 nodules which had been detected by at least one observer. There were no nodules that were detected by CAD, but which were not detected by any observer.
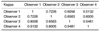
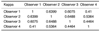
The average Az values for the four observers obtained without CAD and with CAD were 0.863 ± 0.033 and 0.878 ± 0.031, respectively (Table 4). Therefore, the ROC analysis did not show any statistically significant difference between the overall interpretation for the four observers with and without CAD (p > 0.05). The kappa analysis showed fair to good agreement between the four observers both without and with CAD (Table 5, 6).
DISCUSSION
To our knowledge, there have been very few studies designed to evaluate the use of CT images for the detection of lung nodules without and with CAD. Awai and colleagues used 10 observers to review 50 CT examinations with nodules ranging from 0.3 to 2.9 cm in diameter (6). They found a small, but statistically significant improvement in nodule detection with CAD. They did not mention whether there was an increase in the false positive rate with CAD.
In our study, there was no statistically significant difference in the overall detection rates for the four observers with and without CAD. This is likely due to the artificial nature of the study conditions, in which the observers were aware that they were looking for nodules. The study also shows an increase in the false positive rates for all four of the observers when using CAD. Experience is required to learn when to reject "nodules" that have been falsely identified by CAD.
The detection rate for CAD was 60% comparable to other published results, which have shown sensitivities of between 38 and 100% (1-7). The variation in the detection rate with CAD between these different studies is probably due to the differences in the CT technique employed, the sample size, patient characteristics, nodule size, nodule location and the algorithm employed by the CAD workstation. Various segmentation and detection algorithms have been developed (1-9). In the current study, the detection algorithm uses a series of volume-centric segmentation steps to delineate normal from abnormal lung tissue. Multiple geometric parameters are calculated for each suspected lung lesion, including its shape, elongation, size, spiculation, density, and other features. Based on these parameters and by following an analytical decision tree, each candidate lesion is assigned a rating indicating its likelihood of being a lung nodule. If this likelihood rating exceeds a defined threshold for features indicative of a lung lesion, the CAD marks the lesion as such.
The CAD system does not detect nodules less than 4 mm in diameter. This is highly reasonable as almost all lung nodules less than 5 mm are benign and are normal pulmonary lymph nodes or small granulomas (10-13).
The majority of the nodules in our study were between 4 and 10 mm in diameter. Three of the four observers had better detection rates for nodules larger than 10 mm than for nodules between 4 and 10 mm. The detection rate for CAD, on the other hand, did not appear to be influenced by the nodule size (Table 3). The detection rates for peripheral lung nodules were higher than those for central lung nodules, both for CAD and for all four observers. However, there were only three central lung nodules in this study and, consequently, this comparison is not statistically significant. The nodule detection rate of the CAD system was lower than that of the radiologists. Although some additional nodules were detected with the help of the CAD system, it still needs to be improved and tested in further studies.
It is known that CAD systems can have difficulties in detection of nodules adjacent to the pleural surface because the image segmentation algorithm may recognize the nodules as a part of the chest wall and exclude them from further image processing (1). There are no large blood vessels near the pleural surface. Therefore, most solid soft tissue structures in the subpleural region are nodules or focal areas of scarring. The observers had little difficulty in detecting peripheral lesions. On the other hand, the CAD system was able to demonstrate the presence of some nodules located in more central areas of the lung that were overlooked by the radiologists (1). In the central lung zones, nodules can easily go undetected, because they are of similar caliber to the blood vessels, thus decreasing their conspicuity. Another challenge that remains to be overcome is the problem posed by nodules in contact with vascular structures, which are difficult to detect both for the radiologist and the CAD system (1). In this study, the false positive result for CAD was 1.56 per CT case, which was within the range of the published results (1-7). As would be expected, the false positive rate of the CAD system was higher than that of the observers. The most common structures causing false positive results were the vessels for the CAD system and scars for the observers. If the CAD algorithm were improved somewhat, it could perhaps detect these nodules.
In this study, there were five non-solid nodules in addition to the 78 solid nodules. These non-solid nodules were not included in the study and the CAD system did not detect them. In their definition of false negative results produced by CAD, Kanazawa and coworkers included faint shadows with boundaries that were not well defined (8).
In this study, the CAD system identified seven true negative (7/33), which is a significantly lower than that identified by the observers. Therefore, it is essential for users of the CAD system to be aware of the need to reject the system's false positive markings.
In conclusion, CAD systems can be helpful in the detection of pulmonary nodules in chest CT. However, further technological improvements of the system are necessary, in order to increase its sensitivity and specificity. Experience with these systems is also required, in order to prevent the false positive rate from increasing.

 XML Download