

 PDF
PDF ePub
ePub Citation
 Print
Print


Current state of the art MR cholangiographic examination, which relies upon the T2-weighted sequences, is highly accurate in identifying biliary diseases (1-3). However, the T2-weighted MR cholangiography (MRC) has diagnostic limitations which include poor visualization of the intrahepatic biliary tree compared with the extrahepatic biliary tree (4, 5), variation in the degree of T2-weighting that might obscure the biliary structures (6), and limited spatial resolution.
During the past few years, T1-weighted MRC using hepatocyte-directed contrast agents has created interest in the field of MRC because of its potential to provide functional information and to improve the visualization of the non-dilated biliary system (7-13). Initially, mangafodipir trisodium (Mn-DPDP), which is mainly being excreted into biliary system, has been used for this purpose (8, 9, 11-13). However, dynamic MR imaging of the liver cannot be performed because this agent needs to be administered slowly. Recently, contrast agents that are excreted through both the renal and biliary pathways, such as gadobenate dimeglumine (Gd-BOPTA) have become available (14-17). Using a bolus injection technique, these agents can be used for dynamic imaging as an extracellular space agent in the early phase as well as a biliary contrast agent in the delayed phase. However, because the proportion of the amount that is excreted through the biliary system is relatively small, the scan window for the biliary imaging should be delayed more compared to manganese agents. To our knowledge, the relative efficacy of these two agents in terms of ductal visualization has not been compared directly.
The aim of this study was to investigate the feasibility of Gd-BOPTA MRC and to compare it with Mn-DPDP MRC in terms of the extrahepatic and intrahepatic ductal visualization in patients with a normal or undilated biliary system.
MATERIALS AND METHODS
Eighty-eight healthy liver donor candidates underwent contrast enhanced T1-weighted MRC. Between April 2001 and June 2003, liver donor candidates (age range, 19-54 years; mean age, 34.1 years) (21 women and 67 men) underwent an evaluation with MR imaging. Mn-DPDP was used as an intrabiliary T1 contrast agent in 36 patients between April 2001 and April 2002, and Gd-BOPTA was used in 52 patients between May 2002 and June 2003. None of the subjects had known or suspected biliary abnormalities at the time of the examination. Our institutional review board approved all aspects of this retrospective study and did not require informed consent from any patients whose records were included in our study.
MR Imaging Technique
Both Mn-DPDP MRC and Gd-BOPTA MRC examinations were performed with a 1.5-T imaging system, using a torso phased array coil at one of the two MR systems. (Horizon, GE Medical Systems, Milwaukee, WI; Philips Medical Systems, Best, the Netherlands). Thirty five Mn-DPDP MRC examinations were performed using the former and one Mn-DPDP MRC examination and all Gd-BOPTA MRC examinations were performed using the latter.
Mn-DPDP MRC was obtained following an IV injection of mangafodipir trisodium (Teslascan; Nycomed, Princeton, NJ) at the standard dose of 5 µmol/kg (0.5 mL/kg) administered via a slow injection for 1-2 min followed by a 10-mL saline flush. Fifteen to 30 min after the injection, axial and coronal volumetric 3D spoiled gradient-echo acquisitions of the liver and biliary system were performed, using the following parameters: TR range/TE, 5-8/minimum; flip angle, 20°; matrix, 256×160; field of view, 34 cm using a rectangular field of view; and 4 mm slice thickness with a 2-mm reconstruction interval. In the case of Gd-BOPTA MRC, three-dimensional (3D) breath-hold T1-weighted fast-field-echo acquisitions were performed 60-90 minutes after the intravenous administration of the Gd-BOPTA (Multihance, Bracco, Milan) at a dose of 0.2 mmol/kg of body weight. The contrast agent was infused using an automated injector for 12 seconds at a volume-adjusted rate ranging between 2.5 and 3.5 mL/s. The axial and coronal images were obtained using the following parameters: TR range/TE, 5.1/1.47; flip angle, 40°; matrix, 512×160; field of view, 34 cm using a rectangular field of view; and a 2 mm slice thickness with a 1-mm reconstruction interval.
Qualitative and Semiquantitative Image Analysis
Two experienced gastrointestinal radiologists analyzed the images retrospectively. They independently reviewed the Mn-DPDP MRC images and Gd-BOPTA MRC images randomly. Each observer recorded visualization grades of the biliary tree, based on a four-point confidence rating scale, with one representing no visualization and four representing excellent visualization. The following structures were evaluated: the common duct, the right and left hepatic ducts, and the right and left second-order division of the intrahepatic ductal branches. For the semiquantitative analysis, one radiologist performed the operator-defined region-of-interest (ROI) measurements of the mean signal intensity of the common duct, the hepatic parenchyma, and the background noise on the coronal 3D spoiled gradient-echo image of the Mn-DPDP MRC images and Gd-BOPTA-MRC images, using a local picture archiving and communication system (PACS) monitor and Digital Imaging and Communications in Medicine (DICOM) image viewing software π-view version 4.0.1.1; Mediface, Seoul). In order to measure the common duct signal intensity, either circular or ovoid ROIs were drawn to encompass as much of the common duct as possible. For the hepatic parenchyma, the ROIs were set in the area that is devoid of focal changes in signal intensity, large vessels, and prominent artifacts at the same level. The noise was measured on each image using the ROIs positioned just lateral to the abdominal wall. The areas with the most prominent ghost artifacts were not included. The signal-to-noise ratio (SNR) of the common duct and liver was calculated by SIcommon duct/Nsd and SIliver/Nsd, respectively, where the SIcommon duct and SIliver are the signal intensities of the common duct and the liver, respectively, and the Nsd is the standard deviation of the noise. The contrast-to-noise ratio (CNR) between common duct and liver was calculated by (SIcommon duct-SIliver)/Nsd.
Statistical Analysis
The Mann-Whitney U test was used to compare the subjective ratings of the visualization of each segment of the biliary tree between the Mn-DPDP and Gd-BOPTA MRC groups. The mean of the visualization grades for the two reviewers in each segment was used as a single score. The weighted kappa (κ) test was used to measure the interobserver agreement in the ductal visualization. The degrees of agreement were categorized as follows: κ value of 0.00-0.20, poor agreement; κ of 0.21-0.40, fair agreement; κ of 0.41-0.60, moderate agreement; κ of 0.61-0.80, good agreement; and κ of 0.81-1.00, excellent agreement. The student's t test was used to examine the statistical significance in the differences between the SNRs and CNRs of the two methods. A p value < 0.05 was considered statistically significant.
RESULTS
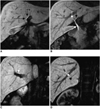
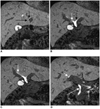
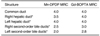
The median visualization grades for the qualitative analysis are shown in Table 1. Mn-DPDP MRC and Gd-BOPTA MRC groups both showed similar visualization grades in the common duct (p = .380, Mann-Whitney U test). In the case of the proximal bile ducts, the median visualization grade was significantly higher in the Gd-BOPTA MRC group than in the Mn-DPDP MRC group (right hepatic duct: p = 0.016, left hepatic duct: p = 0.014, right secondary order branches: p = 0.006, left secondary order branches, p = 0.003) (Figs. 1, 2). The reviewers' agreement for the degree of ductal visualization was fair to moderate (Table 2).
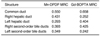
Semiquantitative analysis showed that the mean SNR of the common duct and the liver were 69.92±32.34 and 45.78±19.57 for Mn-DPDP MRC, 93.65±34.00 and 54.75±21.83 for Gd-BOPTA MRC, respectively. The mean common duct-to-liver CNR was 24.14±17.98 for the Mn-DPDP MRC group and 38.90±24.50 for the Gd-BOPTA MRC group. The mean SNR of the common duct and the common duct-to-liver CNR were significantly higher in the Gd-BOPTA MRC group than in the Mn-DPDP MRC group (p = .002 and p = .003, respectively, Student's t test).
DISCUSSION
Mn-DPDP is the first clinically available hepatocyte-directed agent that is mostly eliminated through the biliary system and enhances the liver signal intensity on T1-weighted images (18-20). Approximately 50-60% of the injected dose was found in the feces, and approximately 15-20% was found in the urine (21). Several reports have confirmed its efficacy as a biliary contrast agent (8, 9, 11, 13). Recently, Lee et al. and Kapoor et al. (9, 11) suggested that Mn-DPDP MRC may facilitate the definition of the intrahepatic bile duct anatomy in healthy liver transplant donor candidates. However, this agent cannot be used for dynamic imaging, which is important in evaluating the vascular anatomy and characterizing focal hepatic lesions.
Gd-BOPTA can be used as a conventional extracellular agent for dynamic MR imaging as well as a hepatocyte-directed agent producing a prolonged enhancement of the liver. A pharmacokinetic study showed that approximately 2-4% of the injected dose is taken up into the functioning hepatocytes and is eliminated through the biliary system (17). Because of this property, Gd-BOPTA has the potential to be a biliary contrast agent. However, to the best of our knowledge, the clinical utility of Gd-BOPTA as a biliary contrast agent has not been evaluated.
This study showed that Gd-BOPTA MRC could be used for anatomic assessments of non-dilated biliary trees and was comparable or superior to Mn-DPDP in terms of the ductal visualization. This is an intriguing result because the proportion of Gd-BOPTA excreted into the biliary system is substantially lower than Mn-DPDP (21). The relaxivity of Gd-BOPTA is higher than that of Mn-DPDP in liver tissue (30 vs. 21.7 [mmol-1 S-1]) (22). Macromolecular binding, with the resultant increase in relaxivity, may compensate for the lower hepatocellular uptake of Gd-BOPTA compared to that of Mn-DPDP.
There were some limitations to this study. First, because our study was a retrospective study, a direct comparison of both contrast agents in the same patient was not performed. In addition, the depiction of the biliary tree on the contrast enhanced MRC may show a different result based on the liver function regardless of the administered contrast agents. However, this study included only healthy liver donor candidates with normal functioning livers. Second, the Mn-DPDP-enhanced and the Gd-BOPTA-enhanced MRC were obtained approximately between 15 minutes to 30 minutes, and between 60 minutes to 90 minutes, respectively, after injecting the contrast media. Since we did not obtain serial images from both the Mn-DPDP and Gd-BOPTA MRC, we are not sure whether the delayed images provided best scan window for the biliary tree depiction. However, it was reported that the optimal window for evaluating the liver parenchyma and the bile duct after injection, range from 15 to 20 minutes for Mn-DPDP MRC (7, 9, 13) and 60 to 120 minutes for Gd-BOPTA MRC (23). Third, the MR scanners and the pulse sequence parameters were not the same in the two different contrast-enhanced techniques. Most of the Gd-BOPTA-enhanced MRC was performed using a newer version of the MR system which uses a thinner section thickness. This was because the new MR system was installed during this study. Therefore, the superior results of Gd-BOPTA MRC for intrahepatic duct visualization may be due in part to the more optimized scan parameters. However, our results showed that the Gd-BOPTA-enhanced MRC obtained with updated MR system are comparable to MnDPDP-enhanced MRC obtained by the less updated MR system.
In conclusion, although a fair comparison between the two contrast agents for ductal visualization could not be performed due to the limitations of the study, the data suggest that Gd-BOPTA MRC is comparable to Mn-DPDP MRC in visualizing the biliary duct in either a normal or non-dilated biliary system. Therefore, Gd-BOPTA, as a biliary contrast agent, is a potential substitute for Mn-DPDP.
 XML Download