

 PDF
PDF ePub
ePub Citation
 Print
Print


Breast cancer is one of the leading causes of cancer related mortality among women. Early detection of breast cancer is the key to successful treatment. Currently, screening mammography is recommended as the most reliable method for early detection of breast cancer. Radiologists carefully search each image for any visual signs of abnormality. However, at times it may be difficult for radiologists to detect some lesions on mammograms because abnormalities are often embedded in and concealed by varying densities of breast tissue structures. Indeed, estimates indicate that between 10 to 30 percent of breast cancers are missed by radiologists during routine screening (1, 2). Thus, several researchers have attempted to develop computer aided diagnosis tools which would increase the efficiency and effectiveness of screening procedures by using a computer system, as a "second opinion", to aid the radiologist by indicating locations of suspicious abnormalities in mammograms, leaving the final decision regarding the likelihood of the presence of a cancer and patient management to the radiologist (3-6).
The aim of this study was to analyze digitized mammograms by applying computer image processing techniques, extract region of interest (ROI) and classify them as masses or non-masses. ROI were identified using the intensity values of pixels in mammograms and scanning these pixels in 8 directions with distance thresholds. By scanning each pixel of a ROI with a mass template and looking for similar shapes to the mass in the template, we were able to successfully detect the true masses.
MATERIALS AND METHODS
Image Dataset
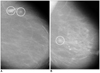
For the development and evaluation of the proposed system, we used the MiniMIAS (7) database. This database contains left and right breast images for a total of 161 patients with ages ranging from 50 to 65. All images are digitized at a resolution of 1,024×1,024 pixels and at 8-bit grey scale level. All of the images also include the locations of any abnormalities that may be present. The existing data in the collection consists of the location of the abnormality (like the centre of a circle surrounding the tumor), its radius, breast position (left or right), type of breast tissues (fatty, fatty-glandular and dense) and tumor type if it exists (benign or malign). In this study, we considered 52 images which consisted of 11 normal cases and 41 abnormal cases, circumscribed mass (22 images) and spiculated mass (19 images). Figure 1 shows examples of the abnormal cases.
Regions of Interest Specification
The mammograms from the MiniMIAS database present several different areas such as image background, tissue area, and informative marks. The ROI were extracted to reduce the complexity of the system. Instead of scanning the whole mammogram with the template pixel by pixel, only ROI were considered in the scan. Consequently the computation time and the detection time were reduced.
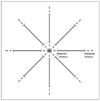
To separate the ROI from breast tissue, it was assumed that pixels which form a ROI must be members of a set of adjacent neighbor pixels with suitable intensities. To identify the suitable intensities, two thresholds "minimum intensity threshold" and "maximum intensity threshold" were used. It has been observed that diameters of masses are between the upper and lower boundaries. Therefore, to understand whether a pixel was in the center region of the ROI, diameter of the ROI (assuming the pixel in question is the center) was considered initially. In this stage, we introduce two more thresholds which form the boundaries. As seen in Fig. 2, one is the "minimum distance threshold" representing the lower boundary and the other is the "maximum distance threshold" representing the upper boundary. If a pixel has adjacent neighbors that are less than the "minimum distance threshold" or more than the "maximum distance threshold" in 8 directions, it would be concluded that this pixel could not be a part of the ROI. Otherwise, this pixel would be a part of the ROI.
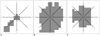
Examples of determining whether pixels are part of a ROI can be seen in Fig. 3. Assume that in Figs. 3A-C, grey pixels have suitable intensities. As seen in Fig. 3A, if a grey pixel does not have a number of adjacent neighbor grey pixels greater than or equal to the "minimum distance threshold" value, or as seen in Fig. 3B, if a grey pixel does not have a number of adjacent neighbor grey pixels less than or equal to the "maximum distance threshold" value in all directions, it would be considered that the pixel under investigation is not a part of the ROI. Otherwise, as seen in Fig. 3C, it would be concluded that the pixel is part of the ROI. The minimum and maximum distance thresholds values are dealt with the resolution of the mammogram image. These thresholds are used to avoid very big or very small structures corresponding to artifacts and blood vessel type objects.
Detection of Masses Using a Mass Template
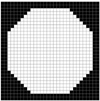
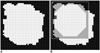
The main issue once the masses were detected was whether to categorize the specified ROI as masses or non-masses. The identified ROI were represented by a black and white image called image of ROI which contains only ROI in white. We observed that various ROI have different morphologies. While masses are thicker and more circular, other structures tend to be thinner and longer. Therefore, to distinguish the masses from normal structures based on their morphologies, a mass template, which is shown in Fig. 4, was used. This template consists of black and white pixels. While white pixels represent a breast mass, black pixels represent pixels having intensity values outside the interval from the "minimum intensity threshold" to "maximum intensity threshold". The following paragraphs describe a few examples of how this mass template was used in this study.
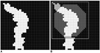
The image of a ROI was scanned pixel by pixel starting from the top left. While scanning the image we compared each pixel with the top left pixel of the mass template. We compared each pixel in the image of the ROI with the pixels of the template and looked for any similarities. During this process two kinds of errors occurred. The first error is called the "error of black pixels" which means the number of black pixels in the template which are actually white in the image of ROI. The second error is called the "error of white pixels" which means the number of white pixels in the template which are actually black in the black image of ROI. For each pixel in the image of the ROI we looked for shapes (parts of ROI) similar to masses in the template. The similarity is considered using two thresholds which are "black error threshold" and "white error threshold". If a a shape similar to one found in the template was detected then the coordinates of the white pixels of the shape, which were also white in the template, were recorded. Consequently, these coordinates form part of a true mass. Figures 5 and 6 demonstrate the use of a template with dimensions 30×30 pixels to detect a mass, and a normal structure such as a blood vessel. The image with a true mass is shown in Fig. 5A and the image with a blood vessel is shown in Fig. 6A. Figures 5B and 6B show the identification of pixel X with the top left pixel of the mass template. The template is surrounded by a white square. Next, each pixel in the image is compared with the pixels of the template. The results of the comparison are shown by two different colored pixels in the white square. The pixels in grey are the pixels of the ROI that are not part of the mass in the template and the number of grey pixels is called "error of black pixels". The pixels in dark grey are the pixels of the mass in the template which are not a part of the ROI and the number of dark grey pixels is called "error of white pixels".
These error values were compared with the "black error threshold" and "white error threshold", to determine whether the ROI was part of a mass or not. We used the following rule to distinguish masses from normal structures: if the "error of black pixels" was greater than the "black error threshold" and the "error of white pixels" was less than the "white error threshold" then the ROI under investigation was part of a true mass and the coordinates of the white pixels of the ROI, which were also white in the template, were recorded. The rule was defined this way and the threshold values were chosen in order to avoid thin and long shapes like blood vessels. If the "error of black pixels" was low, this meant that the ROI would be long. If the "error of white pixels" was high, this meant that the ROI would be thin.
RESULTS
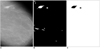
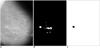
The system was applied to 52 mammogram images consisting of 11 normal cases and 41 abnormal cases, circumscribed mass (22 images), spiculated mass (19 images). In Figs. 7 and 8, examples of identifying ROI and detecting masses are given. Figure 7A shows a case with two circumscribed masses. The ROI extracted from this mammogram are shown in Fig. 7B. When these ROI were compared with the template, similar ones were labeled as masses, which are shown in Fig. 7C. Figure 8A shows a case with a spiculated mass. The ROI and the detected mass are shown in Figs. 8B and 8C.
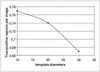
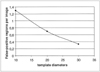
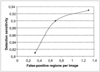
Using the ROI specification methods, 332 ROI were identified which reduced the complexity of our CAD system. Most of them were normal ROI corresponding to artifacts and blood vessel type objects. The classification of these ROI was performed using 3 templates whose diameters were 10, 20 and 30 pixels. Scanning the ROI with these templates, different true positive rates and false positive rates were achieved, which are shown in Figs. 9 and 10 respectively. Figure 11 shows the free-response receiver operating characteristic (FROC) curve which is a plot of operating points showing the tradeoff between the true positive rates versus the average number of false positives per image.
Using the template with dimensions 30×30 pixels, ROI were classified by the rule based sub-system as follows: 35 ROI were true positive (TP), eight were false negative (FN), 17 were false positive (FP) and 272 were true negative (TN). This resulted in a sensitivity of 81% with an average of 0.33 false positives per image. With the template whose diameter was 20 pixels, ROI were classified as follows: 39 ROI were true positive (TP), four were false negative (FN), 36 were false positive (FP) and 253 were true negative (TN). This resulted in a sensitivity of 90% with an average of 0.7 false positives per image. With the template whose diameter was 10 pixels, ROI were classified as follows: 40 ROI were true positive (TP), three were false negative (FN), 68 were false positive (FP) and 221 were true negative (TN). This resulted in a sensitivity of 93% with an average of 1.3 false positives per image.
The efficiency and complexity of this system was better than other systems presented in literature and current commercial systems. A number of studies have reported the detection performance of various commercial CAD products. Several studies have reported that in limited datasets, at least two commercially available Food and Drug Administration-approved products (Image-Checker and Second Look) could achieve case-based mass detection sensitivities above 85% with less than one false-positive identification per image (8, 9). To achieve approximately 75% sensitivity in detecting visible subtle masses on prior images, another study demonstrated that the false-positive rate of a commercial CAD system increased to more than 1.3 per image (10).
Consequently, the experimental results showed that as template size decreases, the true positive rate and the sensitivity increase. The high sensitivity achieved by the present system has the potential to improve doctors' diagnostic performances.
DISCUSSION
There is growing interest in using CAD systems that aid in the detection of breast abnormalities at earlier stages, and there are various image processing methods proposed for the detection of masses in mammograms. Brzakovic and Neskovic (11) described an algorithm that is based on fuzzy pyramid linking and multiresolution segmentation. Petrick et al. (12) reported a two-stage adaptive density-weighted contrast enhancement (DWCE) algorithm for mass detection. Chan et al. (13) studied the effectiveness of using texture features derived from Spatial Grey Level Dependency (SGLD) matrices for classification of masses and normal breast tissue on mammograms. Yin et al. (14) investigated mammographic asymmetries for the identification of mass lesions. Kegelmeyer et al. (15) utilized the analysis of local oriented edges and a subset of Laws' texture features to detect spiculated masses. Petrick et al. (16) proposed a DWCE segmentation method with multiresolution texture features extracted from wavelet coefficients and a linear discriminant analysis to classify the segmented regions as breast masses or normal tissue. Singh et al. (17) included a novel mechanism for the combination of the metrics proposed into a single quantitative measure. The quantitative measures help to select the best suited image enhancement on a per mammogram basis, which improves the quality of subsequent image segmentation more than using the same enhancement method for all mammograms.
Several companies have developed systems that are available commercially. Due to the proprietary nature of this type of work, the companies divulge very little information regarding their image processing algorithms and speed of image interpretation. One of the CAD systems on the market today is called the ImageChecker system developed by R2 Technology (Los Altos, CA). For mass detection, the system searches for dense regions with radiating lines, which in theory, implies that the suspicious area is a mass. Once these areas are located, the area is marked with an asterisk and processed by a neural network algorithm. A second system called Second Look was developed by CADx Medical Systems (Montreal, Quebec, Canada). Potential suspicious areas are located using artificial intelligence algorithms and are subsequently analyzed using radiological and statistical features.
In this study, a new method was presented for the detection of masses on mammograms. The proposed method was based on a two-step procedure. The first step is ROI specification, and the second step is the rule based classification of the ROI. In the first step, the intensity values of pixels in mammogram images were used to specify the ROI, and the pixels were scanned in 8 directions. In the second step, a mass template was used to categorize ROI as true masses or non-masses based on their morphologies. The effectiveness of the proposed system was measured using 52 mammogram images from the MIAS database. The ROI were classified using 3 templates whose diameters were 10, 20 and 30 pixels. The results showed that using templates with these diameters achieved sensitivities of 93%, 90% and 81% with 1.3, 0.7 and 0.33 false positives per image respectively. The results showed that when fully developed, the present system could improve the accuracy and efficiency in mass detection.
In conclusion, using templates for automated mass detection in digital mammographic images was found to be an efficient method which obtains high sensitivity with an acceptable number of false positives per image.
 XML Download