

 PDF
PDF ePub
ePub Citation
 Print
Print


The recent development of various image-guided tumor ablation techniques has provided a new therapeutic modality, whose objective is the complete eradication of hepatic tumors (1). Amongst these different techniques, percutaneous radiofrequency (RF) ablation is an outstanding therapy that induces localized coagulation of the tumor by creating resistive ionic heating through the electrode (2-6). The early evaluation of the therapeutic response after RF ablation is critical, in order for a correct decision to be made as to whether further treatment (i.e. additional ablation) is necessary. The residual unablated tumor is usually depicted on contrast-enhanced multiphase helical CT as a focal enhancing structure during the arterial and portal venous phases (3-5, 7). Contrast-enhanced ultrasonography (US) has also been used by many investigators to detect residual tumors (8-11). Since percutaneous RF ablation is usually performed under US guidance, US evaluation of the therapeutic response seems to be preferable (2-5). Several intravenous contrast agents including SH U 508A (Levovist; Schering AG, Berlin, Germany) have been used, because neither gray-scale US, nonenhanced color Doppler US nor power Doppler US can provide satisfactory information on the completeness of RF ablation, owing to their low sensitivity to small vessels with slow flow (8, 9). Some prior reports suggested that contrast-enhanced color Doppler and power Doppler US provide improved depiction of residual unablated tumors in the ablation zone (8, 9, 12). Recently, contrast-enhanced gray-scale US using a harmonic technology has been introduced for the evaluation of the therapeutic response to RF ablation (10, 11, 13, 14). This new technique allows for the detection of residual viable tumors after ablation, without any of the blooming or motion artifacts seen on contrast-enhanced color or power Doppler US. According to our experience of treating 1,300 liver cancers with percutaneous RF ablation, contrast-enhanced US is as accurate as contrast-enhanced multiphase helical CT for the early depiction of residual unablated tumors. This technique was also useful in targeting residual unablated tumors during the process of additional ablation. In this article, we describe the different methods of performing the contrast-enhanced US examination, which is used for the early evaluation of the therapeutic response. We also present our results, and discuss the strengths and weaknesses of these different techniques.
POSTABLATION IMAGING STRATEGY
From April 1999 to October 2003, 1,300 liver cancers were treated with US-guided percutaneous RF ablation in our institution. Of these, 1,140 were hepatocellular carcinomas (HCCs). To perform the percutaneous RF ablation, various kinds of RF devices manufactured by three different companies (Radiofrequency Interstitial Thermal Ablation Medical System, Mountain View, Cal; RadioTherapeutics Corporation, Mountain View, Cal; and Radionics Corporation; Burlington, Mass) were used (3-5). Details concerning the preparation of the patients and the ablation techniques used have previously been reported (7, 9, 12, 14).
Immediately after the percutaneous RF ablation, all of the patients were evaluated by means of a gray-scale US examination, in order to detect whether any acute complications had occurred. For the early evaluation of the therapeutic response, we performed either contrast-enhanced US or CT or both. The postprocedural contrast-enhanced CT examinations were performed with a helical scanner (HiSpeed; GE Medical Systems, Milwaukee, Wis) immediately (within 2 hours) after the RF ablation. Images were obtained before, and 30, 70 and 180 seconds after the initiation of the intravenous contrast material injection, representing the nonenhanced, hepatic arterial, portal venous and equilibrium phases, respectively. The following morning, contrast-enhanced US examinations were performed using a real-time US scanner (HDI 5000, Advanced Technology Laboratories, Bothell, Wash; LOGIQ 9 or LOGIQ 700 Expert Series, GE Medical Systems, Milwaukee, Wis; or Sequoia, Siemens Medical Solutions, Mountain View, Cal), following the injection of a microbubble contrast agent. The microbubble contrast agent that we used, SH U 508A, is a suspension of galactose in sterile distilled water. In this contrast agent, the tiny microbubbles (2-8 µm) are stabilized in the microparticle suspension. This agent was prepared by vigorous shaking with 11 mL of water for 10 seconds. A suspension of microbubbles and galactose microparticles was created by disaggregation of the granules. After standing for 2 minutes, 12.5 mL of a 300 mg/mL suspension was administered through an antecubital vein.
All patients underwent follow-up four-phase helical CT-both nonenhanced and contrast-enhanced three-phase-scans 1 month after RF ablation as a baseline study for the evaluation of the therapeutic efficacy. We used either contrast-enhanced US or CT or both for the early assessment of complications and/or macroscopic residual unablated tumors, since it was generally difficult to depict microscopic residual tumors, due to the presence of either reactive hyperemia or procedure-related arterioportal shunts. The final decision on the early therapeutic efficacy was made on the basis of 1-month follow-up CT findings, since it is known that the reactive hyperemia is usually resolved by this time (7). When found, residual unablated tumors were usually treated with additional RF ablation. If the condition of residual tumor was not adequate for additional RF ablation, due to its poor conspicuity on US or the presence of multiple new lesions, transcatheter arterial chemoembolization (TACE) was performed. If there was any evidence of the technical success of the local treatment and no new HCC appeared in the other liver site on the 1-month follow-up CT, subsequent contrast-enhanced three-phase helical CT was repeated at 3-month intervals as our follow-up strategy.
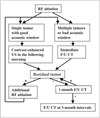
On the follow-up CT, we considered the tumor to be completely ablated when there was no enhancing portion within the ablation zone during either the hepatic arterial or portal venous phase. Similarly, we regarded the tumor as being completely ablated if there was neither vascularity nor enhancing focus within the ablation zone on contrast-enhanced US. A residual unablated tumor was defined as an irregular peripheral-enhancing focus in the ablation zone on either the contrast-enhanced US or early follow-up CT, immediately or 1 month after RF ablation (7, 15). Local tumor progression was considered as the presence of growing enhancing tumors at the margin of the ablation zone on later follow-up CT, when there had been no previous evidence of a residual unablated tumor on the contrast-enhanced US and early follow-up CT (15). As described above, contrast-enhanced US has been used as the key modality in the imaging strategy used to assess the therapeutic efficacy following RF ablation in our institution (Fig. 1).
CONTRAST-ENHANCED US
Power Doppler US
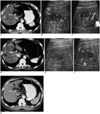
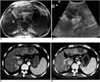
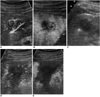
During the first one year period (between April 1999 and March 2000), most patients treated with percutaneous RF ablation in our institution were evaluated with contrast-enhanced power Doppler US after RF ablation. These power Doppler US examinations were performed before and after the injection of a microbubble contrast agent, and the power Doppler US parameters were optimized. The color gain was dynamically adjusted to detect slow flows and to avoid noise. The pulse repetition frequency was maintained at 700 Hz. We started to scan with power Doppler US 20 seconds after initiation of the contrast agent injection, which was performed at a rate of 3 mL/min with an infusion pump (IPX4; IVAC Medical Systems, Hampshire, U.K.). We scanned intermittently to avoid early bubble destruction. With this technique, the enhancement effect lasted for more than 10 minutes. Focal areas with flow signals in the ablated lesions were considered as viable tumor portions (9). In our previous report involving the treatment of 73 hepatocellular carcinomas (HCCs) (12), contrast-enhanced power Doppler US showed no focal peripheral flow signals in 65 (89%) ablation zones (Fig. 2). In the remaining eight (11%) ablation zones, residual tumors were found on both the immediate follow-up CT and contrast-enhanced power Doppler US. The areas of the residual tumors on the power Doppler US were well correlated with the enhancing portions on CT (Fig. 3). Hence, 100% diagnostic agreement was achieved between the contrast-enhanced power Doppler US and immediate follow-up CT. Of the 65 ablation zones without residual unablated tumors, however, 10 (15%) had local tumor progression on follow-up CT.
Pulse Inversion Harmonic Imaging (PIHI)
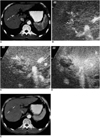
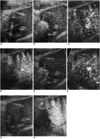
PIHI is one of the early-developed gray-scale harmonic techniques (HDI 5000, Advanced Technology Laboratories, Bothell, Wash). The transducer sends two pulses into the tissue in rapid succession (one with a 180° phase change), and receives the sum of the echoes back from the two inverted pulses. Consequently, the signals from the harmonic component are boosted, and those from the fundamental component are suppressed (16, 17). Because microbubble agents produce nonlinear backscatter, they respond differently to phase inverted pulses and do not reflect identical inverted waveforms. According to some previous reports (10, 16, 17), PIHI is superior to conventional Doppler US or second harmonic US in the depiction of tumor vascularity. Meloni et al. (10) pointed out that contrast-enhanced PIHI has increased the sensitivity of detecting residual tumors after RF ablation by up to 83%. We also used this technique for a short period of time (Fig. 4). Pulse inversion harmonic imaging (mechanical index, MI, 1.1-1.3) was performed at 4- to 6-sec intervals from 20 sec until 90 sec after initiation of the contrast agent injection, using a single-frame acquisition mode, rather than continuous imaging. The residual unablated tumors were seen as focal enhancing structures in the periphery of the ablation zone.
Coded Harmonic Angio (CHA)
CHA is the other contrast-specific gray-scale harmonic US technique based on digitally encoding US technology (LOGIQ 9 or LOGIQ 700 Expert Series, GE Medical Systems, Milwaukee, Wis). This technique encodes the unwanted fundamental frequency component when transmitting pulses and then, through a decoding process when receiving the signals, removes the pre-tagged fundamental echoes without any loss or degradation of overlapping harmonic signals (18-20). This leaves only the desired wideband harmonic return signals, and allows for superior contrast and spatial resolution over conventional harmonic imaging techniques. CHA uses the B-flow technique, as well as digitally coded harmonic imaging. The B-flow technique, which is optimized for the direct visualization of blood cells on gray-scale images, uses codes to enhance weak blood echoes and equalize the non-moving tissue signal (19) Thus, the B-flow technique is free of Doppler-related artifacts. By combining the benefits of these two techniques, CHA allows the harmonic signals resulting from tissue to be separated from those arising from contrast agents, and boosts the harmonic return from the contrast agents, while suppressing not only the fundamental, but also the harmonic signals from the background tissue (18-20). Hence, CHA is specifically sensitive to signals from the contrast agent, without producing any contrast-related artifacts. This high sensitivity to the contrast agent creates a sufficiently stimulated acoustic emission effect at only medium MI (0.6-0.8). Furthermore, such a condition, which is less destructive toward the microbubbles, provides a period of continuous scanning with excellent depiction of the mobile microbubbles in the intratumoral microvasculature.
In interval-delay scanning, the imaging process is interrupted for at least 10 seconds. This allows the entire vascular volume, in which the microvessels are included, to become filled with the contrast agent. When scanning begins after a short intermission, the accumulated microbubbles are destroyed, leading to the release of high-intensity, nonlinear echoes that are optimally detected using harmonic imaging. Stimulated acoustic emission does not rely on the movement of microbubbles and can be observed equally well with stationary microbubbles. Thus, this harmonic interval-delay method allows the detection of blood in the capillary bed, where the flow velocity is too low to be detected with conventional Doppler US flow techniques. In this way, gray-scale harmonic imaging can be used to detect echoes from contrast agents, when it is present in very low concentrations and distributed in microscopic vessels.
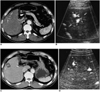
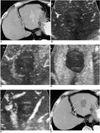
Before the injection of the contrast agent, a preliminary sweep was performed during suspended respiration in the optimal plane for the visualization of the lesion. This data was stored as a baseline cine loop. The machine settings, such as the focal zone and time-gain compensation, were optimized. Following this preliminary sweep, we obtained serial contrast-enhanced CHA images from 15 to 90 seconds after the initiation of the bolus contrast injection. We evaluated the vascularity within the ablation zones with a continuous scan starting between 15-30 seconds after initiation of the contrast injection, and lasting for 3-5 seconds. To evaluate the perfusion of the ablation zones, we also obtained intermittent stimulated acoustic emission imaging with a rapid sweeping technique every 10 seconds, from the end of the continuous scan to 90 seconds after initiation of the contrast injection. We used intermittent interval-delay scanning with 10-second intervals, in order to avoid bubble destruction and to maximize the stimulated acoustic emission. We froze the display in the interval between each scanning time, and then unfroze it for a very short period of time, during each scanning period. Thus, we obtained five or six intermittent stimulated acoustic emission imaging pieces during the perfusion scanning. Focal areas with irregular peripheral enhancement within the ablation zones were considered to be residual tumor portions (9, 14). In our recent report involving 81 HCCs (14), ten (12%) showed irregular peripheral enhancement at the margin of the ablation zone on contrast-enhanced CHA (Fig. 5). All of them were found to have the enhancing portion at the same location as that on the corresponding original image of the index tumor, during the hepatic arterial or portal venous phases on 1-month follow-up CT (Fig. 5). Contrast-enhanced CHA showed no evidence of enhancing foci, suggesting technical success in the remaining 71 (88%) of the 81 HCCs (Fig. 6). Among the 71 ablated HCCs without residual unablated tumors, either on CT or contrast-enhanced CHA, seven (10%) had follow-up CT findings of local tumor progression in the ablation zones.
Agent Detection Imaging (ADI)
ADI (Sequoia, Siemens Medical Solutions, Mountain View, Cal) is a multipulse technology that provides very high-resolution images, and uses the property of bubble emission to show regions where a contrast agent has localized (21). ADI appears to be more useful for detecting microbubble contrast in tumors than other harmonic imaging techniques. Because ADI uses two pulses with the same polarity and subtracts the signals from the two pulses, only those signals from the fundamental contrast agent and harmonic contrast agent remain. As such, ADI may be referred to as contrast-only imaging (21). Moreover, ADI allows us to review either the functional contrast-enhanced images, the anatomic tissue images, or both at the same time, all from the same scan. Accordingly, this capability of providing a segmented display on contrast-enhanced ADI is very useful for depicting the exact relationship between the index tumor (on the anatomic tissue image) and the enhanced residual tumor portion (on the image displaying tissue and contrast). ADI is less focus dependent compared with CHA. However, the relatively low frame rate of ADI might be a limitation.
The acoustic power of ADI was set at the default (maximal) setting (MI, 1.9). The line density and frame rate were set to a low level (9 Hz) with no frame averaging. Scanning was performed with a 4-1-MHz or 6-2-MHz convex array transducer. We obtained serial contrast-enhanced ADI images from 15 to 90 seconds after initiation of the bolus contrast injection. We evaluated the vascularity within the ablation zones using a continuous scan with a duration of 5-8 seconds, between 15 and 30 seconds after initiation of the contrast injection. To evaluate the perfusion of the ablation zones, we also obtained stimulated acoustic emission images with interval delay scanning and a rapid sweeping technique during the rest of the time. Each interval delay scanning was interrupted for at least 10 seconds.
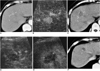
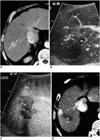
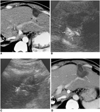
In our unpublished data concerning 52 HCCs, neither contrast-enhanced ADI the following morning nor 1-month follow-up CT showed evidence of enhancing foci within the 49 (94%) ablation zones (Fig. 7). In the remaining three (6%) ablation zones, irregular peripheral-enhancing foci were found on contrast-enhanced ADI (Fig. 8). All of these were found to have the enhancing portion at the same location as that of the corresponding lesions observed during the hepatic arterial or portal venous phases on the 1-month follow-up CT (Fig. 8). Among the 49 ablated HCCs without residual unablated tumors, either on CT or contrast-enhanced ADI, two (4%) had follow-up CT findings of local tumor progression in the ablation zones. A more recent report (13) also suggested that contrast-enhanced ADI was useful and as effective as CT for evaluating the therapeutic response to RF ablation and TACE in patients with malignant hepatic tumors (Fig. 9).
DISCUSSION
After RF ablation of liver cancer, it is very difficult to detect residual unablated tumors using conventional color Doppler or power Doppler US, because the internal blood flows of the patients are slow and the signals are weak. As previously described, contrast-enhanced US can improve the detection of residual tumors in the ablation zone. During and immediately after RF ablation, hyperechogenicity in the ablation zone caused by microbubbles produced by the ablation procedure is almost always observed, which makes it difficult to obtain an accurate assessment of the therapeutic efficacy in the treated lesion (Fig. 10) (9, 22). Thus, most physicians usually wait until this hyperechogenicity disappears from the ablation zone before performing contrast-enhanced harmonic US. This transient hyperechoic zone persists for a long period of time, which has been reported to range from 15 minutes to 6 hours (9, 22). It is difficult for physicians to wait for such a long period of time with the patient on the table, because of the inconvenience to the patient and the busy schedule in the US suite.
Dodd et al. (1) asserted that the ideal goal of RF ablation was the ablation of a 1-cm cancer-free ablative margin. However, it is practically impossible to obtain a satisfactory ablative margin when the tumor is located either in the subcapsular portion or in the vicinity of large vessels. The shape of the ablation zone is variable, often being round or ovoid, and sometimes has a complex configuration. After RF ablation, it is very difficult to accurately define a cancer-free margin on contrast-enhanced US. This may be possible only when the index tumor is well circumscribed within the ablation zone (Fig. 7).
The use of contrast-enhanced US after the RF ablation of liver cancer offers potential benefits over other imaging strategies. When the residual unablated tumor is depicted on contrast-enhanced US, additional ablation can be applied with precise targeting (guiding) of the residual unablated tumor (Fig. 11) (8, 12, 23). This real-time confirmation of the accurate and precise placement of the electrode cannot be accomplished with CT. Also, contrast-enhanced US is more convenient, less time consuming and less expensive, as compared with immediate follow-up CT. In addition to these considerations, early complications such as intraperitoneal hemorrhage can easily be found by means of US.
In spite of these numerous strong points, contrast-enhanced US after RF ablation presents several potential drawbacks. In effect, despite the cooperative training required to reduce the interobserver variability and bring the reproducibility to an acceptable level, contrast-enhanced US is intrinsically operator-dependent. This is especially true in interval-delay scanning in the same area, which is not easy for unskilled examiners to perform. Sufficient practice of interval-delay scanning must be acquired in the area that includes the ablation zone, before the injection of the contrast agent.
Furthermore, each contrast-enhanced US technique has its own weak location in the liver. Power Doppler US has blooming artifacts, and is susceptible to tissue motion artifacts. Thus, the use of contrast-enhanced power Doppler US is limited in patients whose ablated zone is situated in the left hepatic lobe and is due to cardiac pulsation (12, 14). Although it is possible to limit the number of motion artifacts by decreasing the color gain, this adjustment may also diminish the sensitivity required to detect slow flow signals within the residual unablated tumors. For contrast-enhanced gray-scale harmonic US, deep locations provide weak signals. Harmonic signals from a deep-seated lesion are often insufficient for acceptable imaging due to sound attenuation (18). In this study, we could not perform contrast-enhanced harmonic US in the case of those ablation zones that were located deeper than 10 cm in the liver.
CHA is focus dependent, because it has one focal zone. Moreover, the anatomical detail cannot be well demonstrated on contrast-enhanced CHA. ADI has a narrow temporal window, because it is set to a high MI. However, coupled with the development of newer US technologies, some new long-acting (stabilized) US contrast agents such as BR1 (SonoVue; Bracco, Milan, Italy) can improve the ability to detect smaller viable tumors in the ablated area using continuous scanning at a low MI (24).
In conclusion, contrast-enhanced gray-scale harmonic US, although it has some limitations, can constitute a reliable alternative to contrast-enhanced multiphase helical CT in the early assessment of the therapeutic response to RF ablation for liver cancer, when performed by experienced hands.
 XML Download