

 PDF
PDF ePub
ePub Citation
 Print
Print


Perfusion studies of the brain are mainly used to evaluate the hemodynamic status in an acute cerebral infarction. Typically, perfusion is quantified in terms of the blood flow normalized by the tissue mass (1). Recently, the perfusion images were quantified using various parameters, but a comparison of images and the absolute quantification has been impossible due to either differences in the modalities used or the use of methods based on different physical backgrounds, different image acquisition methods, or different post-processing software programs.
The modalities conventionally used for perfusion imaging are Xenon-CT and single photon emission computed tomography (SPECT). The regional cerebral blood flow (rCBF) measured by xenon-CT correlates well with the value measured using perfusion MRI (2), while the perfusion measured using SPECT does not (3). However, due to their poor spatial resolution, these modalities are unsatisfactory for clinical use.
Perfusion studies using MRI has increased recently. The perfusion images can be obtained using arterial spin-labeling without the need for the injection of a contrast medium (4, 5). However, this method has some clinical limitations. The most frequently used method of perfusion MRI, which measures various parameters, such as cerebral blood flow (CBF), cerebral blood volume (CBV), and mean transit time (MTT), involves the post-processing of a susceptibility-contrast echo-planar image (EPI) after injecting a contrast medium (6). This method provides good temporal and spatial resolution, shows real-time perfusion patterns, and provides information on the collateral circulation, even though it has limitations that depend on the modality and software programs used.
The Z-score is the ratio of the difference between the mean values of the activated and non-activated signals to the standard deviation of the signal. Therefore, it can be used as a threshold value to illustrate the difference between the signal intensity before and after the tasks in functional MRI (fMRI) (7, 8). In addition, it can be used to observe the changes in the signal intensity with the degree of perfusion throughout the brain, if the pre- and post-contrast images are processed using a low Z-score threshold.
This study assessed the feasibility of perfusion imaging of the brain using the Z-score and dynamic images obtained by subtracting the images taken before from those taken after contrast medium injection.
MATERIALS AND METHODS
Initially, 105 cases with different brain conditions (84 suspicious ischemic-infarctions, 13 post-trauma syndromes, 5 Moya-moyas and 3 brain tumors) were studied. This report present one patient with a normal MRI, and 4 patients each with Moya-moya, middle cerebral artery (MCA) occlusion, post-trauma syndrome, and a metastatic brain tumor, respectively.
A susceptibility-contrast EPI was acquired after a routine MRI (Magnetom Vision, Siemens Medical Systems, Erlangen, Germany) after a rapid manual injection of 0.1 mmol/kg Gd-DTPA. The parameters used for the EPI sequences are as follows: TR/TE: 0.8/29 msec, slice thickness: 6 mm, slice numbers: 10 per study, matrix: 128×128, FOV: 215×215 mm, acquisition: one, scan time: 1.32 sec per study, study numbers: 30, and total scan time: 40 sec.
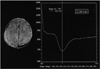
The standard program with the Magnetom Vision (VB33D, Numaris Application Manual) was used to post-process the perfusion images. The inflow and washout patterns were observed from the time-signal intensity curve of the region of interest (ROI) in 30 serial scans (Fig. 1). Repeated Z-score images of the peak and late phases were produced using the threshold Z-score values between 1.4 and 2.0 for four or five studies of the pre-contrast, peak, and late phases. The best image was selected as the perfusion image. The dynamic images were produced by subtracting the sequential post-contrast images from the pre-contrast image, and rearranging the levels in the same order. The sequential signal changes in the brain parenchyma were observed as a function of time, and the image were determined to be a perfusion image in the case of showing sequential signal changes. The dynamic changes in perfusion were observed on a video display. In addition, color mapping was performed on a personal computer using the pseudocolor mapping method in the π view software (Medison, Seoul, Korea). The reconstruction times for both methods were approximately 10 min each.
RESULTS
Perfusion images could be obtained easily using the Z-score, and the subtraction dynamic methods from the susceptibility contrast EPI before and after the contrast injection in all 105 cases, and one case from each different brain condition showing typical signal changes was selected.
A 10-year-old girl with a headache showed no abnormal findings on the routine MRI. The peak Z-score image showed good perfusion in the cortex, and the late Z-score image showed that the cortical perfusion had washed-out with perfusion in the deep white matter, periventricular area, and cortical veins. The subtraction dynamic images revealed an even wash-in and washout of the contrast medium from the cortex to the deep white matter through the peak to late phases with no background noise.
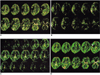
A 26-year-old female with an arrhythmia showed a right MCA occlusion on magnetic resonance angiography (MRA) and high signal intensity in the right basal ganglia on the diffusion-weighted images. The peak Z-score image indicated perfusion defects in the right posterior frontal and temporal lobes as well as in the basal ganglia (Fig. 2A). The late Z-score image showed delayed perfusion in these same areas, except for the basal ganglia (Fig. 2B). The subtraction dynamic images revealed an initial decrease in perfusion with delayed and persistent perfusion in the right frontal, temporal, and basal ganglia areas (Fig. 2C). The subtraction images from the peak and late phases were added in order to observe the extent of the perfusion defect, which appeared only in the right basal ganglia (Fig. 2D) and was consistent with the diffusion-weighted image.
In a 7-year-old girl with Moya-moya disease, the T2-, T1-, and diffusion-weighted images showed no evidence of an infarction, but did show a marked narrowing of the distal internal carotid artery as well as many collateral vessels bilaterally on MRA. The peak Z-score image indicated a perfusion defect in the MCA territory of the left frontal and parietal areas, and the late Z-score image showed delayed perfusion in those areas. The subtraction dynamic images revealed markedly delayed perfusion in the left MCA territory after the peak phase with no background noise.
A 20-year-old female who suffered a diffuse axonal injury one year prior displayed mild brain atrophy and marked signal loss in the body of the corpus callosum on the T2-weighted images due to a previous hemorrhage. The peak and late Z-score images showed a generalized decreased perfusion in the brain as well as inhomogeneously decreased perfusion in the frontal area and corpus callosum. The subtraction dynamic images indicated decreased perfusion in the frontal deep white matter and corpus callosum.
A 60-year-old male who suffered a metastatic brain tumor from lung cancer had a rim-enhanced mass in the right occipital area. The peak Z-score image showed increased perfusion, and the late Z-score image indicated persistent perfusion along the tumor wall. The subtraction dynamic images also indicated increased, persistent perfusion along the tumor wall with no background noise.
DISCUSSION
Brain perfusion studies are helpful for evaluating ischemic disease by providing information on the perfusion state, and various diagnostic modalities with several parametric variables have been used (2, 3). However, the resulting perfusion images are confusing due to differences in the mechanisms used to acquire the image, the distribution compartments of the contrast medium, the contrast injection time, and the interval between the contrast injection and the start of the scan, which depend on the modalities and software programs provided by the venders. Therefore, it is essential to develop new, more standardized, clinically useful perfusion imaging methods for different diseases that can cause perfusion abnormalities.
Of the modalities used for perfusion studies, MRI is the most appropriate because it has a short acquisition time (about 1 sec), which allows for frequent repeated scans, and the capability of scanning the whole brain simultaneously to observe each compartment and the wash-out process during the first pass of the contrast. The most widely used perfusion study is the T2* or EPI sequence after injecting the contrast medium, which causes local susceptibility differences that affect the signal intensity. Although a contrast enhancement is not equivalent to a perfusion abnormality (9), the perfusion images thus obtained provide important supplementary information about the brain tissue with impaired perfusion (10), and can help in predicting the risk of lesion enlargement in the case of a perfusion/diffusion mismatch (11). Perfusion studies are also useful in predicting the pathological grade of a brain tumor (6, 12, 13) and in assessing the tumor activity during anti-angiogenic treatment (14) or radiation therapy (15). A perfusion study combined with MR spectroscopy can distinguish between high-grade gliomas and solitary metastases (16) and can detect residual or recurrent tumors in patients with treated gliomas (17).
These quantitative perfusion studies involve a first-pass bolus tracking of the contrast medium based on the dephasing effect of the extravascular protons by a blood pool agent. Perfusion can be quantified by measuring the concentration of the contrast medium in the ROI using the indicator dilution theory, which analyzes the MR signal from the tissues and numerical simulations (2, 18), and by calculating the gamma-variate curve from the time-signal intensity curve (9) and the arterial input function from the MCA (3). The relationship between the concentration of the contrast and the accompanying changes in the transverse relaxation rate shows different patterns in the tissues studied as well as in the reference artery, which can be used to measure the CBF, CBV, and residue function. The error depends on the nature of the microvasculature, the properties of the contrast agent, and the weights of the compartments in the total signal (18). It is also necessary to use a correction process with a two-compartment kinetic model in order to account for the extravasation of the contrast during bolus passage (19). In a single-shot EPI sequence, an iron-induced susceptibility effect may lead to an underestimation of the rCBF or regional cerebral blood volume in the basal ganglia (20), and the CBV and MTT values can show differences in precision and accuracy according to the post-processing methods used for the perfusion imaging (21). Consequently, there are many fundamental limitations in quantifying the flow. Of the parameters examined, the CBF and MTT were more sensitive to the areas with a perfusion defect in a hyperacute infarction than was the CBV (22). The flow heterogeneity (FH) was more helpful in estimating the permanent infarction area as a consequence of the high false-positive rate of the MTT (23). In addition, the relative recirculation (rR) might serve as a surrogate marker in trials of anti-angiogenic therapy in gliomas (24).
The Z-score is used as a threshold for detecting the activation area in fMRI (7, 8). Therefore, the Z-score image represents the all-or-none pattern signals on a pixel-by-pixel basis by showing only the signals that exceed a certain threshold value. The quality of the perfusion image depends on the Z-score value and might not clearly express the perfusion difference if it is not prominent. The first pass of the contrast lasts for 10 to 20 sec from the time of arrival to the washout of the contrast medium, depending on the patient's age and condition. Therefore, images for a specific period cannot represent the pattern and degree of perfusion. For that reason, Z-score images will be of poor quality, and if the grouping is inappropriate or if delayed perfusion is not considered, the portion or degree of the perfusion defect can differ from the true perfusion status.
The subtraction dynamic images derived from the pre- and post-contrast EPI were of sufficient quality with no background noise and clearly showed the temporal changes in the perfusion, particularly the delayed perfusion through the collateral circulation. Moreover, adding the peak and late subtraction images revealed the true extent of the perfusion defect (Fig. 2D). In the near future, the development of a simplified computer program will allow these methods to be used to simplify a study of perfusion. The aim of this study was not to compare these methods with others, but rather to evaluate the potential of uses of these methods in order to obtain perfusion images. Therefore, these methods and the resulting images were presented in order to suggest that they can be used as perfusion images in the absence of available commercial programs.
In summary, perfusion images of the brain were obtained easily using the Z-scores and the subtraction dynamic method from the susceptibility-contrast EPI sequence. The peak and late Z-score images showed the degree of local perfusion well. However, the image quality depended on the threshold value of the Z-score, and the perfusion pattern changed with the grouping of the studies. Moreover, multiple post-processing was sometimes required either with different threshold values or with different groupings, and the perfusion defect could be exaggerated if delayed perfusion was not considered. The subtraction dynamic images revealed the area and the degree of the delayed perfusion well with no background noise, showing the dynamic sequential changes in the perfusion more clearly. The precise area of the perfusion defect also could be observed accurately by adding the peak and late subtraction images. These methods were not quantitative, but it is believed that these images showed a better anatomic and contrast resolution than the reported perfusion studies, and they showed the perfusion status well in the different brain diseases examined.
In conclusion, the Z-score and subtraction dynamic images showed the degree of perfusion and the sequential changes in the perfusion pattern, respectively. These methods should be adopted as new complimentary methods for observing the perfusion patterns in various brain diseases.
 XML Download