

 PDF
PDF ePub
ePub Citation
 Print
Print


In recent years, low-dose spiral CT has been used as a screening tool for lung cancer detection (1-3). The analysis of CT images in the detection of lung nodules is a demanding task and one that is repetitive and burdensome, and -since it mostly involves the inspection of normal images - oversight errors are likely. Because of incorrect nodule identification, lung cancers are, in fact, likely to be missed. According to published reports, over looked nodules were typically small (of the order of 4-6 mm), faintly attenuated, adjacent to vessels, and occurred in patients in whom tuberculosis had previously been detected (4, 5).
Computer-aided diagnosis (CAD), which uses the output from a computerized analysis of medical images as a "second opinion" in detecting and characterizing lesions, following up pathologic findings, and making diagnostic decisions, is expected to improve the interpretation component of medical imaging (6). During the past decade, advances in CAD have accelerated, with application of this technology to mammography, chest CT (particularly for screening), and CT colonography. Various investigators have developed a number of methods for the automated detection of lung nodules at CT (7-14), and CAD may be a viable alternative to double reading for the detection of lung cancer on CT images.
The purpose of this study was to evaluate a self-developed CAD system for the automated detection of lung nodules at low-dose CT.
MATERIALS AND METHODS
Imaging Data
The database used in this study consisted of 50 consecutive low-dose thoracic helical CT scans obtained without the administration of contrast material in 50 subjects [M:F=45:5; age range, 40-80 (mean, 52) years] who participated voluntarily in a lung cancer screening program conducted between January 2000 and December 2001.
For 37 scans, a Somatom Plus-4 scanner (Siemens, Erlangen, Germany) was used, with the following parameters: 38-mAs tube current, 120 kVp, 8-mm collimation, 16-mm table feed per rotation, and an 8-mm reconstruction interval. For the remaining 13, a HiSpeed scanner (General Electric Medical Systems, Milwaukee, Wis., U.S.A) was employed, and the settings were as follows: 50-mAs tube current, 120 kVp, 7-mm collimation, 14-mm table feed per rotation, and a 7-mm reconstruction interval. The data provided by the 50 scans comprised a total of 2,583 section images (after sections representing anatomic areas inferior to lung bases were manually excluded from each scan), and there were 41-77 (mean, 52) sections per scan. These data were not used in developing the classification rules of the CAD system.
Automated Nodule Detection Method
First, using the CT image pertaining to each slice, the lung was segmented. Since CT values are lower for the lung region than for the chest wall, lung regions were identified using the gray-level threshold technique. Next, external regions of the body were eliminated using the connected component labeling technique and the background elimination algorithm. The remaining lung regions contained high-CT-number parts such as nodules, vessels, and parts of the chest wall. To delineate the lung, vessels, nodules, and normal parts depicted on binary images, the edge detection technique was used, and by employing the contour- following technique, lung contour was then determined. By means of the filling technique, regions within the lung contour were selected as lung regions.
However, this segmentation method, based on the thresholding technique, cannot include nodules or vessels in contact with the chest wall, and to compensate for this error, a bridging algorithm was implemented along each lung segmentation contour. After calculating the convexity of each point on this contour, an imaginary bridge was successively placed tangential to each contour point. The indentation was bridged by a new contour segment that linearly connected its endpoints, and the image pixels newly encompassed by the contours were included within the lung segmentation regions.
A lung region comprised an air cluster and a cluster of other organs, and to determine whether a structure was a nodule candidate, the gray-level threshold technique was applied. Most extracted nodule candidates were in vessel regions, and in order to classify vessels and nodules, the shape and gray value of each nodule candidate was considered. A lung nodule was generally spherical, and on a slice image was depicted as a circle, while vessels parallel to a slice image were seen to be oblong and were easily identified. A vessel perpendicular to a slice image, however, also appeared as a circle, and its 3D (three-dimensional) features thus had to be determined. For efficient detection, we reconstructed 3D CT data from each CT slice, handling only this data. Nodule candidates were extracted by 3D region growing, and each was labeled using the connected component labeling technique. In each candidate, volume, elongation factor, and compactness were calculated, where volume is the voxel number of the nodule candidate, elongation factor is the ratio of the long axis to the short, and compactness is the ratio of candidate volume to bounding box volume (the volume of an imaginary box that contains the nodule candidate), and these parameters characterized the 3D shape of a nodule candidate. Although nodules and blood vessels may both appear circular on 2D (two-dimensional) slices, their 3D shapes are different. Nodules are sphere-like and highly compact, while blood vessels are tube-like and much less compact.
When a CT data set is analyzed in this way, nodules are detected automatically and regions labeled as nodules are highlighted on the images for review by a user.
Reader and CAD performance
We compared the results of the initial report, the second look review by two chest radiologists, and those obtained using the CAD system, and a gold standard was established by reviewing all these results.
All CT studies were routinely reported using softcopy viewing which included the cine mode. Axial softcopy images were viewed stepwise and in cine mode on a conventional Windows-based workstation with commercially available M-view software (MaroTech, Seoul, Korea) and a 21-inch DR110 monitor (Dataray, Denver, Col., U.S.A.) with a resolution of 2,048×2,560×8 bits. The initial report detailed by one chest radiologist (J.G.I or J.M.G) as to the number, size, and location of the nodules; after this routine reporting procedure, two chest radiologists (J.M.G., H.J.L.) reviewed the findings, reaching their conclusions by consensus. At that time, they were aware of the location of the nodules mentioned in the initial report. The readers' experience in chest CT ranged from 6 to 27 (mean, 15) years. For implementation of the CAD system, a personal computer (Pentium II, 1 GB RAM, Windows 2000) was used, and to assess the performance of the system, data sets were input. Anatomic structures were successfully segmented and candidate nodules identified. The two radiologists who participated in the second look review analyzed these findings again, using both the conclusions they had drawn from their review and the results obtained using the CAD system. After this repeat analysis (the committee stage), the data relating to nodules considered def were used to establish the gold standard.
Because our preliminary CAD system was optimized for thin-section CT data sets, the detection of small nodules was poor when using relatively thick-section CT data. Thus, only nodules greater than 5 mm in diameter were included in performance analysis.
The performance of the CAD system was evaluated with regard to its sensitivity in terms of nodule detection and the number of false-positive findings per case, criteria which were also used to compare the performance of the radiologists. Missed nodules were classified as either a detection error (not mentioned or not noticed by the radiologists) or an interpretation error (mentioned or noticed, but not regarded as a nodule). We also reviewed the causes of false-negative findings, and measured the processing time for the CAD system.
RESULTS
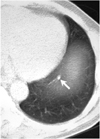
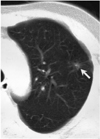
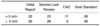
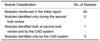
The results are summarized in Tables 1 and 2. Forty nodules were initially detected, and their mean diameter was 7.2±5.0 (range 3-24) mm. Individual diameters were ≤ 5 mm (n=20), 6-10 mm (n=12), or > 10 mm (n=8). At second look review, nine additional nodules were detected; the diameter of six of these was ≤ 5 mm, and that of the remaining three was 6-10 mm. After reviewing the CT data using the CAD system, three nodules were added to the gold standard (Fig. 1). Of the three nodules additionally identified during the second look review, one was detected by the CAD system (Fig. 2); compared to the initial report, a total of four additional nodules were detected by the CAD system. Thus, by applying the gold standard, a total of 52 nodules were identified (diameter ≤ 5 mm: 26; diameter > 5 mm: 26).
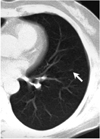
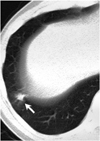
For the detection of nodules greater than 5 mm, the sensitivity rate was 77% (20 of 26) initially, and 88% (23 of 26) at the second look review. In the initial report, four of six nodules were missed because of a detection error (Fig. 3) and the other two because of an interpretation (Fig. 2). During the second look review, one was missed due to a detection error (Fig. 1), and two because of misinterpretation. The CAD system, without any user interaction, achieved a sensitivity of 65% (17 of 26) for nodules >5 mm in diameter. False-negative findings arose for the following reasons: six nodules were seen on only one slice (Fig. 3); one was elongated; one was less compact than the others (Fig. 4); and in one, attached to the pleura, a segmentation error was involved. One nodule, rejected the by CAD system becaused it was less compact, but accepted as a nodule at further review, was no longer visible at follow-up low-dose CT performed six months later, and was thought to be focal pneumonia (Fig. 4). There were 8.0±5.2 false-positive CAD results per CT study (total, 422 false-positive findings). The processing time of the CAD system, including the loading of images, image segmentation, preparation of 3D volume data, and analysis of 3D nodule candidates, was approximately 60 seconds.
DISCUSSION
The goal of lung cancer screening with CT is the detection of small cancers, presumably when they are in the biologically early stages of their evolution. Low-dose CT has been shown to have a higher sensitivity for small pulmonary nodules, which are believed to be the most common presentation of early lung cancer (1-3).
Nodule detection is one of the challenges of CT imaging; nodules may be missed at CT because of their small size, low relative contrast, or location within an area of complex anatomy (4, 5). Li et al. (5) recently described the characteristics of missed lung cancer in a large low-dose screening trial: 32 (39%) of 83 primary lung cancers detected in an annual program and depicted on 39 CT scans were missed. Detection errors were responsible in approximately 60% of cases and interpretation errors in the remaining 40%. The various factors which affect nodule recognition during screening include reader experience and variability, CT technique and viewing conditions, and nodule characteristics. Where a large number of results are normal, fatigue also plays a major role. Although double readings reduce the number of missed nodules, routine double reading is unrealistic in clinical practice; CAD, however, may be a viable alternative. Armato et al. (15) stated that lung cancer cases which had been missed were detected by the CAD system with a sensitivity of 84% and a false-positive rate of 1.0 per section.
In our study, a relatively small number of cases in which data were obtained using single-section scanners were tested. These were, however, independent cases that were not used in developing the CAD system. In addition, the gold standard was established visually by reviewing both the results of the radiologists' readings and those obtained using the CAD system, rather than on the basis of pathologic findings. It has been demonstrated that inter- and intra-observer variability in nodule detection affects the number of nodules identified. Wormanns et al. (16), for example, demonstrated that of a total of 230 nodules found by either of two readers on 5 mm sections at 3-mm reconstruction intervals, 66 (29%) were graded as definite by one reader but missed by the other. Also, the number of overlooked nodules and false-positive diagnoses differs between readers of differing experience. In our study, two nodules not included in the initial report and two missed during the second look review were misinterpreted, suggesting that it is difficult even for experienced radiologists to agree whether an opacity should be considered a nodule. Interestingly, one nodule, rejected by the CAD system but accepted as a nodule by the committee, was no longer visible at follow-up low-dose CT performed six months later, suggesting that the committee's decision was wrong. The criteria for the labeling of opacities as nodules are evolving in ongoing studies of lung cancer screening and computer-aided diagnosis; because the performance of CAD systems is evaluated on the basis of radiologists' decisions and by using different data sets, it may be hard to compare the performance of different systems.
Our CAD system was originally developed for thin-section CT data; nodules visible on only one slice were not detected in our study, a fact that explained most of our false-negative findings. A small number of knowledge-based schemes which aim to automate lung nodule detection at CT are under development; their reported sensitivity has ranged from 38% to 86%, with false-positive rates 5.8 per study and 5.5 per slice (9, 10, 12, 13). These systems have been developed for thick-section (5-10 mm) imaging and have been designed and tested with lesions that are typically 5 mm or more in diameter. For nodules smaller than this, volume averaging using thick sections makes automated detection difficult. Although we measured performance for nodules larger than 5 mm, our results are within the range of previous studies. Brown et al. (14) recently reported that for a CAD system utilizing thinsection CT data, the results were promising. As multi-detector row CT becomes increasingly popular, large volumes of data must be interpreted, but if CT screening for lung cancer becomes routine, the time required to interpret large sets of thin-section data will be prohibitive and the development of computer-assisted nodule detection schemes will thus be essential. When our current system was applied to thin-section CT data, it detected nodules less than 3 mm in diameter (results not shown).
The results of the present study are preliminary, since the system is still under development. Although its sensitivity was relatively low, four nodules not mentioned in the initial report were identified. For fully effective screening, however, sensitivity that is high enough for nodule detection and a false-positive rate low enough to result in few distractions are essential requirements.
In conclusion, our preliminary results indicate that a CAD system may improve the detection of pulmonary nodules at low-dose CT.
 XML Download