

 PDF
PDF ePub
ePub Citation
 Print
Print


Ferumoxides, superparamagnetic iron oxide particles coated with dextran, is a tissue-specific magnetic resonance (MR) imaging contrast agent used for the detection of hepatic tumors. Particulate substances administered intravenously are cleared by phagocytosis of the reticuloendothelial system, including the Kupffer cells of the liver, substantially shortening T2 of liver tissue (1, 2). Most focal hepatic lesions, particularly malignant tumors, are devoid of Kupffer cells, and ferumoxides improves contrast between lesions and liver tissue (3-5). In a recent study, the conspicuity of nodular lesions in cirrhotic liver correlated closely with differences in the number of Kupffer cells between liver parenchyma and nodular lesions (6).
Computed tomography during arterial portography (CTAP) is considered a highly sensitive imaging modality for the preoperative detection of hepatic malignancy, with reported sensitivities ranging from 81 to 93% (7-10). Unfortunately, CTAP, despite its high sensitivity to the presence of lesions, has major disadvantages: an invasive procedure that necessitates angiography, and a high false-positive rate (11). Ferumoxides-enhanced MR imaging has been increasingly used for the detection of focal hepatic lesions, and the initial results have been encouraging (12-18). T2-weighted spin-echo (SE) and T2*-weighted gradient-echo (GRE) sequences are regarded optimal for the detection of primary and secondary hepatic malignancies at ferumoxides-enhanced MR imaging (1, 12, 15, 19-24). To our knowledge, however, there have been few studies involving the use of various pulse sequences such as newly developed breath-hold, fast MR imaging techniques such as single-shot fast SE (SSFSE), fast multiplanar gradient-recalled acquisition in the steady state (GRASS) without preparation pulses (FMPGR), and fast multiplanar spoiled GRASS (FMPSPGR) (25, 26).
The purpose of this study was to identify the optimal pulse sequence for the detection of hepatocelluar carcinoma (HCC) at ferumoxides-enhanced MR imaging.
MATERIALS AND METHODS
Patients
Between April and August 1999, 22 consecutive patients underwent ferumoxides-enhanced MR imaging to assess known or suspected focal liver lesions. The criteria for inclusion in this study were as follows: HCC was depicted at contrast-enhanced CT, lesions were distributed in such a way that they were resectable, and the patient was considered suitable for curative hepatic resection. On this basis, five patients were excluded because HCCs were absent (metastatic adenocarcinoma was found in two, and each of cholangiocarcinoma, hepatic adenoma, and hemangioma in one), and one other because HCCs were distributed diffusely. The remaining 16 patients, 14 men and 2 women ranging in age from 35 to 66 (mean, 51) years, with 25 HCCs (diameter, 3-140 [mean, 41] mm) in 24 hepatic segments comprised our final study group. Ferumoxides-enhanced MR imaging was not performed where patients were pregnant, showed severe renal failure, or were allergic to dextran-based drugs. The study was approved by the institutional review board, and written informed consent was obtained from all patients.
For 19 HCCs in 11 patients, diagnosis was based on the histopathological findings of surgery; for two, on those of US-guided percutaneous needle biopsy; and for the remaining four, the basis of confirmation was an elevated serum α-fetoprotein level (over 200 ng/mL) and characteristic helical CT findings. Thirteen patients in the study had liver cirrhosis as a result of hepatitis B (n=12), or hepatitis C (n=1), while the remaining three had hepatitis B without cirrhosis. In order to evaluate hepatic segments which according to the findings of ferumoxides-enhanced MR imaging were HCC-free, follow-up radiologic examinations (contrast-enhanced CT or gadolinium-enhanced MR imaging) were performed no less than 12 months later. HCC did not develop in those segments during the follow-up period.
MR Imaging Examinations
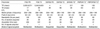
All MR examinations were performed on a 1.5-T MR imager (Horizon, GE Medical Systems, Milwaukee, Wis., U.S.A.) using a phased-array coil. Two respiratory-triggered FSE sequences (TR3333-8571/TE18 and 90-117/ETL12/NEX2/fat sat.), four breath-hold sequences (proton density SSFSE [TR∞/TE39/NEX0.5], T2-weighted SSFSE [TR∞/TE98/NEX0.5], FMPGR [TR130/TE8.4-9.5/flip angle 30°], and FMPSPGR [TR130/TE8.4-9.5/flip angle 30°]), and the GRASS sequence (TR216/TE20/flip angle 60°) were performed using the parameters shown in Table 1. Transverse sections were obtained with a rectangular field of view (six-eight), a slice thickness of 6-8 mm, and an interslice gap of 2 mm. To minimize motion artifact during gradient-echo sequences, saturation bands superior and inferior to the imaging volume were applied to all sequences. Fat saturation was used during proton density and T2-weighted FSE and SSFSE sequences.
The patients underwent respiratory-triggered proton density and T2-weighted FSE imaging, with repetition times varying between 3,333 and 8,571, and between 3,240 and 8,620 msec, according to the period of the respiratory cycle. At T2*-weighted FMPSPGR and FMPGR, multiple sections were obtained in an interleaved fashion, and the whole liver was covered with 20 sections using two breath-holds.
Ferumoxides (Feridex IV; Advanced Magnetics Inc., Cambrige, Mass., U.S.A.) at a dose of 15 µmol Fe/Kg was diluted in 100 ml of 5% glucose solution and administrated intravenously through an in-line 5-µm specific filter over a 30-minute period. MR images were obtained 30 minutes after the end of infusion.
Quantitative Imaging Analysis
The images obtained during each of the seven pulse sequences were quantitatively analysed using operator-defined region-of-interest (ROI) measurements of the mean signal intensity of liver parenchyma, lesions, and background noise. For the measurement of liver signal, ROIs were set in areas devoid of focal changes in signal intensity, large vessels, and prominent artifact. If more than one HCC was present, the largest representative lesion was identified and measured at all sequences. For liver lesions, circular or ovoid ROIs were drawn to encompass as much of the lesion as possible. Noise was measured on each image using ROIs positioned just ventral to the right anterior abdominal wall; areas with the most prominent ghost were not included. ROIs were drawn electrically, and were larger than 256 mm2 in the liver, 45 mm2 in lesions, and 846 mm2 in the noise area; they were drawn three times in each place and mean values were obtained. The lesion-to-liver contrast-to-noise ratio (CNR) was calculated using the following formula: (signal intensity lesion - signal intensity liver)/standard deviation of background noise. Lesion-to-liver CNR was compared statistically using Wilcoxon's signed ranks test.
Qualitative Imaging Analysis
Two readers unaware of the patients' clinical data assessed the image quality obtained during each of the seven MR sequences. Each reader graded image quality as unacceptable, poor, fair, good, or excellent (with numerical scores of 1, 2, 3, 4, or 5, respectively) with regard to lesion conspicuity and image artifacts (5 = absent). Inter-reader agreement was assessed using a κ statistic: a κ score of more than 0.60 was taken to indicate substantial to excellent agreement (27). Discrepancies were resolved by consensus between the readers, and the final ranking data based on consensual interpretations were compared by means of Wilcoxon's signed ranks test.
ROC Analysis
All MR images of the 16 patients were randomized and reviewed independently by three readers experienced in MR imaging of the liver. For each pulse sequence, they recorded the number, size, and segmental location of HCCs. The name, age, identification number and imaging parameters of each patient were masked to minimize learning bias, and MR images of each pulse sequence were reviewed on a segment-by-segment basis during sessions separated by two weeks. To prevent mislocation of the lesion by the readers, hepatic segments were drawn directly by the study coordinator according to Couinaud's numbering system. A total of 128 hepatic segments were reviewed, including 24 segments with 25 HCCs. The readers scored each image for the presence or absence of HCCs and assigned one of five confidence levels, as follows: 1 = definitely or almost definitely absent, 2 = probably absent, 3 = possibly present, 4 = probably present, 5 = definitely or almost definitely present. When a lesion was located in two or more segments, the readers were asked to consider only the segment mainly involved and to assess the possibility of another lesion in the other segment. A binomial ROC curve was fitted to each reader's confidence rating using a maximum-likelihood estimation. The diagnostic accuracy of each MR sequence determined by each reader was evaluated by calculating the area under the ROC curve (Az). Composite ROC curves that combined the performance of all readers into a single curve were obtained for each MR sequence, using the maximum-likelihood curve-fitting algorithm to rate the pooled data of the three readers (28, 29). The differences between MR sequences in terms of mean Az were statistically analyzed using the two-tailed Student t test. The relative sensitivity of each sequence was calculated according to the percentage of segments assigned a score of 3 or greater ('possibly present' to 'definitely present') among a total of 24 segments with HCC. Relative specificity calculations were based on the percentage of segments assigned a score of 1 or 2 among 93 segments without HCC. Using a κ statistic, inter-reader agreement regarding the detection of segments with HCC was also assessed (27). Ten hepatic cysts were diagnosed by sonography and CT, and excluded from analysis after the review was complete.
RESULTS
Quantitative Analysis
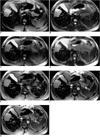
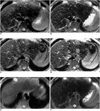
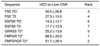
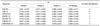
The quantitative results of assessment of mean HCC-to-liver CNR obtained during each pulse sequence are shown in Table 2. The highest CNR was achieved with breath-hold T2*-weighted FMPGR sequences (68.9 ± 25.0); this ratio was statistically significantly higher than those obtained during all other sequences except breath-hold T2*-weighted FMPSPGR (p < .05) (Fig. 1). The ratio obtained during this sequence was the second highest and was statistically significantly higher than those recorded during the sequences ranked 4 to 7 (p < .05).
Qualitative Analysis
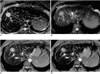
Table 3 summarizes the results of qualitative analysis for each sequence. HCCs were statistically significantly clearer at proton density and T2-weighted FSE, and at all three types of gradient-echo imaging than at the two SSFSE sequences (Fig. 2).
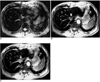
T2*-weighted GRASS imaging depicted imaging artifacts more prominently than did the other six sequences, and image interpretation was interfered with in 63% of cases (10/16) (Table 3). T2*-weighted GRASS imaging demonstrated pulsation artifacts due to heartbeat in all 16 patients (Fig. 3), motion-related artifacts were evident at proton density and T2-weighted FSE imaging in 63% (10/16) and 50% (8/16), respectively. All T2*-weighted FMPGR and FMPSPGR imaging showed ghost artifacts due to aortic pulsation in the phase-encoding direction, but proton density and T2-weighted SSFSE imaging revealed no such artifacts. Overall, the imaging artifacts of the six sequences other than T2*-weighted GRASS were comparable. The lowest κ score for interobserver agreement between readers was 0.712, and was for proton density SSFSE imaging which depicted lesion conspicuity. Hence, agreement regarding lesion conspicuity and imaging artifacts was considered substantial to excellent for all sequences.
ROC Analysis
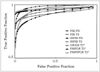
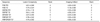
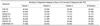
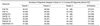
Table 4 shows the calculated areas under the ROC curves and the mean area determined by the three readers for each of the seven sequences. ROC curves drawn on the basis of pooled data from the three readers for each of these sequences are shown in Figure 4. With regard to lesion detection, two readers performed significantly better with the T2*-weighted FMPGR, T2*-weighted FMPSPGR, and proton density FSE sequences than the other four. One reader's interpretation of the seven sequences demonstrated no statistically significant differences in lesion detection. In terms of integrated lesion detectability on the basis of the pooled data reviewed by all observers, T2*-weighted FMPGR, T2*-weighted FMPSPGR, and proton density FSE imaging were statistically superior to those obtained using the other sequences (Fig. 5). The mean areas under the composite ROC curves of the three readers were 0.965 ± 0.015 for T2*-weighted FMPGR sequences, 0.964 ± 0.016 for T2*-weighted FMPSPGR, and 0.958 ± 0.017 for proton density FSE.
The relative sensitivities of T2*-weighted FMPGR, T2*-weighted FMPSPGR, and proton density FSE imaging were superior to those obtained using the other sequences (Table 5). Expressed as a percentage, the relative specificity of all sequences was 93 or more (Table 6). The lowest κ score for interobserver agreement was 0.690, and involved T2-weighted FSE imaging between reader 2 and reader 3. Agreement was thus considered substantial to excellent for all sequences.
DISCUSSION
The acquisition of high-quality images in the shortest possible time has been a major field of investigation in MR imaging of the liver. According to recent reports, ferumoxides-enhanced MR imaging is useful for the detection of hepatic tumors, including metastasis (5, 12, 15, 22) and HCCs (3-5, 24), and investigators have also claimed that it is as accurate as CTAP for detecting hepatic metastasis (12) or HCC (11).
T2-weighted SE and T2*-weighted GRE are accepted ferumoxides-enhanced MR imaging sequences (13, 24, 30, 31). At GRE imaging after intravenous ferumoxides administration, signal loss of liver parenchyma is increased by the presence of iron oxide particles because of its greater susceptibility resulting from local field inhomogeneity (intravoxel dephasing) (21, 32). Fretz et al. (21) found that GRE imaging with long TE and a narrow flip angle was an ideal T2*-weighted sequence.
Yamamoto et al. (24) reported that HCC detection was similar at ferumoxides-enhanced T2-weighted SE and GRE imaging. In a study by Schwarz et al. (32), conventional SE was found to be superior to FSE due to the absence of a 180° refocusing pulse. However, because FSE sequences are less sensitive to motion artifacts, and the decrease in liver signal noted at FSE is comparable to that observed at conventional SE, FSE sequences are, according to a recent report (33), clinically useful for ferumoxides imaging. Van Beers et al. (23) claimed that ferumoxides-enhanced GRE imaging was as accurate as T2-weighted SE imaging for the detection of malignant hepatic tumors and was superior for determining their segmental location. However, the optimal imaging sequence for lesion detection with ferumoxides enhancement is still open to debate.
Our results indicate that HCC-to-liver CNR was best at T2*-weighted FMPGR sequence, for which the ratio was statistically significantly higher than for all other sequences except T2*-weighted FMPSPGR. One possible reason for the lower CNR found with FSE and SSFSE imaging is that a larger matrix is used for these sequences; this contributes to the sharpness of lesion contour, but leads to low lesion-to-liver CNR. The predominance of T2*-weighted imaging is, however, thought to be caused mainly by local field inhomogeneity and the lack of a refocusing pulse (21, 32). Low CNR at T2*-weighted GRASS results from the high noise level of this sequence.
Because of poor soft-tissue resolution due to the T2 filtering effect, lesion conspicuity at SSFSE imaging was statistically significantly less clear than at other sequences. Motion-related artifacts were significantly less severe with T2-weighted and proton density SSFSE, T2*-weighted FMPGR, and T2*-weighted FMPSPGR imaging, mainly because of their short acquisition time, which allows successful breath-holding (34).
In terms of lesion-to-liver CNR, lesion conspicuity and artifacts, T2*-weighted imaging was the best sequence, though vascular structures and HCCs were similarly demonstrated with a (bright) high signal. At FSE, on the other hand, vascular structures were less bright than HCCs (Figs. 1, 2, 5).
In ROC analysis, the area under the composite ROC curve indicates performance. With regard to integrated lesion detectability, T2*-weighted FMPGR, T2*-weighted FMPSPGR, and proton density FSE imaging were statistically superior to other sequences. The difference in performance among MR sequences was more prominent for small HCCs because these can demonstrate active uptake of ferumoxides particles, which results in slight hyperintensity, isointensity, or even hypointensity at ferumoxides-enhanced imaging (6).
Ferumoxides-enhanced MR imaging does not always facilitate differentiation between malignant tumors and benign lesions. Oudkerk et al. (13) recommended T1-weighted GRE (short TE) imaging after ferumoxides enhancement in order to detect and characterize focal liver lesions. Cysts can demonstrate low signal intensity at T1-weighted imaging, and at ferumoxides-enhanced imaging, T1-weighted sequences may permit good differentiation between malignancy and cysts. Due to the T2 effect, however, cysts can show high signal intensity at gradient-recalled echo sequences with long TE. According to Grangier et al., hemangiomas can be enhanced by shortening the T1 relaxation time at T1-weighted imaging after ferumoxides administration (35).
This study suffers certain limitations. First, while the standard of reference is the findings of histopathological analysis of 41 resected hepatic segments in 11 patients, follow-up imaging findings were used as the standard of reference for 87 unresected segments. Second, in the segments containing two hepatocelluar carcinomas or a hepatocelluar carcinoma and a benign lesion (13%, n=3), segment-by-segment analysis meant that comparisons for these particular lesions could not be made. Third, it was only in the detection of HCCs that optimal pulse sequences for ferumoxides-enhanced MR imaging were evaluated: optimal sequences for the characterization of focal hepatic lesions could not be determined. Finally, unenhanced MR imaging was reported to be necessary in order to decrease the number of false-positive findings attributed to vascular structures. However, "biphasic" unenhanced and ferumoxides-enhanced MR imaging is time consuming and such unenhanced imaging is thus not obtained (36). Without unenhanced imaging, we recorded few false-positive findings.
In conclusion, our results suggest that T2*-weighted FMPGR, T2*-weighted FMPSPGR, and proton density FSE sequences after intravenous ferumoxides administration provide higher diagnostic accuracy than the other four sequences (T2-weighted SSFSE, T2*-weighted GRASS, T2-weighted FSE, and proton density SSFSE), and show higher CNRs, fewer image artifacts and better lesion conspicuity. For the detection of HCCs at ferumoxides-enhanced MR imaging, they thus appear to be the optimal pulse sequences.
 XML Download