

 PDF
PDF ePub
ePub Citation
 Print
Print


Unlike conventional CT, helical CT permits simultaneous continuous movement of a patient on the table through the gantry while the x-ray tube rotates around the patient in such a way that data is acquired continuously throughout the volume of interest. From the raw projection data thus obtained, planar images must be generated (1-4). Helical CT thus permits real-time multi-planar reformation in an arbitrary direction, as well as providing reconstructed three-dimensional (3D) images.
Special helical CT, so called multidetector-row helical CT, equipped with more than two row-detector arrays to improve z-axis resolution and reduce scanning time, has recently emerged (5, 6). Since it uses more than two row-detector arrays as opposed to the single-row array used in single-slice helical CT, the simultaneous scanning of multiple slices at different z locations is possible (5-8). Commercially used multidetector-row helical CT offers a two- to threefold improvement in volume coverage speed by reducing scanning time by a half to one-third while preserving the image quality provided by single-slice helical CT. These advantages could translate into a substantial increase in the region scanned without additional contrast injection, better separation of the arterial and venous phases in multiphase data acquisitions, and substantially higher-quality of reconstructed 3D images because of improvements in z-axis resolution (9).
Single-slice helical CT is widely used, and numerous reports have assessed the quality of the images it provides (10-16), but only a few reports described the results obtained using multidetector-row helical CT (7, 9, 17). The purpose of our study was to determine which multidetector-row helical CT provides the best-quality reconstructed 3D images (for phantoms) and to assess differences in image quality according to the levels of scanning parameters used.
MATERIALS AND METHODS
Multidetector-row helical CT and experimental objects
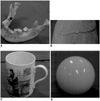
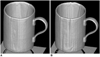
Four different objects with different surfaces and contours were scanned using multidetector-row helical CT. They included a mandible (HU: 1275), calvarium (HU: 1420), cup (HU: 1997), and a billiard ball (HU: 2350) (Fig. 1). The multidetector-row helical CT scanner (LightSpeed QX/I; GE Medical Systems, Milwaukee, Wis., U.S.A.) used in this study was equipped with four row-detector arrays. Along the axis of rotation (z axis) there were 16 rows of detector cells, with a z spacing of 1.25 mm when projected onto the axis of rotation.
Scanning Sequences and Acquisition of 3D Images
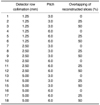
The following CT parameters were used: no gantry tilt, 1-cm field of view, 120 kVp, 250 mA, standard algorithm, and standard (180° linear) interpolator. The 18 scanning sequences were performed with 1.25, 2.50, and 5.00 mm detector-row collimation, 3.0 and 6.0 pitch [known as HQ (high quality) and HS (high speed), respectively], and with 0, 25, and 50% overlap between reconstructed slices (Table 1). A total of 72 scans of four objects were obtained using 18 scanning sequences, and the images were transferred to an image processing workstation by means of LAN. For each scanning sequence, the CT data were reconstructed as 3D images using shaded surface display and an AW 3.1 (GE Medical Systems, Milwaukee, Wis., U.S.A.) program. The threshold setting for shaded surface
display was 160 HU.
Rating and rating criteria
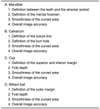
Two radiologists experienced in the interpretation of reconstructed 3D images graded the 72 images on a scale from 1 (worst) to 5 (best) for each of four preset criteria, thus producing a mean score for each rating criterion and an overall mean score. The four rating criteria for each object are shown in Table 2. The mean score for each rating criterion in each scanning sequence was calculated by adding the score (averaged for the two items, as in the definition) of the two raters for each object and dividing it by eight (four objects and two raters).
Statistical analysis
An ANOVA (analysis of variance) model provided by SAS V6.12 (SAS Institute Inc., Cary, N.C., U.S.A.) was used to compare the mean score for each rating criterion and the overall mean score according to the levels of the scanning parameters. The ANOVA model was selected using a backward elimination method which started at the initial model containing the main effects and all interaction effects of less than three-order, and progressed to the final model, eliminating insignificant higher-order interaction.
The mean score and 95% confidence interval for the image quality in each scanning sequence were estimated using the selected model. Additionally, significant differences between the levels in each scanning parameter were assessed by means of multiple comparison using the Tukey method. A p value difference of less than 0.05 was considered statistically significant.
RESULTS
Analysis of image quality according to the scanning parameter
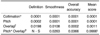
The results of ANOVA (Table 3) showed that mean scores for each rating criterion, and the overall mean score according to the level of each scanning parameter were significantly different (p < 0.05). In terms of smoothness and overall accuracy, the interaction effect between pitch and the extent of overlap between reconstructed slices was also significant (p < 0.05). That is, the effect of pitch on smoothness varied significantly according to the extent of overlap, and vice versa. The effect of this interaction on the overall mean score was marginally significant.
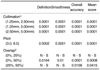
The multiple comparison method (Table 4) showed that for each rating criterion and with regard to overall mean score, differences in image quality occurred at all levels of detector-row collimation and pitch (p < 0.05). However, for definition and smoothness, significantly different image quality was observed only when overlap of reconstructed slices was between 0% and 50% (p < 0.05). In terms of overall accuracy and overall mean score, there were, on the other hand, significant differences in image quality between an overlap of 0% and 50%, and also between overlap of 25% and 50% (p < 0.05).
Mean score and 95% confidence intervals of scanning sequences for each rating criterion and the overall mean score
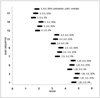
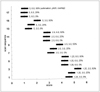
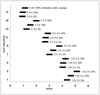
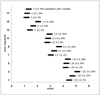
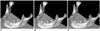
Using the fitted ANOVA model, we estimated the mean score and 95% confidence intervals of each scanning sequence for each rating criterion and the overall mean score (Figs. 2, 3, 4, 5). Among the 18 sequences, that in which detector-row collimation, pitch, and overlap of reconstructed slices were, respectively, 1.25 mm, 3.0, and 50%, showed the highest score for each rating criterion, and highest overall mean score (4.94). Image quality improved as detector-row collimation decreased (Fig. 6); as pitch was reduced from 6.0 to 3.0 (Fig. 7); and as the degree of overlap between reconstructed slices increased (Fig. 8).
DISCUSSION
Multidetector-row helical CT offers the advantage of simultaneous scanning of multiple slices at different z locations with more than two row-detector arrays (5-8). In single-slice CT, x-ray beam collimation (or the thickness of the x-ray beam) affects both z volume coverage speed and high z-axis resolution (or slice thickness). Thick x-ray collimation is preferred for high volume coverage speed, while thin collimation is desirable for high z-axis resolution. Here, the term 'volume coverage speed' (more exactly, volume coverage speed versus performance) refers to the ability to rapidly scan a large longitudinal (z) volume with high longitudinal (z-axis) resolution and few image artifacts (7). However, one of the great advantages of multidetector-row helical CT is the multiple row-detector arrays (number of acquisition channels) which permit further division of the total x-ray beam, known as x-ray beam collimation, into multiple subdivided beams, known as detector row collimation. In multidetector-row helical CT, while total x-ray collimation still determines volume coverage speed, detector-row collimation thus determines longitudinal (z-axis) resolution, i.e. slice thickness. Detector rowcollimation, d, and x-ray beam collimation, D, have the following relationship:

where N is the number of detector rows.
At present, there are two commonly used patterns of detector-row array (detector technology). In GE Medical Systems scanners, the 16 detector rows are evenly spaced at 1.25-mm intervals along the z-axis and have a maximum scan coverage of 20 mm per rotation, known as the 'matrix detector', while in a Siemens scanner (Siemens Medical Systems, Forchheim, Germany), eight detector rows are unevenly but symmetrically spaced at 1, 1.5, 2.5 and 5 mm along the z-axis and have a maximum scan coverage of 20 mm per rotation, known as the 'adaptive array detector'.
In this study, mean scores for each rating criterion, and overall mean scores, varied significantly according to the levels of the scanning parameters employed (detector-row collimation, pitch, and overlap between the reconstructed slices). The rating criteria we selected, namely definition, smoothness, and overall image accuracy, were the same as those chosen by Kasales et al. (13).
Furthermore, when the multiple comparison method was used to determine significant differences between the levels for each scanning parameter, detector-row collimation of 1.25, 2.50, and 5.00 mm gave rise to significant differences in image quality, which improved as detector-row collimation decreased (Table 4, Fig. 6). This result is consistent with that of conventional or single-slice helical CT (8, 10). However, because both the number of images acquired, and scanning time increase as detector-row collimation decreases, this latter cannot be reduced sufficiently to increase image quality.
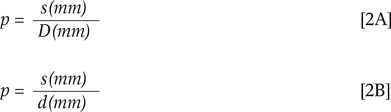
The pitch for single-slice helical CT is defined as the table-translating distance per gantry rotation, s, divided by x-ray beam collimation, D (Eq. 2A); it differs from that for multidetector-row helical CT, which is defined as the table-translating distance per gantry rotation, s, divided by detector-row collimation, d (Eq. 2B) (7).

The concepts of HQ (high quality) and HS (high speed) pitch, introduced in multidetector-row helical CT, refer to preferred pitch and are based on the fact that 3.0 (HQ) pitch provides high image quality and 6.0 (HS) pitch offers high-speed scanning while preserving tolerably high image quality. In terms of image quality, HQ and HS pitches correspond respectively to the 1.0 and 2.0 pitches of single-slice helical CT (7). HQ pitch is available for applications which demand good contrast resolution and few image artifacts, while HS pitch is used for applications in which high volume-coverage speed and thin-slice scan scanning are required (7).
In single-slice helical CT, axial image quality steadily deteriorates as pitch increases. In multidetector-row helical CT, however, the image quality contour is 'valley-shape': quality improves, in other words, at a pitch of 3.0, deteriorating and forming a plateau until a pitch of 6.0 is reached. In our study, there was a significant difference in image quality between the two levels of pitch (Fig. 7), image quality at 3.0 being significantly superior to that at 6.0 (Table 4). By means of this study, we demonstrated that the quality of reconstructed 3D images was higher at a pitch of 3.0 than at 6.0. Since pitches of 3.0 and 6.0 were the only ones used in this study, the 'valley-shape' image quality apparent in axial images could not, however, be demonstrated in reconstructed 3D images. HS pitch of 6.0 has, though, recently become popular in reconstructed 3D imaging and CT angiography, as well as in chest CT, because of its tolerable image quality, fast scan time, and the lower-level of radiation emitted (17, 18).
Increases in the degree of overlap between reconstructed slices require reductions in the actual reconstruction interval, and theoretically this should improve longitudinal (z-axis) resolution by decreasing the effects of partial volume averaging in the z-axis direction (12). This phenomenon has been confirmed several times in conventional or single-slice helical CT (10, 11, 13, 14). In addition, Ney et al. reported that in determining the quality of the reconstructed 3D images, the degree of overlap between reconstructed slices is more important than detector-row collimation (10). The choice of optimal overlap between reconstructed slices is governed, however, by several factors. There is a trade-off between practical issues such as imaging processing time and data storage requirements secondary to the number of images to review versus maximal longitudinal (z-axis) resolution (3). In our study, with regard to overlap between reconstructed slices, there was a significant difference in quality between images obtained with overlap of 0% and of 50%, and between some of images obtained with overlap was of 25% and of 50% (in terms only of overall accuracy and overall mean score) (Table 4, Fig. 8). There was, though, no significant difference in image quality between 0% and 25% overlap, and in order to obtain significantly different quality, substantial overlapping, of about 50%, is thus required
With regard to smoothness and overall accuracy, the interaction effect between the pitch (overlap between reconstructed slices) and overlap between reconstructed slices (pitch) was significant, and was marginally significant in determining the overall mean score (Table 3). The significant interaction effect between the two means that the effect of pitch is significantly different depending upon the degree of overlap between reconstructed slices, and vice versa. For example, with regard to smoothness and overall image accuracy, at a pitch of 6.0 there is little change in image quality as overlap between reconstructed slices increases, but at a pitch of 3.0, there is perceivable change in image quality as this occurs (Fig. 3).
In conclusion, the quality of reconstruction 3D images obtained using multidetector-row helical CT and various scanning techniques is best when 1.25-mm detector-row collimation, 3.0 pitch, and 50% overlap between reconstructed slices are the parameters used. Image quality improved as detector-row collimation decreased; with a pitch of 3.0 as compared with one of 6.0, and as overlap between reconstructed slices increased.

 XML Download