

 PDF
PDF ePub
ePub Citation
 Print
Print


Dependent opacity, an ill-defined increase in subpleural lung attenuation ranging from a few millimeters to a centimeter or more in thickness, and visible only in dependent lung regions, disappearing when the lung is nondependent, is often seen at high-resolution CT (1). By obtaining additional scans with patient prone, it can be readily distinguished from infiltrative lung disease (2-4).
The physical density of a lung depends upon the relative proportions of air, blood, extravascular fluid and lung tissue in the lung volume assessed (5). These vary with lung region and change continuously during normal respiration. It has been shown that dependent opacity arises in areas of passive microatelectasis (3) and has also been attributed to fluid accumulation caused by gravity (5-7). However, the relationship between visible dependent opacity and lung volume, lung levels, and lung attenuation has not been studied in detail. The purpose of this study is to evaluate the influence of lung volume and lung level on the presence of dependent opacity seen at thin-section CT, and to determine the relationship between dependent opacity and regional lung attenuation. In an attempt to estimate the effects of lung volume and pulmonary vascular diameter on dependent opacity, we also assessed the relationship between the presence and degree of dependent opacity and segmental arterial diameter at different lung volumes.
MATERIALS AND METHODS
Thirteen healthy volunteers, twelve men and one woman, ranging in age from 27 to 35 (mean, 29.7) years, participated in the study. Their height varied between 165 and 178 (mean, 171.2) cm and their body weight between 52 and 78 (mean, 67.5) Kg. They were non-smokers and had no history of pulmonary disease which might have affected the results of pulmonary function tests. Informed consent was obtained from all volunteers.
Thin-section CT scans of the chest were performed using a Somatom Plus-40 (Siemens, Erlangen, Germany). Images were obtained in the supine position at three different anatomic levels (carina, inferior pulmonary veins, and 2 cm above the right hemidiaphragm), and at lung volumes representing 10%, 30%, 50%, and 100% of vital capacity (determined using a respiratory gating device connected to the CT scanner). Vital capacity was defined as the volume expired after maximal inspiration, or inspired after maximal expiration. Following maximal inspiration, the subjects were instructed to exhale, respiration was interrupted mechanically by closing a valve in the spirometer at the selected lung volume, and a CT scan was obtained. In order to avoid motion artifacts due to straining against a closed conduit system, the subjects was asked to avoid straining and to suspend respiration when the valve was closed. In order to familiarize each subject with the procedure, a few practice trials preceded actual image acquisition.
At each of the three different anatomic levels at which four lung volumes were determined, scans were obtained using 1-mm collimation. Scan time was 1 sec; tube current, 275 mA; and voltage, 137 kVp. Scans were reconstructed using a high-spatial-frequency algorithm, and window width and level were 1300 and -650 HU, respectively.
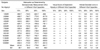
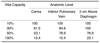
Dependent opacity was visually estimated by two radiologists (K.N.L, S.K.Y) who reviewed cases in random order and were blinded to the percent of vital capacity at which the scan was obtained (Table 1). The frequency and degree of dependent opacity seen at the three different anatomic levels at each different lung volume were assessed; at the level of the carina, assessment related to two areas separated by the major fissure, one in the dependent portion of the upper lobe and the other within the apex of the superior segment of the lower lobe. The findings were graded on a three-point scale (0, absent; 1, subtle; 2, obvious), and when two observers disagreed as to the presence or absence of dependent opacity, a decision was reached by consensus. For each different vital capacity, we also measured interobserver agreement as to the degree of dependent opacity at the three anatomic levels.
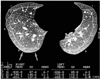
The relationship between the visually estimated degree of dependent opacity and regional CT attenuation was determined, being calculated semiautomatically as described by other investigators (8-13). For each scan, the "Pulmo CT" option from Siemens was used to calculate a region of interest (9, 10). For measuring attenuation, a region of interest was selected in the most posterior area at a level 2 cm above the right hemidiaphragm. The region of interest chosen was a zone of the right lung posterior to a horizontal line drawn 1 cm from the most dependent pleural surface. Thus, a crescent-shaped area (average 3.6 cm2 ± 0.6) was selected as the most dependent lung region (Fig. 1). We compared regional CT attenuation measured at different lung volumes (10%, 30%, 50%, and 100% of vital capacity) (Table 1).
The diameter of a branch of the right posterior basal segmental artery, chosen in order to avoid artifact-related cardiac pulsation, was measured three times at the different respiratory levels, using a Vernier caliper (millimeters, with two decimal places), and averaged. The relationship between the degree of dependent opacity and arterial diameter at these different lung volumes was then assessed.
For statistical analysis, a microcomputer and SAS software (SAS Institute, Cary, N.C., U.S.A.) were employed, and for statistical comparisons of differences in visually estimated dependent opacity and regional CT attenuation according to vital capacity, we used the Mantel-Haenszel Chi-Square test. For correlation of the degree of visually estimated dependent opacity or attenuation of a dependent area with the diameter of a segmental arterial branch, Pearson's correlation coefficient was used. A p value of less than 0.05 was considered statistically significant. To determine interobserver variability, kappa statistics were used: values up to 0.4 indicated positive but poor agreement; values of 0.41-0.75, good agreement; and values greater than 0.75, excellent agreement. A value of 1 demonstrated perfect agreement.
RESULTS
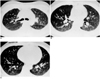
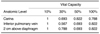
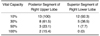
Dependent opacity was found to be present significantly more often at lower vital capacity levels (in particular, 10% or 30%) than at 100% of vital capacity (p = 0.001) (Table 2). Both observers noted that at the three different anatomic levels, obvious dependent opacity was 10% of vital capacity in all cases. Interobserver agreement in the visual assessment of dependent opacity was excellent (κ = 0.82) (Table 3). Although dependent opacity occurred at all three different anatomic levels, it was seen more frequent 2 cm above the diaphragm (p = 0.001) (Fig. 2). At the level of the carina, at 100% of vital capacity, dependent opacity was noted in two (15%) of 13 cases in the dependent portion of the right upper lobe, though was not visible at the apex of the superior segment of the lower lobe (Table 4).
When dependent opacity was present, measured regional attenuation at a level 2 cm above the right hemidiaphragm ranged from -538.1 to -856.3 (mean, -695.4; SD 76.9) HU (Table 1). The degree of dependent opacity assessed visually was significantly related to the mean value of the regional attenuation of dependent lung (p = 0.001). Furthermore, regional CT attenuation in a dependent lung increased progressively as vital capacity decreased (p = 0.001).
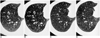
The degree of dependent opacity correlated with the diameter of a segmental arterial branch (r = 0.493; p = 0.0002) (Table 5), and the CT attenuation of a dependent area correlated with arterial diameter (r = 0.486; p = 0.0003). As vital capacity decreased, the frequency of visible dependent opacity and arterial diameter both increased (Fig. 3).
DISCUSSION
Dependent opacity, also termed subpleural dependent density, consists of a stripe of ground glass attenuation 2 to 30 mm thick and is usually seen in the most dependent lung regions. It disappears when the lung is nondependent (3). Verschakelen et al. (8) studied the differences in CT attenuation found between dependent and nondependent lung regions, noting that the difference was smallest for lung volumes near total vital capacity. Conversely, when lung volume was reduced, as in full expiration, differences in CT attenuation between dependent and nondependent portions of the lung increased.
The physical density of lung is determined by the relative contribution of its various components: air, blood, extravascular fluid, and lung tissue. Regional differences in lung attenuation are related to lung volume and the effects of gravity (5). In normal subjects, a gradient in CT lung attenuation (attributed primarily to the influence of gravity on blood flow and lung inflation) is observed, with lung attenuation greater in dependent lung (6). Furthermore, largely because of regional changes in lung volume and lung perfusion, lung attenuation changes continuously during respiration (8-10, 12-15).
However, variations in scan parameters and sampling methods used in prior studies, and the possible influence of lung pathology on regional lung density measurements, must be considered when assessing the results of these studies (8-10, 12-15). Recently, semiautomatic procedures for the measurement of lung attenuation, as well as spirometric gated CT, have proven useful in the objective assessment of lung attenuation at varying lung volumes (8-11, 14, 15). Spirometric gated CT allows for the selection of a specific point in the respiratory cycle at which flow can be interrupted by closing a valve in the spirometer prior to imaging (8, 9). Also, in the present study normal non-smoking volunteers were selected to avoid the possibility of lung disease influencing the measurement of lung attenuation.
As reported in prior studies, we found that dependent opacity was apparent significantly more often at lower lung volumes (8, 12), and was also more frequent at lung bases. It was visualized in the dependent portions of both right and left lungs at each anatomic level studied (carina, inferior pulmonary veins, and 2 cm above the right diaphragm). However, at the level of the carina, dependent opacity was significantly more frequent in the posterior segment of the upper lobe (anterior to the major fissure) than in the superior segment of the lower lobe (posterior to the major fissure and thus more dependent). This suggests that, at least in this region, factors other than gravity affect the occurrence of dependent opacity.
We attempted to determine whether the presence and degree of visually estimated dependent opacity was related to regional lung attenuation. A crescent-shaped region of interest measuring 3.6 ± 0.6 cm2 was semiautomatically located in the dependent portion of the right posterior basal segment. Visually estimated dependent opacity was present at a wide range of lung attenuation values (range, -856.3 to -538.1 HU; mean, -695.4 ± 76.9 HU), reflecting the varying lung volumes at which assessment was made and the fact that the visibility of dependent opacity is determined not only by the absolute density of dependent lung but also by its relationship to the density of nondependent lung regions. In a study using spirometrically gated CT, mean lung attenuation in normal subjects has been shown to be approximately -760 HU at 20% of vital capacity, -835 HU at 50%, and -860 HU at 80% (9). However, the degree of dependent opacity correlated well with regional attenuation regardless of lung volume.
The gradient in attenuation between dependent and nondependent zones can be explained by gravitational differences in perfusion and inflation. Because lung perfusion is greater in dependent zones, the arteries in these areas are larger. In assessing the relationship between the degree of dependent opacity and the diameter of a segmental artery, we measured arterial diameter in the posterior basal segment of the right lower lobe, a region where dependent opacity is often observed. In our study, there was a significant relationship between increased arterial diameter measured in the right posterior basal segment and the occurrence of dependent opacity and lower lung volumes.
There are several limitations to our study. The subjects were young, normal, healthy volunteers, among whom there may have been interindividual differences in physiologic respiration in the regional cross-section of lung density. All volunteers except one were men, and although this may have introduced a gender bias, it was our desire to study patients with a relatively small range of body habitus. Three female volunteers less than 160 cm and weighing less than 48 kg were excluded.
In conclusion, dependent opacity is significantly influenced by respiratory level, which must be considered when lung attenuation is evaluated, and is related to lung attenuation and vascular diameter. The physiologic phenomenon of varying lung density associated with respiration can be demonstrated using respiratory gated CT.

 XML Download