

 PDF
PDF ePub
ePub Citation
 Print
Print


Despite the fact that conventional magnetic resonance (MR) imaging following the injection of gadolinium (Gd)-based contrast agents has led to improved accuracy in the detection and characterization of various brain tumors, the procedure suffers certain limitations related to the nonspecificity of contrast enhancement. Specifically, this does not provide a clear-cut differential diagnosis between high- and low-grade tumors, between radiation necrosis and proliferating neoplasms, or between postsurgical enhancement and a tumor that infiltrates the margins of the surgical bed. For these reasons, the clinical role of various functional imaging techniques, including nuclear medicine methodologies such as 18F-fluorodeoxyglucose positron emission tomography (FDG-PET), and functional MRI procedures such as perfusion and diffusion-weighted imaging, and MR spectroscopy, has become an important area of investigation (1).
Among various functional imaging techniques, perfusion MR imaging using a relative cerebral blood volume (rCBV) map is particularly sensitive in depicting microvasculature, and tumor neovascularization can thus be detected (2-4). Several recent studies (5-11) have reported that the potential uses of perfusion MR imaging in the evaluation of brain tumors include tumor grading, the provision of guidance for stereotactic biopsy, differentiation between radiation necrosis and recurrent glioma, and the determination of prognosis and response to treatment. In those studies, the rCBV ratios of high-grade gliomas were significantly higher than those of low-grade gliomas. Lee et al. (12) suggested that the rCBV ratio cutoff value which permitted discrimination between high- and low-grade gliomas was 2.60.
Although recent reports (5-7, 9, 12) of perfusion MR studies of brain tumors have focused on the grading of gliomas, the clinical utility of perfusion MR imaging for the differential diagnosis of various brain tumors has not been established. In this study, we investigated the rCBVs of various brain tumors using perfusion MR imaging and evaluated the utility of this modality in the differential diagnosis of brain tumors.
MATERIALS AND METHODS
Patients
Fifty-seven patients with intracranial tumors confirmed by pathologic examination were included in this study. The group comprised 32 men and 25 women aged 13 to 81 (mean, 44.9) years. All underwent MR imaging prior to treatment, which included surgery, chemotherapy, and radiation therapy. The pathologic diagnosis of the 57 brain tumors included 21 cases of high-grade glioma (12 glioblastoma multiformes, 3 anaplastic astrocytomas, 3 anaplastic oligodendrogliomas, and 3 anaplastic oligoastrocytomas), eight low-grade gliomas (3 oligodendrogliomas, 2 pilocytic astrocytomas, 1 astrocytoma, 1 mixed oligoastrocytoma and 1 pleomorphic xanthoastrocytoma), eight lymphomas, six hemangioblastomas, seven metastases, and seven various other tumors (2 germinomas, 2 medulloblastomas, 1 ganglioglioma, 1 choroid plexus papilloma, and 1 pineal parenchymal tumor). The seven metastatic tumors arose from squamous cell carcinoma of the lung in two patients, and small cell carcinoma of the lung, large cell carcinoma of the lung, and adenocarcinoma of the thyroid, cervix, and rectum in one patient each. For pathologic confirmation, 49 patients underwent total or subtotal tumor resection and all with lymphoma underwent biopsy for the verification of diagnosis. Since gliomas are typically heterogeneous and histologic samples obtained during biopsy may be subject to sampling error (13, 14), we sought to avoid this pitfall by including only gliomas which had undergone subtotal or gross total resection.
Conventional and Perfusion MR Imaging
All patients underwent preoperative conventional and perfusion MR imaging using a 1.5-T imager (Signa, GE Medical Systems, Milwaukee, Wis., U.S.A.). For the latter, we used a gradient-echo single-shot echo-planar imaging (EPI) sequence with the following parameters: TR/ TE, 2000/ 60 msec; flip angle, 90°; field of view, 28 × 28 cm; 128 × 128 matrix; section thickness/ gap, 5 mm/ 2 mm. A series of images (10 slices, 50 images/slice) was obtained at 2-second intervals before, during, and after administration of the contrast agent. After 10 seconds, during which time the first five images were acquired and an imaging baseline thus established, a bolus of 15 ml gadopentetate dimeglumine (Magnevist, Schering, Berlin, Germany) was power injected at a rate of 5 ml/second through an 18- or 20-gauge intravenous catheter. In each case, multisection data acquisition was used to record a tumor in its entirety, and a total of 500 images was obtained.
For the postprocessing of perfusion MR data, changes in the relaxation rate (ΔR2) can be calculated from signal intensity using the following equation: ΔR2= ln (S/S0)/TE, where ln is the natural logarithm, S is signal intensity, and S0 is baseline signal intensity (15). Tracer recirculation was reduced by fitting a gamma-variate function to the measured ΔR2 curve (15, 16). rCBV maps were generated as gray scale images by numerical integration of the area under a fitted curve on a pixel-by-pixel basis. Time-to-peak (TTP) maps were also obtained as gray scale images from the measured ΔR2 curve on a pixel-by-pixel basis (17, 18).
Qualitative and Quantitative Analysis
For quantitative analysis, normal white matter within the contralateral hemisphere was used as the internal reference standard (19). To determine maximum rCBV ratios, a region of interest (ROI), including at least 20 pixels, was carefully established in the area of a tumor which according to an rCBV map showed maximal intensity, and also in contralateral normal white matter. A circular ROI was drawn, and measured three times, and its average value was then recorded. The same ROI was also applied to TTP maps. rCBV or TTP ratios were calculated by dividing the mean CBV or TTP of a tumor by that of contralateral normal white matter.
Visual inspection of rCBV map images showed that the signal intensity of all tumors was higher than or similar to that of normal white matter. Thus, after visual grading, we assigned a tumor to the high rCBV group if rCBV maps depicted any intratumoral area with a signal intensity higher than that of gray matter. Similarly, if visual grading showed that the signal intensity of all intratumoral areas was similar to or lower that of gray matter, the tumor was assigned to the low rCBV group. In addition, we assessed the relationship between the visual grades depicted by rCBV maps and the intratumoral enhancement seen at contrast-enhanced T1-weighted imaging.
Statistics
Student's t test was used to determine statistical differences in rCBV or TTP ratios regarding the histopathologic grades of gliomas and to analyze quantitative differences in rCBV ratios between the two groups visually categorized as high or low CBV on rCBV maps. The one-way ANOVA test was used to decide whether rCBV or TTP ratios varied between tumor groups. A p value of less than 0.05 was considered statistically significant.
RESULTS
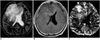
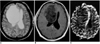
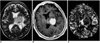
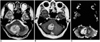
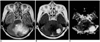
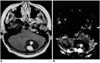
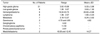
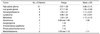
rCBV and TTP ratios are summarized in Tables 1 and 2. For high- and low-grade gliomas, these varied from 3.02 to 16.66 (mean ± SD, 9.33 ± 3.96) and from 1.30 to 5.07 (mean ± SD, 3.64 ± 1.50), respectively (Figs. 1, 2). The difference was statistically significant (p=0.001, Student's t test). In general, the rCBV ratios of high-grade gliomas of a specific histologic type were not significantly different from those of other high-grade gliomas, and this was also the case with low-grade gliomas. Hemangioblastomas showed the highest rCBV ratios (mean, 26.60 ± 8.98), which was statistically higher than those of all other tumors (p<0.001). The rCBV ratios of metastases varied from 3.16 to 13.27 (mean, 8.34 ± 3.02), a finding similar to that for high-grade gliomas. Lymphomas had low rCBV ratios (Fig. 3), ranging from 1.38 to 2.07, values which were significantly lower than those of high-grade gliomas (p=0.001) or metastases (p=0.032) (Fig. 4).
The TTP ratios of all tumor groups were similar to those of white matter, and there were no statistically significant differences in TTP ratios between tumor groups (p > 0.05).
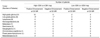
The relationship between visual grade according to rCBV maps and the intratumoral enhancement seen at contrast-enhanced T1-weighted imaging is summarized in Table 3. At visual assessment of tumors on rCBV maps, a high rCBV was found in 17 (81%) of 21 high-grade gliomas. In five of these 17 patients, however, contrast-enhanced T1-weighted images demonstrated no obvious enhancement within the tumor. Visual examination of rCBV maps showed that four (19%) of 21 high-grade gliomas belonged to the low rCBV group, and in two of these, contrast enhanced T1-weighted images depicted intratumoral enhancement. After visual inspection, four of the eight low-grade gliomas, namely two oligodendrogliomas, one astrocytoma, and one oligoastrocytoma, were assigned to the low rCBV group, and at contrast-enhanced T1-weighte imaging, enhancement of theses tumors was either absent or equivocal. High rCBV was visually determined in two pilocytic astrocytomas, one oligodendroglioma, and one pleomorphic xanthoastrocytoma.
rCBV mapping demonstrated high rCBV in all hemangioblastomas, which at contrast-enhanced T1-weighted imaging showed strong contrast enhancement (Fig. 5). In all lymphomas, on the other hand, low rCBV and strong homogeneous enhancement were apparent. High rCBVs were found in six of seven metastases, each of the two germinomas, each of the two medulloblastomas, the ganglioglioma, and the choroid plexus papilloma. The pineal parenchymal tumor showed low rCBV and contrast enhancement.
The rCBV ratios of tumors assigned at visual examination to the low and the high group ranged from 1.30 to 4.06 (mean, 2.48), and from 4.62 to 40.75 (mean, 12.07), respectively. This difference was statistically significant (p=0.000).
DISCUSSION
The presence of contrast enhancement at conventional MR imaging represents a pathologic alteration in the blood-brain barrier, with or without concomitant vascular hyperplasia, whereas the degree of MR perfusion abnormality reflects the degree of microvascularity, with or without destruction of the blood-brain barrier (5, 6, 20, 21).
In the grading of gliomas, previous studies (5-7, 9) reported statistically significant differences in rCBV values between low- and high-grade tumors, and demonstrated that high-grade gliomas with high rCBV might not enhance at contrast-enhanced MR imaging. Similar results were obtained in our study. There was a statistically significant difference in rCBV ratios between low- and high-grade gliomas (p=0.001), and five high-grade gliomas with high rCBV showed no obvious contrast enhancement. In our study, four high-grade gliomas had low rCBV, a finding which reflects a low level of neovascularity or contrast leakage through the altered blood-brain barrier. Sugahara et al. (22) reported two cases of anaplastic glioma without increased vascularity, suggesting that a lack of neovascularity within a tumor did not necessarily indicate benignancy. Our results also showed that in two of the four high-grade gliomas with visually determined low rCBV, enhancement was evident at contrast-enhanced T1-weighted MR imaging, a finding which may reflect a falsely low rCBV related to contrast leakage through the altered blood-brain barrier. When this is disrupted, perfusion MR may underestimate the real microvascular blood volume. In a region of severe blood-brain barrier breakdown, unwanted T1 effects caused by extravasated gadolinium counteract the T2 signal-lowering effects of gadolinium, resulting in falsely low rCBV values (23).
Despite their relatively low rCBV ratios, a signal intensity equal to or lower than that of gray matter was apparent at visual analysis of rCBV maps in only four of eight low-grade gliomas; in the other four, rCBV was high. These results may be explained by the relatively high neovascularity of the tumors, revealed at histologic examination. Likewise, previous studies (9, 23) described pilocytic astrocytomas containing foci of high rCBV, and oligodendrogliomas, regardless of their histologic grade, with high blood volume foci. Despite the fact that an oligodendroglioma, independently of its histologic grade, is relatively hypervascular, our study demonstrated a statistically significant difference in rCBV ratio between low-grade and anaplastic oligodendroglioma (p=0.009, Student's t test). To clarify this discrepancy, further study of a larger series is, however, necessary.
In our study, a frequently occurring hypervascular tumor such as hemangioblastoma was shown to have an exceedingly high rCBV ratio; this ratio was lowest in lymphomas, in which it was significantly lower than in high-grade gliomas or metastases. Sugahara et al. (24) reported that cerebral lymphomas tended to have lower vascularity than malignant gliomas.
Our study findings suggest that rCBV maps based on perfusion MR imaging data can provide additional information for use in the differential diagnosis of brain tumors. First, they may be useful in differentiating solid cerebellar tumors, including metastatic tumor, lymphoma, and solid hemangioblastoma, in adults; these occasionally show similar conventional MR features of homogeneous enhancement at contrast-enhanced T1-weighted imaging, and intermediate or mild hyperintensity at T2-weighted imaging, though in our cases, quantitative analysis showed indicated that the signal intensity of lymphoma was similar to or lower than that of gray matter, while hemangioblastomas and metastases showed high intensity on rCBV maps of perfusion MR imaging.
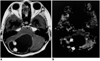
Second, an rCBV map is also useful in differentiating cystic astrocytoma from cystic hemangioblastoma. At conventional MR imaging, both cerebellar hemangioblastomas and astrocytomas often appear as small, enhancing nodules within a well circumscribed, thin-walled cyst, as in our cases. Despite some differential features such as an intratumoral signal void, differentiation by conventional MR imaging alone is difficult, especially where tumors are smaller than 1cm (25, 26). Perfusion MR imaging, however, permits differentiation without the need for additional invasive conventional angiography. Quantitative analysis indicated that the rCBV ratio of hemangioblastomas was significantly higher than that of cerebellar astrocytomas, and it was also found that compared with that of gray matter, the signal intensity of hemangioblastomas was higher, while that of cystic astrocytomas was slightly higher (Figs. 6, 7).
Compared to other studies (5-7), the rCBV ratios of tumors in our series were higher in the titer, a fact which may be due to the different way in which ROIs were selected: the ROIs we chose were, for each tumor, in the area which showed maximal perfusion.
Our study findings revealed no differences in TTP between various tumor groups. We noticed that TTP was a useful parameter in stroke cases (27), so sought to identify on TTP maps any differences between various tumor groups, especially between lymphomas and other hypervascular tumors. TTP maps, in contrast to rCBV maps, played only a small part in both the grading and differentiation of the various brain tumors we encountered.
A limitation of this study is the inclusion of only small numbers of cases of low-grade glioma, especially low-grade astrocytoma and oligodendroglioma. To determine the practical utility of perfusion MR imaging in differentiating between low- and high-grade astrocytomas or oligodendrogliomas, further study involving a larger series of these tumors is needed. For the grading of gliomas, determination of a cut-off value for rCBV may be helpful.
In summary, the rCBV ratios of high-grade gliomas were significantly higher than those of low-grade gliomas. For hemangioblastomas, these ratios were exceedingly high; for high-grade gliomas and metastases they were relatively high; and for low-grade gliomas and lymphomas they were relatively low. Visual grading based on rCBV mapping provided added information about tumor characteristics. Perfusion MR imaging may be helpful in the differentiation of the various solid tumors found in the brain, as well as in assessing the grade of the various glial tumors occurring there.
 XML Download