

 PDF
PDF ePub
ePub Citation
 Print
Print


Multiphase dynamic computed tomography (CT) and magnetic resonance imaging (MRI) can provide useful information for the differential diagnosis of various hepatic lesions by highlighting dynamic contrast enhancement features. Furthermore, careful analysis of the patterns observed is helpful in the evaluation of hepatic hemodynamic change. In fact, hemodynamic abnormalities are commonly encountered in daily practice as a result of the increased use of dynamic CT and MRI. In order to properly characterize liver tumors and avoid erroneous identification of pseudolesions, knowledge of these lesions thus becomes more important. At hepatic arterial phase (HAP) imaging, perfusion disorders are generally seen as an area of hyperenhancement that returns to normal at portal venous phase (PVP) imaging. In most cases, this finding reflects increased arterial blood flow related to arterioportal shunt (APS). The causes of APS include obstruction of the portal or hepatic vein, liver cirrhosis, hepatic neoplasms, hepatic trauma, hepatic parenchymal compression, and inflammatory diseases (1). In this article, we discuss the pathophysiology of APS, its dynamic CT and MRI findings, and various causes.
PATHOPHYSIOLOGY
APS is an organic or functional communication between the hepatic arterial branch and the portal venous system, resulting in the redistribution of arterial flow into a focal region of the portal venous flow. When blood flow through the portal vein is diminished or absent, the hepatic artery takes over perfusion of the liver through the APS (2). In cases of portal vein obstruction and compression, increased hepatic arterial blood flow occurs mainly through the peribiliary plexus (3).
APS may involve a number of different routes, each of which can occur alone or in combination with other mechanisms. In the transsinusoidal route, flow is from the hepatic artery to the hepatic sinusoids and then, retrogradely, into branches of the portal vein because of high resistance to flow through the hepatic venules (4). This mechanism is believed to be responsible for nontumorous APS in cirrhosis or Budd-Chiari syndrome. In the transvasal route, a vasa vasorum from a branch of the hepatic artery passes through the wall of a branch of the portal vein and allows blood to flow into the lumen of the portal vein (due to a tumor thrombus) (5). Cho et al. (6) postulated that an APS can occur through the peribiliary vascular plexus (transplexal or peribiliary route), which is supplied by the hepatic artery and drains into either the portal vein via interlobular veins or into the sinusoids via lobular veins. Where the portal vein is occluded, this pathway may be responsible for the most prominent arterioportal communication (3). APS can also occur in a hypervascular tumor such as hepatocellular carcinoma (HCC) or hemangioma, via its draining vein (transtumoral route) (7). Lastly, a macroscopic arterioportal fistula may be caused by trauma such as penetrating injury of the liver (8).
Compromise in portal venous flow and APS
Diminished or absent portal flow occurs under different conditions, including portal vein obstruction due to tumor or bland thrombus, portal vein compression by intra- and extrahepatic tumors or hematoma, increased pressure on the hepatic parenchyma, and surgical ligation of the portal vein (3). The compensatory increase in hepatic arterial flow in cases of portal vein obstruction and compression was first demonstrated radiologically at dynamic CT by Itai et al. (9), and then angiographically by Matsui et al. (10).
Compromise in hepatic venous flow and APS
Hepatic venous flow decreases under certain conditions, including obstruction of the hepatic vein due to tumorous or bland thrombus; compression of the hepatic vein by hepatic tumors or hematoma; Budd-Chiari syndrome; right-sided cardiac failure; and mediastinal fibrosis (1). The hemodynamics in such cases seem to be very complex, and have yet to be investigated.
When the hepatic vein is acutely obstructed, it has been generally believed that the pressure gradient between the sinusoids and portal veins is reversed and the portal vein becomes a drainage channel, resulting in a functional APS and increased hepatic arterial flow (11, 12). The typical CT finding of a heterogeneous reticular enhancement pattern in Budd-Chiari syndrome has been attributed either to the portal vein fulfilling a drainage role (13), or to the dilated lymphatic vessels (14). However, it has become controversial whether portal flow is reversed in affected areas, since Hiraki et al. (15) recently reported that they failed to demonstrate reversed portal flow in their cases.
IMAGING FINDINGS
Dynamic CT
Regardless of the mechanism of APS, its dynamic CT findings are as follows: (a) the early enhancement of peripheral portal vein branches before the central portal vein is enhanced; and (b) transient hepatic attenuation difference (THAD) (1, 16, 17). CT also depicts the underlying cause of APS, including a tumor, inflammatory lesion, and thrombosis or compression of the portal or hepatic vein.
While one of the direct CT findings of APS is early enhancement of the affected peripheral portal vein, this finding is noted less frequently than at hepatic angiography (18), a discrepancy thought to be due to the limited resolution of CT in demonstrating small portal branches of the liver.
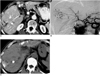
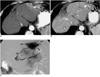
THAD indicates transient, peripheral, wedge-shaped hepatic parenchymal enhancement - usually with a straight margin - during HAP (9) (Fig. 1): this arises because increased arterial flow compensates for diminished portal flow, and because the passage of contrast material from high-pressure arterial blood into a low-pressure portal branch enhances the focal area of the liver while contrast material in the adjacent parenchyma is diluted by the nonopacified portal venous flow (1, 17). PVP dynamic imaging shows that the involved site returns to normal or nearly normal attenuation, though a defect is observed at CT during arterial portography (7). Normal vessels course through the area of THAD (1, 17).
APS due to diminished hepatic venous flow
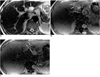
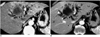
Where there is diminished hepatic venous flow, dynamic CT or MRI findings may differ according to the site and chronicity of the occlusion as well as the development of veno-venous collaterals (1, 19). Transient hepatic hyperenhancement may be seen at HAP imaging, and this area has been reported to correspond to a defect seen at CT during arterial portography and/or hyperattenuation seen at CT during hepatic arteriography (12), as in cases of portal venous flow stoppage. The differences are that (a) the straight border of the involved parenchyma intersects with the corresponding branch of the hepatic vein in portal venous occlusion and vice versa in hepatic venous occlusion (16), and (b) the vertex of the wedge-shaped hyperattenuating area points to the hepatic hilum in portal venous occlusion, but to the inferior vena cava in hepatic venous occlusion (1, 16) (Fig. 2). A recent experimental study (19) revealed that acute occlusion of the hepatic vein could induce hypoattenuation in the affected area during PVP imaging, probably because APS occurred at the presinusoidal level (through the transplexal route) and the reversed opacified portal flow escaped from the congested segment. This flow then drained into the segment adjacent to the patent hepatic vein, resulting in transient hyperenhancement. Interestingly, a congested segment was often hyperattenuated at subsequent delayed-phase imaging, a finding which was attributed to delayed washout of the contrast agent (Fig. 2).
The relationship between degree of APS and its appearance at dynamic CT
Most APS are asymptomatic and rarely of sufficient magnitude to result in total hepatofugal portal venous flow. However, if flow through an APS is extremely high, hyperkinetic portal hypertension, ischemic colitis, and even heart failure may be associated (8, 20). Successful treatment of hyperkinetic portal hypertension in these patients, with restoration of hepatopetal portal flow, has been described (20).
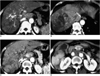
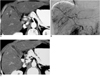
Whereas high-flow APS shows a variable amount of retrograde flow through the portal vein (Fig. 3), sometimes with reflux to the contralateral side or collaterals at HAP imaging, low-flow APS involving smaller portal branches is often seen at dynamic CT only as a THAD (7, 18, 21). Whereas high-flow APS is usually associated with organic shunt through macroscopic arterioportal fistulas or along the transvasal route (i.e. HCC), low-flow APS is associated with functional shunt which follows the transplexal or transsinusoidal route, though there are exceptions and considerable overlap (1, 16).
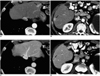
The fistulous point of APS can be located at the apex of the wedge-shaped hyperattenuated area or within this area (16, 17); the location probably depends on the flow rate through the shunt. If reversed portal flow is greater, the wider area shows hyperattenuation during HAP imaging due to the redistribution of contrast material from the reversed portal flow. Therefore, the dynamic CT appearance of APS can be affected by the degree of shunt (Fig. 4).
The presence and degree of APS, and thus its appearance at dynamic CT, represent, in many cases, the state of dynamic equilibrium. For example, it has been reported that in cirrhotic patients with nontumorous APS, the increased venous portal flow arising after a meal caused hepatofugal flow to change to hepatopetal (22).
Iodized-oil CT
Iodized oil retained in peripheral hepatic parenchyma because of APS appears as a triangle or wedge shape (Fig 5). Iodized oil in the hepatic artery reaches the portal system through the shunt, resides in the sinusoid of hepatic lobules, and remains there for up to several weeks. Much more of it is retained there than in the rest of the parenchyma without APS (23).
Dynamic MRI
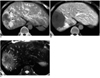
In APS, the dynamic MRI findings are basically the same as those of dynamic CT. Although investigations have been less intense than with CT, several studies (24-27) have reported the dynamic MRI findings of APS as follows: (a) early enhancement of the branches of the peripheral portal vein; and (b) subcapsular wedge-shaped homogeneous enhancement of the parenchyma during HAP, which is the MRI form of THAD (Fig. 6).
MRI has demonstrated these findings less frequently than has hepatic angiography (24); the difference is thought to be due to several technical factors involved in image acquisition, including limited spatial and temporal resolution and the magnetic field inhomogeneity produced by phased-array multicoils. Discussions provoked by this issue have been excellently summarized in a recent article by Yu et al. (24).
Unenhanced T1- and T2-weighted images
In most patients with APS, unenhanced T1-and T2-weighted imaging reveals no focal abnormal signal intensity that corresponds to the wedge-shaped region of hyperenhancement seen during HAP (24, 25). However, focal abnormal signal intensity has been reported in corresponding areas at unenhanced T1- and T2-weighted imaging, though the frequency has not been determined. Several researchers have observed high signal intensity in these areas at T2-weighted images (24, 28, 29) (Fig. 7). And this may be related to the secondary changes occurring in portal venous obstruction. If the intrahepatic portal vein is occluded for whatever reason, hepatic arterial flow is insufficiently compensated, and the liver parenchyma is injured in ways which include edema, hepatocytic depletion, and fibrosis, which may be presumed to be a cause of T2 prolongation (24, 28, 29). Conversely, T1-and T2-weighted imaging has revealed a segmental hypointense area, attributable to hemosiderin deposition (30).
Superparamagnetic iron oxide (SPIO)-enhanced images
With the introduction of SPIO-enhanced MRI, the possible relation between APS and iron metabolism has been shown to be more complex than previously thought. It has been reported that impaired portal perfusion might decrease the uptake of SPIO in histopathologically normal liver parenchyma (31), resulting in reduced signal loss at SPIO-enhanced MRI. Mori et al. (32) also reported that since Kupffer cells and hepatocytes are not injured in nontumorous APS without obstruction of the portal vein, the signal loss was more pronounced in tumorous APS in which the associated portal branches were obstructed, than in nontumorous APS.
CAUSES
Hepatocellular carcinoma (HCC)
HCC is sometimes associated with compromise of the portal or -less frequently- hepatic vein, and subsequent APS via the transvasal, the transtumoral or the transsinusoidal route (1). Alternatively, where the portal vein is compromised, the transplexal route may be involved (1, 17).
Early invasion of the branches of the portal vein is frequent, and there may be propagation along a branch of the portal vein away from the tumor or even into the main portal vein, where it manifests as a tumor cast demonstrating the 'thread and streaks' sign at hepatic angiography (33) or CT (34) (Fig. 8). Since the tumor thrombi are hypervascular and supplied by the vasa vasorum of the portal vein wall (33), blood from the hepatic artery may run through the tumor thrombi and drain into the lumen of the portal vein (transvasal route) (5). Where an APS shows extensive high flow, the shunted arterial flow is directed to the adjacent hepatic segment or contralateral hepatic lobe. Occasionally, hepatofugal flow can be recognized on HAP images (1). In HCC, macroscopic invasion of the portal vein substantially worsens the prognosis, and the detection of such invasion is thus important. Dynamic CT can demonstrate arterial enhancement within a tumor thrombus, thus allowing differentiation from bland thrombus (35).
APS around a tumor can involve the transtumoral route, along which venous drainage of the tumor into the peripheral portal vein occurs. Both dynamically, employing single-level dynamic CT, and statically, using histologic specimens, Ueda et al. (36) demonstrated blood drainage from HCCs into the portal vein.
It has been suggested that a hypervascular tumor can 'steal' arterial blood from its surrounding parenchyma (9), but this mechanism does not seem to have an important effect on the appearance of APS at dynamic imaging (1).
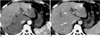
Where HCC involves invasion and occlusion of the hepatic vein, the presence of arterio-hepatic venous shunt along with coexisting invasion of the portal vein complicates the interpretation of the hemodynamics, often exaggerating the extent of the tumor at dynamic CT (Fig. 9) or MRI.
Transarterial chemoembolization (TACE)
TACE is an effective treatment method in the management of patients with inoperable HCC (37). Because this procedure may cause hepatic infarction followed by hepatic failure in the patients with large APS, the presence of APS or portal venous thrombosis may affect the method of treatment (38). If APS is present, the embolic agent will be diverted to branches of the portal vein and delivered to normal areas of the liver instead of being deposited in the tumor, a problem which can be overcome by pinpoint or superselective embolization of the APS using microcatheters if the condition is diagnosed before treatment (39).
In addition, TACE itself may be a cause of nontumorous APS (18). The etiology of APS after TACE is not known, but some investigators have speculated that peripheral arterial occlusion with subsequent dilatation of peribiliary arterioportal communication, with or without associated parenchymal damage, may give rise to this phenomenon. An APS subjected to TACE tends to be larger than other cirrhosis-related nontumorous APS (1) (Fig .9).
Other malignant tumors
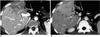
Other malignant tumors, including cholangiocarcinoma and those arising through metastasis (Fig. 10), may cause APS by direct obstruction or compression of the portal veins. This results in an area of transient hyperenhancement peripheral to the tumor, as seen at dynamic CT (39, 40) or MRI (40), which corresponds to the wedged-shaped perfusion defect demonstrated at CT during arterial portography.
Hemangioma
Although it has been generally recognized that APS is rare in hepatic hemangiomas (41), Kim et al. (42) recently reported that according to the findings of dynamic CT, a relatively high percentage of hemangiomas (25.7%) are accompanied by APS. With the increased use of multiphase dynamic imaging of the liver, more hemangiomas are imaged during HAP, thereby demonstrating APS (Figs. 4, 6). The occurrence of APS is more frequent in hemangiomas which show rapid enhancement (41, 42). In most cases, hemangioma-associated APS is low-flow.
Liver cirrhosis
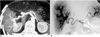
Cirrhosis alone is a well-known cause of APS on dynamic CT (18, 21) and MRI (24) (Fig. 11). Angiography demonstrates that the frequency of nontumorous APS in liver cirrhosis is very high (up to 13%) (21), but the detection of this lesion by dynamic CT (18, 24) or MRI (21, 24) seems to be lower than on angiography. A nontumorous APS occurring in liver cirrhosis is rarely of sufficient magnitude to result in total hepatofugal portal venous flow (21).
Nontumorous APS in liver cirrhosis is believed to be secondary to the observed occlusion of the small hepatic venules and the retrograde transsinusoidal filling of the small branches of the portal vein (4, 5, 18). This latter becomes a draining rather than a supplying vein, and CT during arterial portography shows these lesions as perfusion defects. Moreover, there is a compensatory increase in hepatic arterial flow resulting in a functional APS (3). A recent scanning electron microscopy study has demonstrated that hypertrophy of the peribiliary plexus in the central area of the liver and direct anastomosis in the peripheral area of the liver are major routes of arterioportal communication in experimental rat cirrhosis (43). Changes in the capillarization and permeability of sinusoids may also be related to arterioportal communication in cirrhotic liver (43, 44).
Tumorous or nontumorous APS?
Where HAP imaging of cirrhotic liver reveals a hyperattenuated focal hepatic lesion, this is usually HCC (1). However, the presence of a nontumorous APS in cirrhotic liver produces the same or similar appearance (18, 21). Differentiation between APS and tumors is, therefore, not always easy (21). Conversely, when a tumorous APS develops adjacent to a small HCC, it is sometimes difficult to detect the tumor in the APS because the whole APS area is enhanced during HAP. In some cases of HCC, only THAD is observed at CT (1, 16).
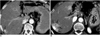
In most cases, however, a peripheral location, a wedgeshape, a straight-line margin, and the presence of normal vessels coursing through these lesions make a diagnosis of APS very likely (16, 26) (Fig. 12). Because of the three-dimensional relationship of the lesion and the direction of the CT section, nontumorous APS may be round or nodular in appearance (Fig. 13). If the entire lesion has cone shape in three-dimensional configuration, this is an important clue for differentiation of a flow-related lesion from a hepatic tumor (3).
Because a tumor is usually seen during the equilibrium phase as an area of heterogeneous low attenuation (or intensity), while the attenuation (or intensity) of a nontumorous APS never decreases below that of surrounding liver parenchyma (45), it is the equilibrium phase which is most useful for differentiation between a hypervascular tumor and APS (Fig.12).
With regard to the transient parenchymal hyperenhancement seen during HAP at dynamic MRI, normal findings on unenhanced T1- and T2-weighted imaging may help exclude hypervascular tumor (24). As previously mentioned, however, APS can be associated with focal hyperintensity at T2-weighted imaging. Moreover, a number of small HCCs can be detected only on HAP images, with no distinguishable abnormalities apparent at unenhanced T1- and T2-weighted MRI (46).
If the findings of dynamic CT or MRI are inconclusive, other studies such as arteriography, iodized-oil CT, or ultrasonography must be performed to exclude the possibility of a tumor or tumorous APS (18). In the case of nontumorous APS, no focal nodular iodized oil uptake is identifiable at iodized-oil CT (18, 21). If a suspected lesion is small, follow-up CT or MRI at 1-3-month intervals is helpful before performing invasive diagnostic procedures or treatment. The nontumorous enhancing lesions produced by reactive hyperemia and APS are usually resolved during this follow-up period. (47) (Fig. 11).
Trauma
Abdominal trauma and radiologic interventional procedures sometimes cause an organic communication between the arterial and portal venous systems or produce functional APS due to portal vein injury such as portal vein thrombosis (1). The increasing use of interventional radiologic procedures such as percutaneous biopsy (23, 48) (Fig. 3), ethanol injection (26, 49) (Fig. 5), and radiofrequency ablation (47) has increased the frequency with which these APS cases are revealed by dynamic CT and MRI. Most of these iatrogenic APS are asymptomatic, and are significant in that the observed focal perfusion abnormalities may be confused with those of a tumor (1). However, it is usually not difficult to distinguish iatrogenic APS from a new tumor or marginal recurrence by evaluating its characteristic configuration and location (49). The majority of iatrogenic APS close spontaneously and very rapidly (48), and persistent high-flow arterioportal fistulas causing hyperkinetic portal hypertension are considered relatively rare (8). In order to prevent equivocal or false-positive findings on subsequent iodized-oil CT, TACE shortly after biopsy is not recommended.
Inflammatory diseases
The actual mechanism of APS in inflammatory diseases has not been as intensively investigated as in HCC. Local inflammation can cause hyperemia of the hepatic artery and stoppage of regional portal or hepatic venous flow, as in cases of hepatic abscess (27, 50), acute cholecystitis (51), and cholangitis (17).
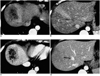
The transient wedge-shaped hyperattenuated or hyperintense area around the hepatic abscess, seen at dynamic CT (50) and MRI (27), is mainly attributed to portal vein thrombosis (27) or stenosis due to periportal inflammation (50). In our experience, the frequency of this transient hyperattenuation is high in abscess cases, a finding which seems to be associated with thrombosis of both the hepatic and portal vein (Fig. 13). In many cases, however, it is practically impossible to determine whether the abscess is secondary to pylephlebitis or vice versa (Fig. 1).
Acute cholecystitis as a cause of transient hepatic hyperattenuation has also been reported, and is caused either by the increased blood flow from the dilated aberrant cystic vein of diseased hypervascular gallbladder (51) or by thrombosis of regional portal or hepatic veins.
Aberrant vascular supply
Certain nonportal splanchnic or systemic venous supplies to normal hepatic parenchyma, so-called 'third inflow tracts', can be exaggerated in pathologic states (1). For example, an aberrant right gastric vein draining directly into the liver parenchyma (segment IV) has been described in anatomic investigations (52).
The hepatic regions supplied by these third inflow tracts have many hemodynamic features in common with the regions affected by APS, though the underlying mechanism is completely different. The hepatic regions supplied by third inflow tracts have the same imaging features as seen in APS, appearing as defects at CT during arterial portography (52), as hyperattenuating areas at CT during hepatic arteriography (53), and as transient hyperattenuating areas during HAP in dynamic imaging (1). These phenomena are also explained by the finding that the inflow of gastric or cystic venous blood through the third inflow tract occurs earlier than that of intestinal splanchnic venous blood from the portal trunk (1).
Uneven fatty liver related to APS
The association between diminished portal supply and focal fat deposition or sparing has been intensively investigated in patients with a third inflow tract (1, 3, 54). It seems likely that in diffuse fatty liver, focal sparing occurs if there is no portal flow (3, 54). Decreased portal flow may, however, induce focal fatty deposits in non-fatty liver (1, 55). It is uncertain why decreased portal flow may cause focal fatty infiltration in some cases, while giving rise to spared areas in others.
Likewise, APS can induce focal sparing in the diffuse fatty liver through increased non-lipid-rich arterial flow and decreased lipid-rich portal flow. Focally spared areas have been reported around or distal to tumors such as HCC and hemangioma (56). Although the resultant focal sparing in diffuse fatty liver can be imaged using ultrasonography and CT, chemical-shift MRI demonstrates this lesion most dramatically (57).
Miscellaneous
Congenital APS, although rare, has been reported in patients with arterioportal fistula, hereditary hemorrhagic telangiectasia, Ehlers-Danlos syndrome, and others (17).
Any cause of thromboembolism or air embolism in the portal system can induce APS. Possible causes include abdominopelvic surgery, bowel infarction, infectious processes (e.g. sepsis or appendicitis), neoplasms that invade or compress the portal venous system (e.g. pancreatic cancer), hypercoagulative states, myeloproliferative disorders, and noninfectious inflammatory processes (e.g. pancreatitis) (1).
Severe extrinsic compression of the liver due, for example, to rib compression, perihepatic peritoneal implants, pseudomyxoma peritonei, or perihepatic fluid collection can also be included as a rare cause of APS (1, 58). In this situation, low-pressure hepatic veins and/or hepatic sinusoids may be preferentially compressed and transplexal shunt may develop.
CONCLUSIONS
APS, an important hemodynamic alteration in the liver, will continue to be demonstrated with greater frequency because the temporal resolution of dynamic CT and MRI is constantly increasing.
Recognition of arterioportal shunt can suggest the presence of an unsuspected disorder and avoids false-positive diagnosis or overestimation of a hepatic disease. Familiarity with the pathophysiology of arterioportal shunt also allows investigation into the hemodynamic changes occurring in the liver in various hepatic diseases.
 XML Download