

 PDF
PDF ePub
ePub Citation
 Print
Print


To provide better anatomic detail and characterization of the pathology observed, intravenous contrast medium routinely used in abdominal computed tomography (CT). Although it has been generally agreed that rapid injection of a large amount of contrast medium can lead to improved enhancement of vascular structures, the optimal method of delivering a given amount of iodine in terms of the concentration, volume and injection rate of the medium is still a matter of controversy. A large amount of contrast medium can provide better organ enhancement, but the cost is greater and there is possible renal toxicity. Fast injection offers improved arterial enhancement, though organ enhancement may be suboptimal and the temporal window is narrow.
During the past few years, investigators have compared the effect of various volumes and injection rates of contrast medium on aortic and hepatic enhancement. These clinical studies compared different techniques within different populations, however, and the published results are controversial (1-6). Furthermore, most studies were performed in a clinical setting and thus only data from a limited portion of time-attenuation curves were analyzed. Although these previous studies have provided certain empirical information, a systemic approach to understanding the effects of various parameters on contrast enhancement within the same population is, as far as we know, lacking.
The purpose of this article is to illustrate the effect of various concentrations, volumes and injection rates of contrast media on aortic, portal venous and hepatic enhancement obtained (a) during animal experiments involving serial single-level dynamic CT of the liver (eight dogs), and (b) with the aid of a computer-aided simulated model. In addition, the considerations involved in deciding optimal scan delay for the arterial and portal venous phase are discussed.
MATERIALS AND METHODS
A. Animal Experiment
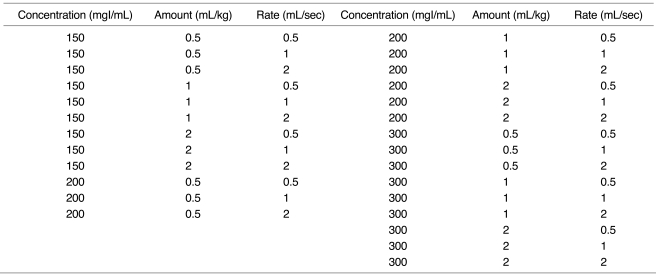
In eight dogs, single-level dynamic CT (GE Hi-speed Advantage System; Milwaukee, Wis., U.S.A.) through the liver was performed at 5-second intervals just after the injection of contrast medium for 3 minutes (120 kV, 210 mA, 10-mm slice thickness). Combinations of three different amounts (1, 2, 3 mL/kg), concentrations (150, 200, 300 mgI/mL) and injection rates (0.5, 1, 2 mL/sec) were used, and thus a total of 27 injection protocols (Table 1). These data are subsets of the authors' published data (7), and identical methods were used.
The CT number of the aorta (A), portal vein (P) and liver (L) was measured in each image, and from those 216 sets of data, time-attenuation curves of A, P and L were obtained. To compensate for individual variations in circulation time, the start of aortic enhancement (the point at which aortic attenuation began to rise above the baseline) was set to "zero time" in each set of data. Data from the same injection protocol were pooled, and for each protocol, a single time-attenuation curve was generated.
The degree of maximum enhancement (Imax) and time to reach peak enhancement (Tmax) of A, P and L were determined, and times to equilibrium (Teq) were analyzed. Time to equilibrium was defined according to a theoretical model proposed by Foley (8) in which the equilibrium phase occurs when the aortic and hepatic contrast enhancement curves become parallel and begin to decline at a similar rate. To determine quantitatively the onset of parallelism of the aortic and hepatic enhancement curves, the method of least squares was used to fit a single knot point to the linear splines of these differences as a function of time. The knot point represented the point at which the difference between the aortic and hepatic enhancement became constant (i.e. the slope to the right of the knot point was zero). The knot point was therefore taken to represent the time of onset of equilibrium.
B. Computer Model
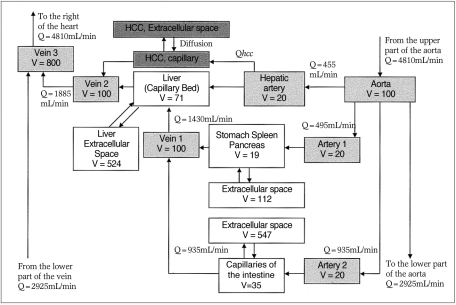
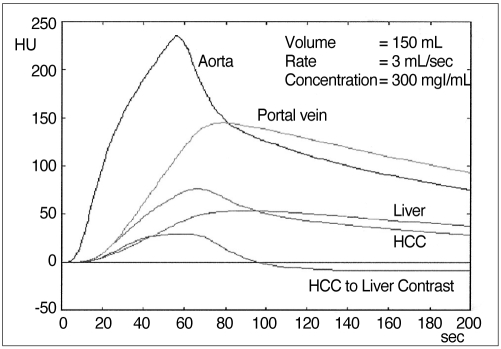
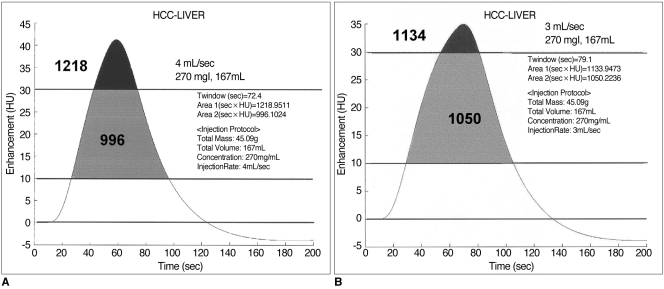
On the basis of the compartment model proposed by Bae et al.(9) (Fig. 1), a computer simulation program was designed (10). The input variables were the concentrations, volumes and injection ratesof the contrast media used, and from these the simulated time-attenuation curve of A, P and L, as well as the liver-to-hepatocellular carcinoma (HCC) contrast curve were generated. Using the simulated model, we calculated the attenuation difference between an HCC and the liver (Fig. 2). On simulated curves, we arbitrarily set 10 HU as the minimum CT attenuation difference for the detection of a hypervascular mass. If the difference between this mass and the liver is less than 10 HU, a lesion may not be detected, while a level of more than 20 or 30 HU is higher than that required to detect a lesion and therefore superfluous. On each curve, we calculated and plotted the optimal temporal window (time period above the lower threshold), total area under the curve above the lower threshold, and the area within the optimal range (Fig. 3).
RESULTS
A. Animal Experiment
a) Volume of Contrast Media
For a given concentration and injection rate, an increased volume of contrast medium led to increases in Imax A, P and L. In addition, Tmax A, P, L and Teq were prolonged in parallel with increases in injection time (Fig. 4). An increased volume of contrast medium led to shifting of the time-attenuation curve upward and to the right.
b) Concentration of Contrast Media
For a given volume and injection rate, an increased in the concentration of the contrast medium increased the degree of aortic, portal and hepatic enhancement, though Tmax A, P and L remained the same. After increasing the concentration of contrast medium, the time-attenuation curve was thus seen to shift upward (Fig. 5).
c) Injection Rate of Contrast Media
For a given volume and concentration of contrast media, changes in the injection rate had a prominent effect on aortic enhancement. The portal vein and hepatic parenchyma also showed a degree of enhancement, though this was less prominent. An increased rate of contrast medium injection led to shifting of the time-enhancement curve upward and to the left (Fig. 6).
d) Delivery Mode of a given amount of Iodine
For a given amount of iodine, either a high concentration and small volume, or a low concentration and large volume can be chosen. At the same injection rate, the combination of large volume-low concentration contrast medium produced better hepatic and vascular enhancement than did small volume-high concentration (Fig. 7). Using a large amount of contrast medium, the time taken to reach peak enhancement of both the vascular structure and the liver increased with duration of injection (graphs shifted upward and to the right.) To take advantage of the low concentration-large volume scenario, scan delay time must be adjusted.
B. Computer Simulation
b) Plotting of Optimal Temporal Window
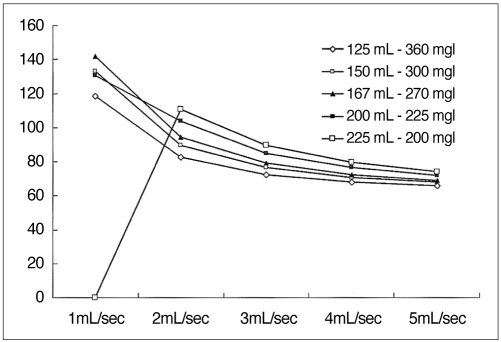
Twenty-five methods of delivering 45 g of iodine (concentration range 200-360 mgI/mL, volume 125-225 mL, injection rate 1-5 mL/sec) were tested. Optimal temporal window duration decreased as the injection rate increased (Fig. 9). However, if injection of the medium was slow and its concentration very low, enhancement was too poor to make 10 HU difference between an HCC and the liver.
c) Plotting of Optimal Enhancement
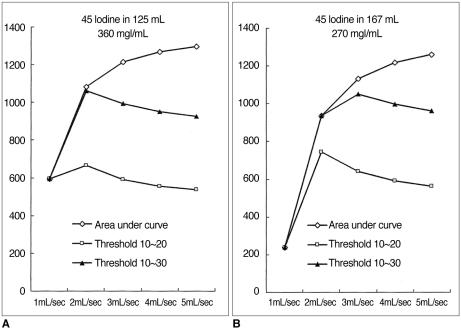
For a given HCC-liver contrast curve, the integral area of a curve between 10 and 20 (or 30) HU represented both the duration of the temporal window and the optimal contrast. The area between 10 and 20 HU was greater than 700 when using low-concentration contrast medium (< 300 mgI/mL) administered at 2 mL/sec; that between 10 and 30 HU was greatest when delivering contrast medium at a rate of 2-3 mL/sec (Fig.10). Although the total area under the curve increased in proportion to the injection rate, this increase occurred mainly above the upper threshold, and thus the temporal window was narrow and the optimal area decreased (Fig. 11).
DISCUSSION
Intravenous contrast medium is a fundamental part of abdominal CT and CT angiography. If properly administered, contrast medium enhances normal tissues and vascular structures to a degree greater than that seen with most infectious and neoplastic processes. In some types of hypervascular tumor, tumor mass enhances during the early 'arterial' phase before normal surrounding parenchyma is adequately enhanced.
If spiral CT is used, multi-phase CT after a single injection of contrast medium is possible; discussion of the optimal method for delivery of the medium has involved heated controversy, however. Chambers et al. (11, 12) reported that an increased volume of contrast medium resulted in better hepatic enhancement and a wider temporal window (i.e. increased Tmax and Teq), while an increased injection rate gave rise to greater hepatic enhancement and a narrower temporal window. With faster injection of a smaller volume, the degree of hepatic enhancement partially compensated for the decreased volume. Garcia et al. (6) reported, however, that a higher injection rate led to narrowing of the temporal window, while the effect on the hepatic parenchyma was minimal because the bolus effect was lost in the mesenteric circulation. In clinical practice, images of the liver and vascular structures are obtained only during the limited temporal window (20-40 and 60-80 secs, for example). The true dynamics of contrast media is thus not well understood.
With our single-level dynamic CT animal model, it was possible to understand the dynamics of contrast media and the effect of varying the amount, injection rate and concentration on enhancement of the aorta, portal circulation and hepatic parenchyma. As the results demonstrated, the effects of increased amounts (total iodine load and duration of injection) of contrast media were most pronounced with regard to enhancement of the portal vein and hepatic parenchyma. Tmax and Teq were also prolonged, and a wider temporal window was thus possible. In view of the great variation in individual circulation time, this wide temporal window provides a greater likelihood of satisfactory enhancement. The penalty for increased volume is cost and possible systemic toxicity.
Increased concentration (total iodine load only) strongly affected aortic enhancement, though the effect was less in the portal vein and hepatic parenchyma. Tmax and Teq were the same, and with increased concentration there was thus neither gain nor loss in terms of temporal window, a small gain in hepatic enhancement, but increased cost and systemic toxicity.
Delivery of the same amount of contrast medium at a faster injection rate resulted in a shorter duration of injection, while a faster injection rate led to higher arterial enhancement.
In the portal vein and hepatic parenchyma, however, the effect of bolus injection gradually diminished. Among the three factors tested in our experiment, an increased injection rate alone exerted least effect on the enhancement of the portal venous system and hepatic parenchyma. Possible explanations for this weak influence on hepatic parenchyma are 1) the dilution effect described by Garcia et al. (6), and 2) the possibility that a certain time might be needed for the contrast medium to leak into the interstitium of the liver. Shorter exposure to a more highly concentratel portal flow might induce less hepatic enhancement than longer exposure to a lower concentration. A shorter duration of injection at a faster rate resulted in shifting of the time-attenuation curve to the left, and significantly shortened the temporal window. An increased injection rate therefore involves the penalty of a narrowed temporal window (more chance of obtaining unsatisfactory enhancement due to individual variation without the help of the bolus tracking method) and the possible local complication of extravasation, as well as no change in cost and little gain in hepatic enhancement.
It is not known whether the prolonged injection of an increased volume leads to better detection of hypovascular hepatic lesion through increased enhancement of hepatic parenchyma, or reduces detection because delayed enhancement of the tumor interstitium lessens the attenuation difference between the tumor and hepatic parenchyma. In our experiment, changing the volume of contrast medium led to a continuous increase in attenuation of vascular structure as long as injection continued, and the redistribution process began only after injection had stopped. We therefore believe that even when the arterial, portal and interstitial components are mixed late in the injection period, contrast between the lesion and background tissue might be sufficient.
Our results also show that the so-called 'arterial' and 'portal' phase are determined not by a certain fixed time or circulation time, but by the total amount of contrast medium and injection rate. When designing a CT protocol, that for the injection of contrast medium should therefore be considered an integral part of the overall procedure.
The dynamics of contrast media in the body is complex, and in addition, measuring the attenuation of vascular structures as well as the liver using dynamic CT is a time-consuming procedure. Using the mathematical model proposed by Bae et al. (9), we built a simple computer program to test the effect of various injection protocols on the enhancement of organs (10). Although many parameters used to build a mathematical model in humans are different from those in an experimental canine model, the general shape of the curves is similar, as are changes in the shape of these curves according to variations in the parameters employed.
To detect a lesion within the liver, a certain degree of attenuation difference is required; if this is insufficient, the lesion cannot be detected. On the other hand, "too much difference" between the liver and the pathologic lesion is undesirable since this requires more contrast medium, and cost and systemic toxicity both increase. In this study, we arbitrarily set the lower and upper threshold needed for the detection of a pathologic lesion as 10 and 30 HU, respectively.
In our mathematical model, 'the area under the curve' in Figures 10 and 11 increases as a faster injection rate is used, while the duration of the optimal temporal window decreases. The 'area of optimal enhancement' - that between the lower and upper threshold - was greatest, however, at a rate of 2 to 3 mL/sec. This means that at a higher injection rate, it may be possible to detect a more conspicuous hypervascular mass while the temporal window is very narrow. In view of the great variations in individual circulation time, the part of the liver containing the tumor might thus not be imaged at the appropriate time. Although attenuation at the optimal injection rate may not be strong, the attenuation difference will, nonetheless, be sufficient for the lesion to be detected. Since the optimal temporal window is wider, there is more chance of imaging the lesion at the appropriate time. Our data suggest that the current technique of fast injection (4-5 mL/sec) might not produce adequate liver-to-tumor contrast or hepatic enhancement. Because of individual variation in circulation time, slower injection (2-3 mL/sec) of a large amount of contrast medium (longer injection period) and an optimized CT protocol might be a more effective method of obtaining good-quality abdominal CT images.
In summary, increases in volume, concentration and injection rate all resulted in improved arterial enhancement. For the portal vein and hepatic parenchyma, however, increased volume (increase in iodine load and duration of injection) had the most pronounced effect, followed by increased concentration. If cost was disregarded, increasing the injection volume was the most reliable was of obtaining good quality enhancement . The optimal way of delivering a given amount of contrast media can be calculated using a computer-based mathematical model. Before designing a CT protocol, a thorough understanding of the pharmacodynamics of contrast medium in the body is essential.


 XML Download