

 PDF
PDF ePub
ePub Citation
 Print
Print


The usual pattern of magnetic resonance (MR) appearances corresponding to the different stages of intracerebral hemorrhage (ICH) is well known. The generalized model for the appearance of ICH on MR images attributes the various signal intensity patterns of evolving ICH to the oxygenation state of hemoglobin and the integrity of the red blood cells (1, 2). Despite the frequent use of conventional MR imaging to evaluate the appearance and underlying biophysical basis of evolving ICH over the past few years, diffusion-weighted MR imaging (DWI) has only recently been recognized as a valuable investigative resource (3-8).
DWI is a relatively new technique which, by using additional strong diffusion-sensitizing gradients, is extremely sensitive to changes in the microscopic motion of water protons. It has proved valuable in the study of the natural history of ischemic stroke and is now a promising technique for the early detection of cerebral infarction in routine clinical practice (9-12). Although several recent studies using DWI (4-6, 8) have mainly focused on hyperacute and acute hemorrhages, its clinical reliability for differentiation between hemorrhage and infarction in hyperacute stroke has not been established. Furthermore, the various DWI features of ICH and the underlying biophysical mechanisms have not been clearly addressed.
The purposes of this study were to document the signal characteristics of various stages of ICH and to analyze the underlying mechanisms of signal change in ICH, as seen at DWI.
MATERIALS AND METHODS
Patients
This was a retrospective study of MR examinations performed in 38 patients [20 women and 18 men aged 41-86 (mean, 60.7) years] with spontaneous intracerebral hematoma unrelated to neoplasm, infarction, trauma or coagulopathy. ICH was caused by hypertension in 30 patients, ruptured aneurysm in two, and in six, the cause was not identified. The presence of intracerebral hematomas was proved by CT in 35 patients and by surgery in one; in two patients with old ICH, their presence was suggested by the findings of conventional MRI. MR studies were undertaken at various intervals after the onset of symptoms, and the five ICH stages were defined according to the duration of the interval between onset and initial MR examination. There were five stages: hyperacute (0-12 hrs; n=6), acute (13 hrs-3 days; n=7), early subacute (4-7 days; n=7), late subacute (8-30 days; n=10), and chronic (31 days or more; n=8).
MR imaging
For MR imaging, a 1.5-T scanner (Signa; GE Medical Systems, Milwaukee, Wis., U.S.A.) was used. The conventional MR imaging protocol included (a) axial T1-weighted spin-echo (467/9 [repetition time (TR) msec/echo time (TE) msec]), (b) axial T2-weighted fast spin-echo (3417/102 [effective echo time]), and (c) axial FLAIR (10000/400/2200 [inversion time]). The parameters of conventional MR imaging were a 256×192 matrix, a 23-cm field of view, and a 5 mm/2 mm slice thickness/intersection gap. Single-shot, spin-echo, echo-planar DWI sequences were obtained by applying diffusion gradients in three orthogonal directions at each slice, with two diffusion weightings (b value=0 and 900 or 1000 sec/mm2). Isotropic DWI was generated on-line by averaging three orthogonal-axis images. The DWI examination acquired 20 slices with parameters of 6500/96.8 (TR/TE), a 128×128 matrix, a 28-cm field of view, and 5-mm slice thickness with a 2-mm intersection gap. In addition, conventional T2* gradient-echo imaging (TR/TE = 450/20) was performed in 33 of the 38 patients and echo-planar T2* gradient-echo imaging (TR/TE=1999/20) in ten.
Analysis
Two radiologists visually evaluated the signal intensities at the center and periphery of each ICH, reaching a consensus. For each MR image, the intensity at the center of a hemorrhage was visually graded as hyper-, iso-, or hypointense compared with that of normal contralateral white matter.
Quantitative analysis was used to determine the apparent diffusion coefficient (ADC) of each ICH at its center, as seen at DWI. A region of interest (ROI) was carefully placed within the hematoma and also in contralateral normal white matter. The ROI was drawn as large as possible while using a circular or rectangular ROI on the workstation, and its area ranged from 14 to 302 mm2. In each case, one radiologist measured the ROI once. ADC values were calculated according to the formula
ADC=(lnS2 - lnS1)/Δβ
where S1=ROI signal intensity with diffusion gradients, S2=ROI signal intensity without diffusion gradients, and Δβ=the difference in b value between images with (β=900 or 1000 sec/mm2) and without (β=0) diffusion-sensitizing gradients. Relative ADC, which is the ratio of the ADC value for a lesion to that for normal contralateral white matter, was also calculated in each case. All data concerning ADC values and relative ADC for each stage are presented as means±1 standard deviation.
RESULTS
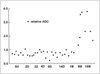
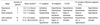
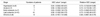
The results of the present study are summarized in Tables 1 and 2. The time course of the relative ADC is shown in Figure 1.
Hyperacute stage
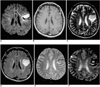
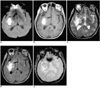
In all six patients with hyperacute ICH, the signals at the center of the hematoma were hyperintense at DWI, isointense on T1-weighted images, and heterogeneously hyperintense on T2-weighted and FLAIR images. At DWI, focal marked hypointensity was seen in all patients at some portion of the hematoma, which was surrounded by a hyperintense rim. In all patients, T1-weighted imaging revealed a thin, slightly hypointense rim. On T2-weighted images, this was iso- or hypointense and was located at the periphery of the hematoma, inside the region of perilesional hyperintensity, a finding consistent with edema in adjacent parenchyma. Compared with T2-weighted images, conventional gradient-echo images showed mixed iso- or hyperintensity at the center of the hemorrhage and a more noticeable hypointense rim at its periphery. Echo-planar gradient-echo images were obtained in three of six patients and showed prominent signal loss surrounding the hematoma and heterogeneous signal intensity at its center. Mean relative ADCs at the center of a hyperacute hemorrhage and at the hyperintense rim surrounding it were 0.73 and 1.45, respectively.
Acute and early subacute stages
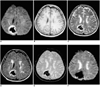
In all 14 patients whose hematomas were acute or early subacute, these appeared markedly hypointense on diffusion-weighted, T2-weighted, FLAIR, and gradient echo images (Figs. 3, 4). T1-weighted images showed the hematoma as heterogeneously isointense at the acute stage and markedly hyperintense at the early subacute stage. At both stages, DWI consistently revealed that in all these patients, a thin, markedly hyperintense rim, varying in thickness and completeness, was present at the periphery of the hematoma. The bright rims corresponded to the areas of hyperintensity seen on T2-weighted images to surround hematomas. Echo-planar gradient-echo images were obtained in five of the 14 patients with acute and early subacute ICHs. The signal intensities observed were markedly hypointense, though the hyperintense rim seen at DWI was not demonstrated. Mean relative ADCs at the center of the hematoma were 0.72 and 0.70 at the acute and early subacute stages, respectively. In the bright rim surrounding the hemorrhage, the mean ADC was 0.98 and the mean relative ADC was 1.23.
Late subacute stage
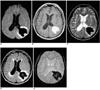
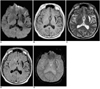
In all ten patients with hematomas at this stage, diffusion-weighted, T1- and T2-weighted, and FLAIR images showed marked hyperintensity (Fig. 5), While gradient-echo images demonstrated heterogeneous hyperintensity. In no case was the bright rim seen at DWI at the acute and early subacute stages still visualized. The mean relative ADC at the late subacute stage was 0.72.
Chronic stage
At DWI, four of the eight chronic hematomas appeared homogeneous and markedly hypointense, and the remaining four showed an isointense center surrounded by a hypointense rim. On T2-weighted and gradient-echo images, a complete hypointense rim surrounded the hematoma's hyperintense center (Fig. 6). The mean relative ADC at the core of a chronic hemorrhage was 2.56.
DISCUSSION
In many clinical situations, especially those in which acute ischemic stroke is suspected, DWI has become an integral part of MRI examinations. With the advent of early management for patients with acute cerebral ischemia, it is also one of the imaging modalities of choice for the assessment of tissue viability (13, 14). Before the initiation of thrombolytic treatment or other interventions, however, an optimal treatment outcome demands accurate discrimination between ischemic and non-ischemic stroke, especially acute intracerebral hemorrhage.
It is known that a T2-weighted MR imaging finding of hyperacute hematoma is central hyperintensity accompanied by a hypointense rim (15-18). The central hyperintensity seen at T2-weighted imaging has been attributed to intracellular oxyhemoglobin and the hypointense rim to early intracellular deoxyhemoglobin at the periphery of a hematoma, which causes T2 shortening. This characteristic hypointense rim has been reported to occur within the first few hours of hemorrhage (15-18), and in patients with acute neurologic symptoms is also valuable for differentiating between acute ischemic stroke and hemorrhage. However, because central hyperintensity is nonspecific and can also be seen in acute infarction, and the peripheral hypointense rim may not be obvious, it is often difficult to identify hyperacute hematoma using only conventional T2-weighted imaging. The peripheral hypointense rim seen in hyperacute hematoma is more obvious on conventional gradient-echo images and most prominent on EPI gradient-echo images.
In our study, the signal intensity of hyperacute ICH observed at DWI was consistent with the findings of previous studies (4-6, 8). The MR features of hyperintensity at the core of a hematoma and focal variable hypointensity were consistently found in all patients with hyperacute ICH. Hypointensity within a hyperacute hematoma, revealed by DWI, may be an important feature for differentiating hemorrhage from infarction in the practical clinical setting of hyperacute stroke, but the reliability of DWI for identifying hemorrhage has not yet been established.
The precise biophysical explanation for decreased ADC at the core of a lesion in hyperacute hematoma is uncertain. One possibility is shrinkage of extracellular space due to resorption of plasma with clot retraction (18-20), which causes high viscosity. Other possible explanations include changes in the conformation of the hemoglobin molecule (2, 6, 21) and a contraction of intact red blood cells together with decreased intracellular space (6, 22).
Previous studies have suggested that the cause of hypointensity within a hyperacute hematoma, seen on T2-weighted images, may be the early presence of paramagnetic deoxyhemoglobin (4, 5, 8). The hypointense rim of hyperacute ICH seen at T2WI was more obvious on gradient-echo images with stronger susceptibility effect. However, the hypointense rim seen at DWI did not accurately correspond to that seen on T2-weighted and gradient-echo images (Fig. 2). Despite the stronger susceptibility effect, it is not certain why this is so. The focal hypointensity seen at DWI within a hyperacute hematoma might involve another causative factor: one possibility is a portion of unclotted liquid separated from a retracted clot.
In our study, the cores of lesions found in acute and early subacute hematomas were markedly hypointense at DWI as well as on T2-weighted images. This hypointensity has been attributed to the magnetic field inhomogeneity caused by paramagnetic intracellular deoxyhemoglobin in acute hematoma (1, 2, 16, 23, 24) and paramagnetic intracellular methemoglobin in early subacute hematoma (1, 23). Does et al. (25) and Schaefer et al. (26) reported that magnetic susceptibility effects caused a drop in ADC, and suggested that an accurate ADC value for acute and early subacute hematomas could not be reliably calculated. Likewise, in our study, the cores of acute and early subacute ICHs showed reduced ADC values compared with normal contralateral white matter, and , in addition, a variable, markedly hyperintense rim surrounding hyperacute, acute and early subacute hematomas was identified in all patients at DWI. Although Wiesmann et al. (8) suggested the susceptibility artifact as a possible cause of the hyperintense rim shown by DWI to surround acute and subacute hematomas, in this study such a rim was not seen on EPI gradient-echo images, which showed a stronger susceptibility effect than DWI. We believe that the rim is not caused by a susceptibility artifact due to a paramagnetic substance such as intracellular deoxyhemoglobin or methemoglobin, but may be related to the T2 shine-through effect caused by vasogenic edema surrounding the hematoma. Evidence for this is that the rim corresponded to the area of hyperintense perilesional edema seen on T2-weighted images to surround the hematomas, and that its ADC value was higher than that of normal contralateral white matter.
Our data showed that in late subacute hematoma the lesion core was hyperintense at DWI and its ADC value was lower than that of normal white matter. Atlas et al. (6) reported that the ADC value of late subacute ICH was higher than that of normal white matter, and suggested that lysis of red blood cells may lead to increased molecular diffusion. According to Ebisu et al. (3), however, relative ADC at the core of an intracerebral hemorrhage tended to remain low even at chronic stages. We believe that variations in ADC do not depend simply on whether or not red blood cell membranes are intact. At the late subacute stage of hematoma, red blood cell lysis occurs and the compartmentalization of methemoglobin is lost, resulting in the elimination of the inhomogeneous susceptibility effect (1, 2, 23). In addition, the intracellular contents are distributed in the extracellular space, possibly causing high viscosity. Other biological changes at this stage include high cellularity resulting from the infiltration of inflammatory cells and macrophages (2, 3). All these changes may affect molecular diffusion and the ADC of a hematoma. At the late subacute stage, this latter may, therefore, be related to the nature of the biological change occurring in hematomas, and during the evolution of these, ADCs appear to vary.
At the chronic stage of ICH, paramagnetic hemosiderin and ferritin (1, 2, 27) are found at the periphery and seen at DWI and on T2-weighted images as a dark rim surrounding the hematoma. At DWI, because the ADC value increases as the lesion approaches a cystic cavity, the lesion core of a chronic hematoma appears isointense at the early chronic stage and hypointense at the late chronic stage. In our study, all chronic hematomas were at the late chronic stage, and their ADC values were therefore higher than those of normal white matter.
The limitations of this study include the lack of histopathological confirmation and the small number of cases. Although a complete understanding of the underlying biophysical basis may require further studies with a large population, our data suggest that the appearance of intracerebral hematomas on diffusion-weighted images is influenced not only by ADC values but also by magnetic susceptibility and T2 shine-through effects. In addition, our study corroborates the key features of evolving intracerebral hematomas, as depicted by conventional MR imaging.
In conclusion, DWI demonstrated the characteristic MR features of intracerebral hematoma at various stages. We suggest that the biophysical mechanisms behind the signal changes observed at DWI are multifactorial. A better understanding of the DWI findings of intracerebral hematoma can be helpful for the differentiation of intracerebral hematoma from acute infarction and for the further characterization of intracranial hemorrhagic lesions.
 XML Download