

 PDF
PDF ePub
ePub Citation
 Print
Print


INTRODUCTION
The periaqueductal gray matter (PAG), a small brain structure in the midbrain, is at the center of a powerful descending antinociceptive neuronal network (12). PAG dysfunction, which may be associated with iron deposition and considered a possible “generator" of migraine attacks (134), is commonly associated with migraines (5). Previous studies have demonstrated that specific PAG lesions facilitate the identification of multiple sclerosis (678910) and infarction (11). Similarly, nonspecific PAG lesions were revealed in patients with episodic migraine (EM) patients in our previous study (12). Resting-state functional magnetic resonance imaging (MRI) also demonstrated that disrupted functional connectivity of PAG subregions are associated with EM (13). However, the neurological mechanism for nonspecific PAG lesions in EM has not been elucidated until now.
Texture characteristics are the intrinsic properties of an image and provide an efficient image classification system by which subtle alterations in the gray level distribution of an image can be detected (14). Texture analysis had been widely applied in the identification of brain tumors (1516), epilepsy (1718), muscular dystrophy (19), attention-deficit/hyperactivity disorder classification (20), and mild cognitive impairment (21). However, MRI texture feature analysis has not been applied in migraine patients thus far.
Previous studies (67891011) have demonstrated that demyelinated and infarction lesions contribute to the genesis of a migraine. These lesions are considered a definite pathogenesis of migraine and are easily assessed by visual observation. However, most migraine patients have no significant lesions in the PAG region, and the explicit neurological mechanism of the PAG has not been elucidated in migraine with visual assessment. Texture features analysis provides an opportunity to fully investigate the neurological mechanism of the PAG in migraine. In this study, we hypothesize that migraine patients without T2-visible lesions possess MRI texture features changes. We investigated the texture parameters of the PAG including angular second moment (ASM), contrast, correlation, inverse difference moment (IDM) and entropy in migraine patients. The individual PAG volume was segmented and MRI texture feature analysis was performed using the gray level co-occurrence matrix (GLCM) (2223).
Go to : 
MATERIALS AND METHODS
Subjects
Written informed consent was obtained from all participants according to the approval obtained from the ethics committee of the local Institutional Review Board of Chinese PLA General Hospital (S2015-085-01). Eighteen EM patients and 16 chronic migraine (CM) patients were recruited between May 2013 and May 2015 from the International Headache Center, Department of Neurology at a local hospital. All of the following inclusion criteria were fulfilled: 1) EM is defined as migraine attack days being less than 15 days per month. The definition of migraine refers to 1.1 migraine without aura and 1.2 migraine with aura in the International Classification of Headache Disorders, Third Edition (beta version) (ICHD-III beta) (24); 2) diagnosis of 1.3 CM, and 1.1 and 1.2 migraine based on ICHD-III beta (19); 3) no migraine preventive medication was used in the past 3 months; 4) age was between 20 and 60 years; 5) right-handed; 6) absence of any chronic disorders, including hypertension, hypercholesterolemia, diabetes mellitus, cardiovascular diseases, cerebrovascular disorders, neoplastic diseases, infectious diseases, connective tissue diseases, other subtypes of headache, chronic pain other than headache, severe anxiety or depression preceding the onset of headache, psychiatric diseases, etc.; 7) absence of alcohol, nicotine, or other substance abuse; 8) patient's willingness to engage in the study; and 9) without T2-visible lesions on MR images in the PAG region. Eighteen normal controls (NC) were recruited and included in the study. Inclusion criteria were similar to those of patients, except for the first two items. NC should never have had any primary headache disorders or other types of headache in the past year. General demographic and headache information were recorded and evaluated in our headache database. Additionally, anxiety, depression, and cognitive function of all the participants were evaluated using the Hamilton Anxiety Scale (HAMA) (25), the Hamilton Depression Scale (HAMD) (26), and the Montreal Cognitive Assessment (MoCA) Beijing Version (www.mocatest.org), respectively. The exclusion criteria were the following: 1) history of cranium trauma; 2) illness interfering with central nervous system function; 3) psychotic disorder; and 4) regular use of a psychoactive or hormone medication. The study protocols were approved by the ethical committee of a local hospital and complied with the Declaration of Helsinki. MRI scans were taken in the interictal stage at least three days after a migraine attack for EM patients. All the patients were administered the Visual Analogue Scale (VAS) and the Migraine Disability Assessment Scale (MIDAS). All subjects were right-handed and underwent a conventional MRI examination. Then, subjects with cerebral infarction, cerebral malacia, or occupying lesions were excluded. Patients were instructed to abstain from alcohol, nicotine, caffeine, and other substance use for at least 12 hours before a MRI examination.
MRI Acquisition
Images were acquired on a GE 3.0T MR system (DISCOVERY MR750; GE Healthcare, Milwaukee, WI, USA) and a conventional eight-channel quadrature head coil was used. All subjects were instructed to lie in a supine position and formed padding was used to limit head movement. A three-dimensional T1-weighted fast spoiled gradient recalled echo sequence generating 180 contiguous axial slices (repetition time = 6.3 ms, echo time = 2.8 ms, flip angle = 15°, field of view = 25.6 × 25.6 cm, matrix = 256 × 256, number of acquisition = 1) was used to perform the new segment and the individual PAG creation. Oblique axial T2-weighted imaging, T1 fluid-attenuated inversion recovery and diffusion weighted imaging were also performed. All imaging protocols were identical for all subjects.
MR Image Processing
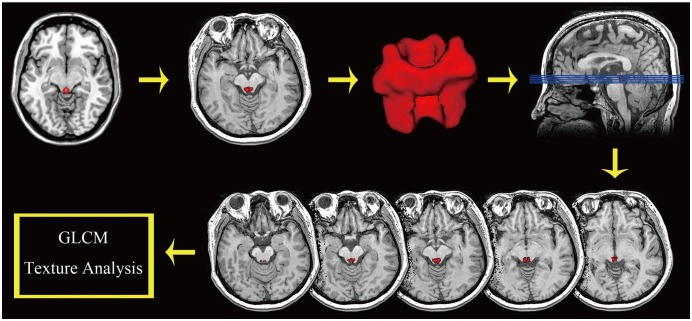
All MR structural image data were processed using Statistical Parametric Mapping 12 (SPM 12) (http://www.fil.ion.ucl.ac.uk/spm/) running under MATLAB 7.6 (The Mathworks, Natick, MA, USA) to perform segmentation (27). The image processing included the following steps: 1) Create the PAG template based upon the mni_icbm152_ gm_tal_nlin_asym_09a template using MRIcron; 2) Develop the individual PAG segment by applying the deformation field (generated by the new segment) to the PAG template. Each individual PAG was segmented correctly and accuracy was ensured by inspection and confirmation using MRIcron software (http://www.mricro.com); and 3) Calculate the PAG texture parameters over the whole PAG using the GLCM with the GLCM plugins on ImageJ (1.50i) (https://imagej.nih.gov/ij). The texture parameters included the ASM, contrast, correlation, IDM and entropy (2228) (Fig. 1).
Statistical Analysis
Statistical analyses were performed using the PASW Statistics Software Version 18.0 (SPSS Inc., Chicago, IL, USA). One-way analysis of covariance and partial correlation analysis were conducted with age and sex as covariates. Statistically significant difference was set at a p value of less than 0.05. Receiver operating characteristics (ROC) curve analysis was applied to evaluate the diagnostic efficacy of the PAG texture parameters. Area under the curve (AUC) estimates that were greater than 0.7 were defined as having reasonable diagnostic value.
Go to :
RESULTS
Demography and Neuropsychological Test
Table 1 shows that there were the following significant differences: 1) for age between the EM (33.4 ± 10.7 years) and CM groups (42.4 ± 8.7 years) (p = 0.000); 2) for HAMA score between the NC (9.67 ± 3.16) and EM groups (10.89 ± 7.26) (p = 0.000); 3) for HAMD scores between the EM (15.67 ± 9.85) and CM groups (16.31 ± 10.52) (p = 0.000); and 4) for MoCA scores among NC (26.89 ± 2.47), EM (29.16 ± 1.47), and CM patients (22.94 ± 5.37) (p = 0.000). Significant differences were also found for MIDAS (p < 0.001) and onset frequency (p < 0.001) between EM and CM patients (Table 1).
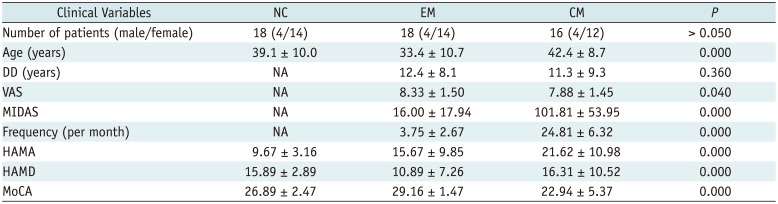
Table 1
Clinical Characteristics of NCs, EM Patients, and CM Patients
![]()
Comparison of the PAG Texture Parameters among NC, EM, and CM Groups
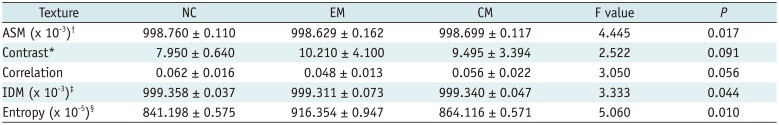
Table 2 shows that there was a significant difference for ASM, IDM, and entropy in EM patients (998.629 ± 0.162 × 10⁻³, 999.311 ± 0.073 × 10⁻³, 916.354 ± 0.947 × 10⁻⁵) compared to that found in NC patients (998.760 ± 0.110 × 10⁻³, 999.358 ± 0.037 × 10⁻³ and 841.198 ± 0.575 × 10⁻⁵) (p < 0.05). The entropy was significantly lower in the CM group (864.116 ± 0.571 × 10⁻⁵) than that found in the EM group (p < 0.05). Figure 2 shows the distribution of decreased ASM and IDM scores among EM patients, increased entropy in EM patients compared to that found in the NC patients, and decreased entropy in CM patients compared to the EM patients.
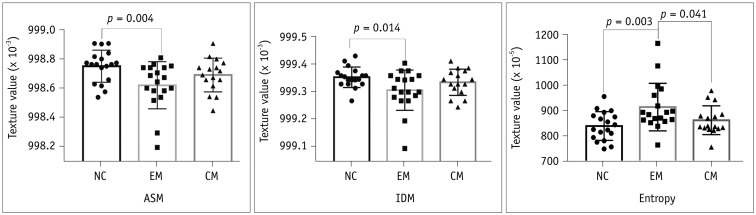 | Fig. 2Comparison of PAG texture (ASM, IDM and entropy) in NC, EM, and CM patients.ASM = angular second moment, CM = chronic migraine, EM = episodic migraine, IDM = inverse difference moment, NC = normal control
|
Table 2
Comparison of PAG Texture among NC, EM, and CM Using Analysis of Covariance
*Without unequal variance using Dunnett's T3 for one-way ANOVA, †Significantly different for ASM between NC and EM (p = 0.004), ‡Significantly different for IDM between NC and EM (p = 0.014), §Significantly different for entropy for NC vs. EM (p = 0.003) and EM vs. CM (p = 0.041). ASM = angular second moment, IDM = inverse difference moment, PAG = periaqueductal gray matter
![]()
ROC Curve Analysis of the PAG Texture among NC, EM, and CM Groups
Table 3 demonstrates that the ASM scores had a larger AUC among the NC vs. EM patients (AUC = 0.776) compared to the IDM scores among the NC vs. CM patients (AUC = 0.694). Entropy provided a fair level for the diagnostic efficacy in the NC vs. EM groups (AUC = 0.750) and the EM vs. CM groups (AUC = 0.719) (Fig. 3).
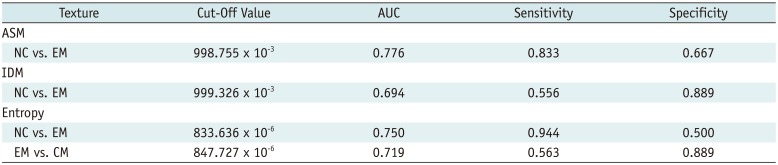
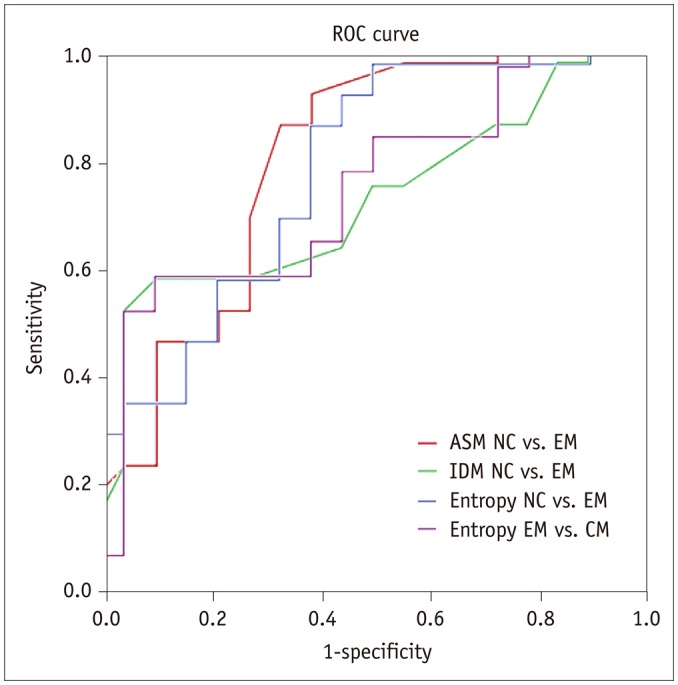 | Fig. 3ROC curve among each group.ASM for NC vs. EM had largest area under curve value (0.776). ROC = receiver operating characteristics
|
Table 3
Receiver Operating Characteristics Curve Analysis for ASM, IDM and Entropy among NC, EM, and CM
![]()
Partial Correlation Analysis between the PAG Texture Parameters and the Clinical Variables
Table 4 indicates that ASM was negatively related to disease duration (DD) (r = −0.478, p = 0.045) and MIDAS (r = −0.553, p = 0.017) among EM patients, and entropy was positively related to DD (r = 0.566, p = 0.014) and MIDAS (r = 0.614, p = 0.001) in the EM group. The ASM and IDM scores were negatively related to the VAS score (r = −0.552 and p = 0.026, r = −0.581 and p = 0.018, respectively) (Fig. 4) in the CM group.
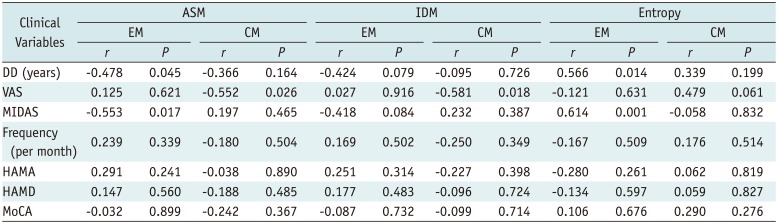
 | Fig. 4Scatter plot for ASM, entropy and IDM in EM, and CM patients.ASM was negatively related to DD (A) and MIDAS (E) in EM, and it was negatively related to VAS (C) in CM. Entropy was positively related to DD (B) and MIDAS (F) in EM, and IDM was negatively related to VAS (D) in CM. DD = disease duration, MIDAS = Migraine Disability Assessment Scale, VAS = visual analogue scale
|
Table 4
Partial Correlation Analysis between PAG Volume and Clinical Variables
![]()
Go to :
DISCUSSION
Gray level co-occurrence matrix has proved to be a popular statistical method for extracting textural features from images. The current study demonstrated that ASM, IDM and entropy scores are significantly different in the EM group compared to that found in the NC group. Further ROC analysis also indicated that these texture features showed a fair diagnostic efficacy for distinguishing EM patients from NC patients.
Angular second moment is also called uniformity or energy and represents the image homogeneity. High ASM scores imply that the image has good homogeneity and the pixels are very similar (29). In the present study, EM patients showed a low ASM score (p < 0.05) and CM patients showed a slightly lower ASM trend compared with that among NC patients (p > 0.05). These altered ASM texture features suggest decreased PAG image homogeneity presented in migraine. In the previous study (13), the disrupted functional connectivity of the PAG subregions (bilateral ventrolateral and left dorsolateral PAG) was demonstrated in EM which reflected the altered PAG function and influenced some neuron synchronism in resting state in EM patients. Therefore, it can be speculated that PAG dysfunction is associated with altered PAG homogeneity (i.e., low ASM value). The heterogeneous PAG image might also be relevant with iron deposition, which would produce the signal change of the PAG because of the paramagnetic effects (3).
Receiver operating characteristics analysis demonstrated that the ASM score provides a fair level for the differential diagnosis of EM from NC (AUC = 0.776), which indicates that the ASM score might be considered as an imaging biomarker for the diagnosis of EM. Partial correlation analysis demonstrated that ASM was negatively related to DD and MIDAS. This finding further supports that ASM could provide a good assessment method for the severity of EM.
The IDM score represents the local homogeneity of the image. High IDM scores represent uniformity in the gray level in the image (29). The PAG region contains multiple neurons (30313233) such as L-glutamate γ-aminobutyric acid, opioids (particularly enkephalin), and substance P. The PAG dysfunction of migraine patients would influence the neuronal function and further change the local uniformity in gray level. Therefore, decreased IDM scores might be attributed to the dysfunction of the PAG in EM patients (13). Figure 2 suggests that the difference in IDM scores between the NC and EM groups was relative small compared with that found in ASM scores. The ROC analysis indicated a lower AUC (0.694) in the IDM scores compared to that found in the ASM scores. Hence, the IDM score has relatively lower diagnostic efficacy for the EM group compared to the NC group. Although the IDM score was negatively related to the VAS score for CM patients, caution should be applied when evaluating pain intensity using the altered IDM value. The IDM results demonstrated that the IDM score may be used as an imaging biomarker for the different types of migraine.
Entropy represents the amount of information in the image that is needed for the image compression. The loss of image information or message can be measured by entropy (29). In this study, EM patients showed a significantly higher level of entropy than that found among NC and CM patients which suggests that the loss of information in the gray level image of the PAG was high in the EM group compared to that found in the NC and CM groups. The increased entropy of the PAG may be used as an imaging biomarker for the evaluation of PAG dysfunction in EM patients. In contrast to the EM group, patients with CM showed a decreased entropy value without any correlation with clinical variables. Therefore, the current results confirm that the entropy value may reflect the intrinsic change between the different types of migraine. Further ROC analysis provided a fair level for the compared groups NC vs. EM and EM vs. CM, which indicated that entropy demonstrates a significant differential value in the EM from NC groups and the CM from EM groups.
The current study focused on the differences among texture features using the GLCM method in migraine patients and some significant texture features were captured. However, there were several limitations in our study. First, the sample size was relatively small. Future studies need to utilize a larger sample size. Second, this study was based on the GLCM method to calculate the texture features of the PAG. Other novel texture analysis methods such as histogram analysis and first order texture analysis should be considered in the future. Finally, a 3D high-resolution structural image was used to calculate the PAG texture features because of its high contrast for PAG images. Future studies should consider other MR images such as a T2-weighted image and susceptibility-weighted image for texture analysis.
In conclusion, the present study demonstrated that altered PAG texture features including ASM, IDM and entropy present in EM patients are undetectable by visual assessment. PAG texture features evaluations can provide the direct impairment evidence of PAG dysfunction and be used as a diagnostic and evaluated imaging biomarker in EM patients.
Go to :
 XML Download