

 PDF
PDF ePub
ePub Citation
 Print
Print


INTRODUCTION
In the maxillomandibular regions, cystic ameloblastomas and keratocystic odontogenic tumors (KCOT) are the major aggressive odontogenic tumors. Cystic ameloblastomas can be further divided into multicystic and unicystic types (1). Multicystic ameloblastomas have solid portions that show marked enhancement in contrast-enhanced MR imaging, which provides an easy differential diagnosis between multicystic ameloblastomas and KCOT (23). However, there is considerable overlap between the morphological characteristics of unicystic ameloblastomas and KCOT. Both tumors demonstrate similar radiologic features; moreover, the cystic lesions cause cortical expansion and thinning, which makes the diagnosis difficult in many cases. They are locally aggressive and are apt to recur if surgical treatment is incomplete (45). Additionally, the precise preoperative differential diagnosis of these two tumors could help surgeons in the planning of treatment, as the two tumor types require different treatment strategies. Unicystic ameloblastomas have a higher recurrence rate than keratocystic odontogenic tumors; therefore, Rosenstein et al. (6) suggested using a more aggressive treatment for unicystic ameloblastomas. Diffusion-weighted imaging (DWI) provides an additional tool for evaluating cystic lesions (78). To our knowledge, only two studies have previously reported on the use of DWI for differentiating between ameloblastomas and KCOT (910), and no study has evaluated the differentiation of unicystic ameloblastomas and KCOT based on DWI. In this study, we aimed to characterize unicystic ameloblastomas and KCOT in the maxillomandibular regions based on DWI features and apparent diffusion coefficients (ADCs).
Go to : 
MATERIALS AND METHODS
Patients
The Institutional Review Board of our hospital approved the study, and informed consent was obtained from all patients. Between 2011 and 2015, we prospectively studied 40 successive patients who were diagnosed with odontogenic cystic lesions based on physical examination findings and the finding of a large well-circumscribed radiolucent lesion on panoramic radiographs and/or CT scans conducted in our hospital. The patients underwent conventional MR imaging and DWI. DWI was successful in every case and no patient was excluded due to poor DWI image quality.
Independent Ethics Committee of Shanghai Ninth People's Hospital affiliated to Shanghai Jiao Tong University, School of Medicine (Number [2011]4).
Conventional MR Imaging and Diffusion-Weighted Imaging
Conventional MR imaging and diffusion-weighted echo-planar MR imaging were performed on a 1.5T Signa TwinSpeed system (GE Healthcare, Milwaukee, WI, USA) using a neurovascular array coil. Conventional axial T1-weighted (repetition time [TR] / echo time [TE] 600/11 ms) spin-echo sequences, axial T2-weighted (TR/TE 4700/85 ms) fast spin-echo sequences, and coronal T2-weighted (TR/TE 3200/100 ms) with fast spin-echo sequences in fat suppression were acquired. The parameters included: matrices of 256 × 192 (axial) and 320 × 160 (coronal), section thickness of 5 mm, fields of view (FOV) of 20 cm (coronal) and 24 cm (axial), 3 acquisitions, and intersection spaces of 1 mm. The contrast-enhanced images were acquired with an injection of 0.1 mmoL gadolinium/kg body weight, at a rate of 1.5 mL/s. Using the same coil, axial diffusion-weighted MR images were acquired with a single-shot spin-echo type of echo-planar technique with b factors of 0, 500, and 1000 s/mm2. The parameters were: TR = 2500−3000 ms, TE = 70 ms, matrix 128 × 128, section thickness 5 mm with a 0.5 mm intersection gap, FOV of 24 cm, and 8 acquisitions. Diffusion gradients were applied in each of the three orthogonal directions, with the same strength in each direction. The DWI data were converted to color ADC maps using the FuncTool ADC software package (GE Healthcare). The conventional MR imaging and DWI had an approximate 10 minute acquisition time per patient each.
Image Analysis
The lesions that retained signal on DWI at b = 1000 s/mm2 were characterized as having restricted diffusion. The lesions that lost signal on DWI at b = 1000 s/mm2 were characterized as having free diffusion. Regions of interest (ROI) with a minimum area of 1 cm2 were manually drawn along the visible peripheries of the lesions on axial sections of ADC maps. For every lesion, we measured the ROI on successive slices of ADC maps and subsequently calculated the mean ADC values based on the ROI. The ADC values are presented as mean ± standard deviation (A × 10-3 mm2/s).
Gold Standard
Histopathological diagnosis after biopsy or surgical resection was considered as the gold standard for characterization of the lesions.
Statistical Analysis
Mann-Whitney U-tests were used to assess the significance of the differences in the ADCs between the two tumors. A p value of < 0.001 was considered as statistical significance. The tests were performed using the SPSS software (SPSS version 13 for Windows, SPSS Inc., Chicago, IL, USA).
Go to :
RESULTS
Our study included 40 patients with odontogenic tumors and cysts, of whom 11 patients had unicystic ameloblastomas, 15 patients had KCOT, 11 patients had multicystic ameloblastomas, and three patients had dentigerous cysts.
Conventional MRI sequences in patients with unicystic ameloblastomas (n = 11) showed that the lesions were of low to high signal intensity on T1-weighted images, and high signal intensity on T2-weighted and fat-suppressed T2-weighted images. In five patients with unicystic ameloblastomas, the lesion showed rim enhancement on gadolinium enhanced T1-weighted images. On diffusion-weighted images, the cystic lesions showed free diffusion with a mean ADC value of 2.309 ± 0.17 × 10⁻³ mm2/s (Fig. 1).
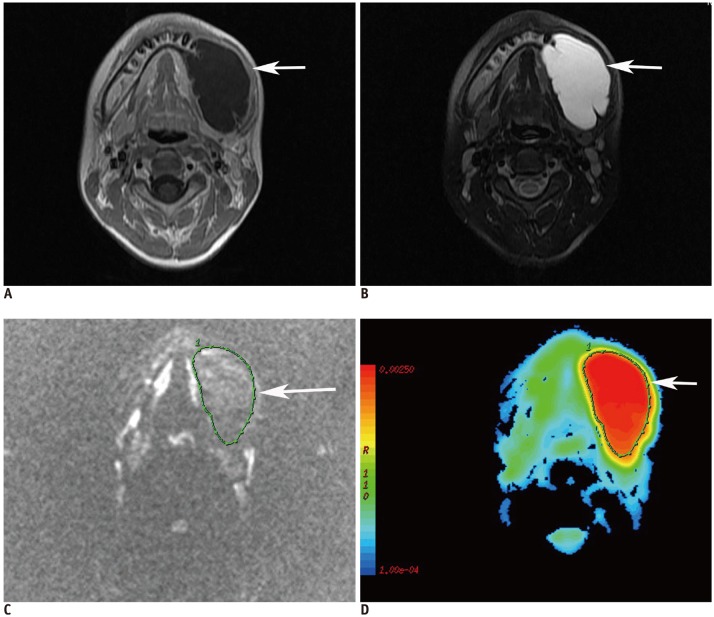 | Fig. 112-year-old male patient with unicystic ameloblastoma at left mandibular region.
A. Axial contrast-enhanced T1-weighted image shows unilocular cystic lesion (arrow) with rim enhancement. B. Axial fat-suppressed T2-weighted image shows lesion (arrow) with high signal intensity. C. Diffusion-weighted image at b = 1000 s/mm2 shows loss of signal within lesion (arrow).
D. Axial color ADC map shows lesion (arrow) with high ADC (2.013 × 10⁻³ mm2/s). ADC = apparent diffusion coefficient
|
In patients with KCOT (n = 15), the lesions were of low to high signal intensity on T1-weighted images, and high signal intensity on T2-weighted and fat-suppressed T2-weighted images. In six patients, the lesions showed rim enhancement on gadolinium enhanced T1-weighted images. On diffusion-weighted images, the cystic lesions showed restricted diffusion with a mean ADC value of 0.923 ± 0.20 × 10⁻³ mm2/s (Fig. 2).
 | Fig. 225-year-old male patient with keratocystic odontogenic tumors at right mandibular region.
A. Axial contrast-enhanced T1-weighted image shows unilocular cystic lesion (arrow) with rim enhancement in mandibular ramus. B. Axial fat-suppressed T2-weighted image shows lesion (arrow) with high signal intensity. C. Diffusion-weighted image at b = 1000 s/mm2 shows that lesion has retained signal (arrow). D. Axial color ADC map shows lesion (arrow) with low ADC (1.02 × 103 mm2/s).
|
Conventional MRI sequences in patients with multicystic ameloblastomas (n = 11) showed a mixed pattern of solid and cystic components. The cystic areas showed low to high signal intensity on T1-weighted images, high signal intensity on T2-weighted and fat-suppressed T2-weighted images, and no enhancement on post-contrast enhanced T1-weighted images. The cystic areas showed free diffusion with a mean ADC value of 1.936 ± 0.29 × 10⁻³ mm2/s. Solid areas appeared as low to intermediate signal intensity on T1-weighted images, intermediate to high signal intensity on T2-weighted and fat-suppressed T2-weighted images, and showed enhancement on post-contrast enhanced T1-weighted images. The solid areas showed restricted diffusion with a mean ADC value of 1.363 ± 0.20 × 10⁻³ mm2/s
In patients with dentigerous cysts (n = 3), the lesions were of low to high signal on T1-weighted images, high signal intensity on T2-weighted and fat-suppressed T2-weighted images and showed enhancement of the walls on post-contrast enhanced T1-weighted images. The cystic lesions showed restricted diffusion with a mean ADC value of 1.257 ± 0.05 × 10⁻³ mm2/s.
We assessed the potential of DWI for differentiating between unicystic ameloblastomas and KCOT with overlapped imaging findings on conventional MRI sequences. The ADC values of KCOT and unicystic ameloblastomas are shown in the box-and-whisker plot (Fig. 3). The ADC values of unicystic ameloblastomas were significantly higher than those of KCOT and dentigerous cysts (p < 0.001, Mann-Whitney U-test). When ADC values were used to differentiate the two groups, the area under the ROC curve was 1.0. The ROC curve analysis indicated an ADC value of 2.0 × 10⁻³ mm2/s as the optimal cut-off value to differentiate KCOT and unicystic ameloblastomas, with a sensitivity of 100% and a specificity of 100%. No significant difference was observed between the mean ADC values of KCOT and dentigerous cysts.
 | Fig. 3Box-and-whisker plot for comparing apparent diffusion coefficient values of unicystic ameloblastomas, KCOT and dentigerous cysts. p, Mann-Whitney U test.Bottom and top of each box and whisker plot are first and third quartiles, and band inside box is second quartile. Ends of whiskers represent minimum and maximum of all data. All data are included between whiskers. KCOT = keratocystic odontogenic tumors
|
Go to :
DISCUSSION
Our study demonstrated that unicystic ameloblastomas and keratocystic odontogenic tumors could be effectively differentiated on the basis of DWI and the ADC measurements.
Solid or multicystic ameloblastoma, which is the most common benign odontogenic tumor, accounts for approximately 11% of all tumors of the jaw (11). They usually appear as a multilocular lesion with mixed cystic and solid components and demonstrate enhancement of solid components, walls, and septa. However, unicystic ameloblastoma usually occurs in younger age groups, accounting for approximately 6−19% of all ameloblastomas (412). Sumi et al. (9) reported that the ADCs of the cystic components of ameloblastomas and keratocystic odontogenic tumors differed significantly, indicative of their different cystic components; however, their study did not include unicystic ameloblastomas. Our study focused on unicystic ameloblastomas with no solid components; herein, we showed that KCOT and unicystic ameloblastomas could be effectively differentiated based on ADC measurements.
Conventional MR imaging could also be useful, but provides limited information for distinguishing between odontogenic cysts and tumors (13). Konouchi et al. (14) showed that unicystic ameloblastomas produced relatively thick rim enhancement, with or without small intraluminal nodules on contrast-enhanced T1-weighted images; whereas, KCOT demonstrated a thin rim enhancement on contrast-enhanced T1-weighted images. In our study, unicystic ameloblastomas and KCOT showed no differences on contrast-enhanced T1-weighted images.
In addition, the cystic components of unicystic ameloblastomas showed free diffusion and high ADC values (2.309 ± 0.17 × 10⁻³ mm2/s), which could be attributed to the relatively less-viscous necrotic contents. Unicystic ameloblastomas usually contain slightly proteinaceous fluids, occasionally associated with colloidal materials. However, the odontogenic cysts, such as KCOT and dentigerous cysts, showed restricted diffusion and low ADC values (0.923 ± 0.20 × 10⁻³ mm2/s and 1.257 ± 0.05 × 10⁻³ mm2/s, respectively), which may be attributed to increased viscosity from contents, such as glycosaminoglycans, and particularly, hyaluronic acid (15). Desquamated keratin in KCOT further increases the viscosity of the contents. Our finding that the ADCs of unicystic ameloblastomas were significantly higher than those of KCOT indicated differences in tumor composition; further biochemical analyses of cystic fluid are required. A cut-off value of 2.0 × 10⁻³ mm2/s could differentiate KCOT and unicystic ameloblastomas with 100% sensitivity and 100% specificity. The findings are similar to the results of Srinivasan et al. (10) who found that KCOT and cystic/predominantly cystic ameloblastomas could be differentiated with 100% sensitivity and 100% specificity using a cut-off value of 2.013 × 10⁻³ mm2/s. Likewise, Sumi et al. (9) reported that a cut-off value of 2.0 × 10⁻³ mm2/s could be used to differentiate between nonenhancing lesions of ameloblastomas and KCOT with a 91.7% sensitivity and 100% specificity. The ADC values of the dentigerous cysts overlapped with those of the keratocystic odontogenic tumors; however, since the dentigerous cysts typically have an unerupted tooth incorporated into the cystic cavity, there might be little diagnostic difficulty in differentiating the dentigerous cysts from keratocytic odontogenic tumors.
Our study had several limitations. First, the sample size of our study was small; however, our results could be a basis for further and larger prospective studies to determine the role of DWI in distinguishing the types of jaw lesions. Second, we used only 3 b values in the ADC estimates. Because of the perfusion effect of small vessels, the number of b values examined may affect the results. Future work should therefore investigate DWI with multiple b values for the evaluation of the odontogenic cystic lesions (16). Third, we did not check the reproducibility of the findings; thus, further studies evaluating inter- and intra-observer reproducibility are required.
We demonstrated that the ADCs of cystic lesions in unicystic ameloblastomas were significantly higher than those of keratocystic odontogenic tumors. Thus, DWI can be added to the routine MRI protocol with only a small increase in the procedure-time. This will provide valuable information for differentiating between the two tumors and will help surgeons to plan the treatment strategy. In contrast, dentigerous cysts showed similar MR findings and ADC values to those of KCOT.
Go to :
 XML Download