

 PDF
PDF ePub
ePub Citation
 Print
Print


INTRODUCTION
MATERIALS AND METHODS
Study Population
US Examination and Image Analysis
US-Guided FNA and CNB Procedures
Data Analysis and Statistics
RESULTS
Demographic Data
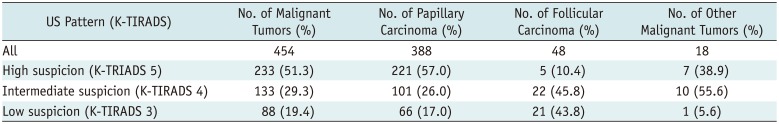
US Patterns of Malignant Tumors
Table 1
US Patterns of Malignant Tumors
![]()
Risk of Malignancy according to Nodule Size and US Pattern
Table 2
Risk of Malignancy and Distribution of Histologic Type according to Nodule Size and US Patterns
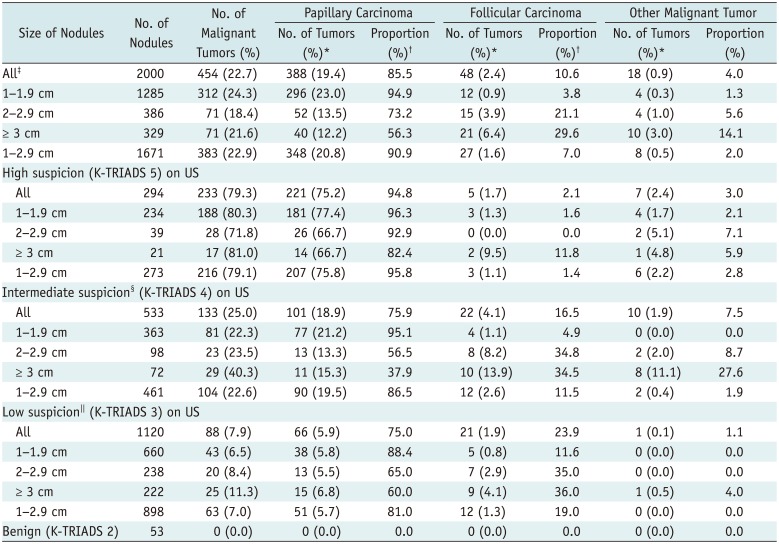
Numbers in parentheses are percentages. *Risk of each malignant tumor type in all nodules and at each nodule size category, †Proportion of each malignant tumor type among malignant tumors in all nodules and at each nodule size category, ‡p < 0.001 for trend toward decreasing risk of papillary carcinoma and increasing risk of follicular carcinoma and other malignant tumors with increasing nodule size. p < 0.001 for trend toward decreasing proportion of papillary carcinoma and increasing proportion of follicular carcinoma and other malignant tumors with increasing nodule size, §p = 0.004 for trend toward increasing overall malignancy risk as nodule size increases. p < 0.001 for trend of increasing risk of follicular thyroid cancer or other malignant tumors with increasing nodule size. p < 0.001 for trend toward decreasing proportion of papillary carcinoma and increasing proportion of follicular carcinoma and other malignant tumors with increasing nodule size, ∥p = 0.022 for trend toward increasing overall malignancy risk with increasing nodule size. p < 0.001 for trend of increasing risk of follicular thyroid cancer with increasing nodule size. p = 0.007 for trend toward decreasing proportion of papillary carcinoma. p = 0.016 for trend toward increasing proportion of follicular carcinoma with increasing nodule size.
![]()
Malignancy Risk of Each Histologic Type according to Nodule Size and US Pattern
Distribution of Tumor Types according to Tumor Size and US Pattern in Malignant Tumors
DISCUSSION
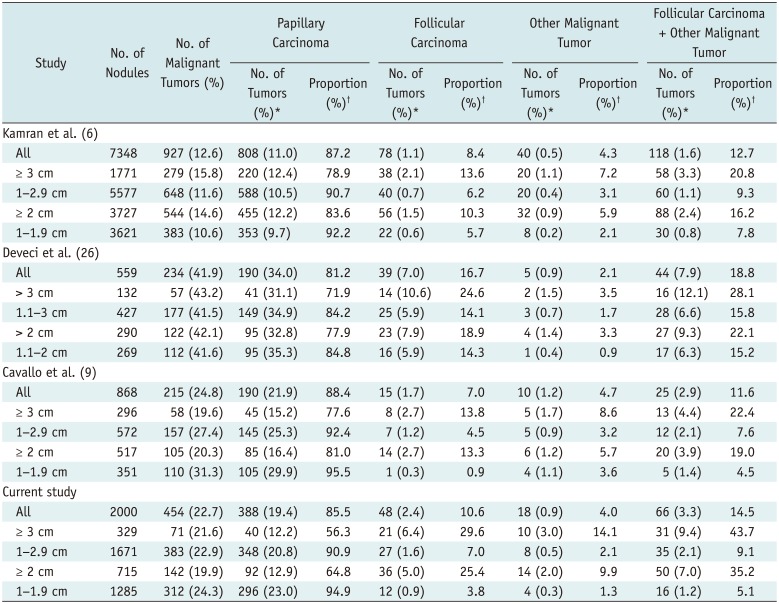
Table 3
Comparison of Risk and Proportion of Histologic Type of Malignancy according to Nodule Size
| Study | No. of Nodules | No. of Malignant Tumors (%) | Papillary Carcinoma | Follicular Carcinoma | Other Malignant Tumor | Follicular Carcinoma + Other Malignant Tumor | ||||
|---|---|---|---|---|---|---|---|---|---|---|
| No. of Tumors (%)* | Proportion (%)† | No. of Tumors (%)* | Proportion (%)† | No. of Tumors (%)* | Proportion (%)† | No. of Tumors (%)* | Proportion (%)† | |||
| Kamran et al. (6) | ||||||||||
| All | 7348 | 927 (12.6) | 808 (11.0) | 87.2 | 78 (1.1) | 8.4 | 40 (0.5) | 4.3 | 118 (1.6) | 12.7 |
| ≥ 3 cm | 1771 | 279 (15.8) | 220 (12.4) | 78.9 | 38 (2.1) | 13.6 | 20 (1.1) | 7.2 | 58 (3.3) | 20.8 |
| 1–2.9 cm | 5577 | 648 (11.6) | 588 (10.5) | 90.7 | 40 (0.7) | 6.2 | 20 (0.4) | 3.1 | 60 (1.1) | 9.3 |
| ≥ 2 cm | 3727 | 544 (14.6) | 455 (12.2) | 83.6 | 56 (1.5) | 10.3 | 32 (0.9) | 5.9 | 88 (2.4) | 16.2 |
| 1–1.9 cm | 3621 | 383 (10.6) | 353 (9.7) | 92.2 | 22 (0.6) | 5.7 | 8 (0.2) | 2.1 | 30 (0.8) | 7.8 |
| Deveci et al. (26) | ||||||||||
| All | 559 | 234 (41.9) | 190 (34.0) | 81.2 | 39 (7.0) | 16.7 | 5 (0.9) | 2.1 | 44 (7.9) | 18.8 |
| > 3 cm | 132 | 57 (43.2) | 41 (31.1) | 71.9 | 14 (10.6) | 24.6 | 2 (1.5) | 3.5 | 16 (12.1) | 28.1 |
| 1.1–3 cm | 427 | 177 (41.5) | 149 (34.9) | 84.2 | 25 (5.9) | 14.1 | 3 (0.7) | 1.7 | 28 (6.6) | 15.8 |
| > 2 cm | 290 | 122 (42.1) | 95 (32.8) | 77.9 | 23 (7.9) | 18.9 | 4 (1.4) | 3.3 | 27 (9.3) | 22.1 |
| 1.1–2 cm | 269 | 112 (41.6) | 95 (35.3) | 84.8 | 16 (5.9) | 14.3 | 1 (0.4) | 0.9 | 17 (6.3) | 15.2 |
| Cavallo et al. (9) | ||||||||||
| All | 868 | 215 (24.8) | 190 (21.9) | 88.4 | 15 (1.7) | 7.0 | 10 (1.2) | 4.7 | 25 (2.9) | 11.6 |
| ≥ 3 cm | 296 | 58 (19.6) | 45 (15.2) | 77.6 | 8 (2.7) | 13.8 | 5 (1.7) | 8.6 | 13 (4.4) | 22.4 |
| 1–2.9 cm | 572 | 157 (27.4) | 145 (25.3) | 92.4 | 7 (1.2) | 4.5 | 5 (0.9) | 3.2 | 12 (2.1) | 7.6 |
| ≥ 2 cm | 517 | 105 (20.3) | 85 (16.4) | 81.0 | 14 (2.7) | 13.3 | 6 (1.2) | 5.7 | 20 (3.9) | 19.0 |
| 1–1.9 cm | 351 | 110 (31.3) | 105 (29.9) | 95.5 | 1 (0.3) | 0.9 | 4 (1.1) | 3.6 | 5 (1.4) | 4.5 |
| Current study | ||||||||||
| All | 2000 | 454 (22.7) | 388 (19.4) | 85.5 | 48 (2.4) | 10.6 | 18 (0.9) | 4.0 | 66 (3.3) | 14.5 |
| ≥ 3 cm | 329 | 71 (21.6) | 40 (12.2) | 56.3 | 21 (6.4) | 29.6 | 10 (3.0) | 14.1 | 31 (9.4) | 43.7 |
| 1–2.9 cm | 1671 | 383 (22.9) | 348 (20.8) | 90.9 | 27 (1.6) | 7.0 | 8 (0.5) | 2.1 | 35 (2.1) | 9.1 |
| ≥ 2 cm | 715 | 142 (19.9) | 92 (12.9) | 64.8 | 36 (5.0) | 25.4 | 14 (2.0) | 9.9 | 50 (7.0) | 35.2 |
| 1–1.9 cm | 1285 | 312 (24.3) | 296 (23.0) | 94.9 | 12 (0.9) | 3.8 | 4 (0.3) | 1.3 | 16 (1.2) | 5.1 |
![]()
 XML Download