

 PDF
PDF ePub
ePub Citation
 Print
Print


INTRODUCTION
It is crucial to classify pulmonary nodules accurately and reliably to ensure that appropriate clinical decisions are made both in routine practice and in the screening setting. For incidentally detected nodules, different guideline algorithms are being applied for solid and subsolid nodules according to the Fleischner Society guideline (1). For nodules detected on lung cancer screening, Lung CT Screening Reporting and Data System indicates varying patient management according to the classification of pulmonary nodules into solid, part-solid and non-solid lownodules on low-dose CT (2).
Since the National Lung Screening Trial reported a 20% reduction in lung cancer mortality among high-risk populations, low-dose chest CT has received increased attention and has been in widespread use for routine practice as well as lung cancer screening (3). However, there is a growing concern because a fair amount of inter- and intra-observer variability exists in nodule classification on low-dose CT, which may lead to different patient management (45). Preceding research has reported comparable accuracy between low-dose and standard-dose chest CT for nodule detection and size measurement (6789). However, it is unclear whether nodule classification on low-dose CT can be made reliably as that on standard-dose chest CT. To our knowledge, little data is available for inter-protocol agreement, which is an agreement between low-dose unenhanced and standard-dose enhanced CT for nodule classification into solid and subsolid nodules.
Diagnostic tests are typically assessed by measuring their accuracy through comparison with a reference standard (10). However, it is impossible to establish a valid reference standard in pulmonary nodule classification on CT, as the classification depends on each reader's subjective visual assessment (4511). With a method suggested by Obuchowski, the interchangeability of low-dose unenhanced CT with standard-dose enhanced CT can be investigated by comparing agreement in classifications between the two CT protocols to the agreement between readers with standard-dose enhanced CT (1012). Accordingly, we aimed to measure inter-protocol agreement and analyze interchangeability on nodule classification between low-dose (0.5-mSv) unenhanced CT and standard-dose (4.5-mSv) enhanced CT.
MATERIALS AND METHODS
This retrospective study was approved by our Institutional Review Board (B-1604/343-116), and the need for informed consent was waived.
Nodule Selection
Solid and subsolid nodule libraries containing both lowdose unenhanced and standard-dose enhanced CT images were established using the electronic radiology database of our institution by a single chest radiologist. Long and short diameters of the nodules were measured using an electronic caliper on axial images, and the locations of the nodules were recorded as upper, middle, or lower, by dividing the lungs into three areas (13).
To identify eligible solid and subsolid nodules for the nodule libraries, different search terms and periods were used to adjust for the difference in the prevalence of solid and subsolid nodules. In our institution, low-dose unenhanced chest CT has been included in the contrast-enhanced chest CT protocol since 2008 in order to obtain information on the degree of contrast enhancement and the presence of calcification, which provides essential data needed to differentiate between benign and malignant lesions, particularly in tuberculosis-endemic countries (714). Patients underwent contrast-enhanced chest CT protocol for various reasons, including clinical symptoms, chest radiography abnormality, or staging purposes.
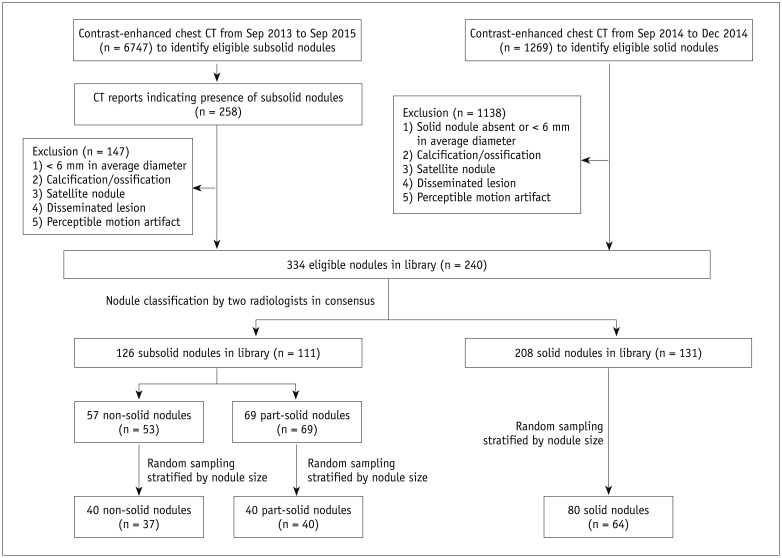
To identify eligible CT images of solid nodules, 1269 consecutive contrast-enhanced CT images obtained over 4 months were reviewed. To identify eligible CT images of subsolid nodules, 6747 consecutive contrast-enhanced CT reports over 2 years were searched to identify CT reports which contained terms indicating subsolid nodules. The solid and subsolid nodules that met the following inclusion criteria were identified: average diameter ≥ 6 mm; no calcification or ossification; no satellite nodule; no disseminated lesion; and no perceptible motion artifact. The nodules with satellite lesions were excluded because they are much more common in solid nodules (i.e., pulmonary tuberculosis). These selected nodules were reviewed together by two chest radiologists (with 4 and 14 years of experience, respectively) to classify the nodules in consensus. Finally, a solid nodule library comprising 208 nodules and a subsolid nodule library comprising 126 nodules were established. Among these, 80 solid nodules and 80 subsolid nodules (including 40 part-solid and 40 non-solid nodules) of 135 patients were selected for the study via random sampling, and stratified by nodule size (Fig. 1). There were 72 male patients (mean age, 65.1 years ± 11.9; age range, 27–86 years) and 63 female patients (mean age, 67.3 years ± 11.9; age range, 44–91 years). The median body weight and body mass index of our study patients were 56 kg (interquartile range [IQR], 50.3–65.5 kg) and 22.5 kg/m2 (IQR, 20.4–24.6 kg/m2), respectively.
CT Image Acquisition
All CT images were obtained using 256-slice multidetector row scanners (iCT; Philips Medical Systems, Cleveland, OH, USA). The target radiation doses for the low-dose unenhanced and standard-dose enhanced images were 0.5 mSv and 4.5 mSv, respectively.
Low-dose unenhanced CT was performed at a tube potential of 120 kVp with automatic exposure control (DoseRight index 4 [average mAs of 21]), beam collimation of 128 × 0.625 mm, pitch of 0.984, and gantry rotation time of 0.5 seconds before the intravenous injection of contrast material. Contrast agent (80 mL; iomeprol, Iomeron 350; Bracco, Buckinghamshire, UK) was injected intravenously at a rate of 2–3 mL/s via automatic power injection. The subsequent standard-dose enhanced chest CT was acquired 30 seconds after achieving a threshold of 200 Hounsfield unit (HU) in the ascending aorta via the bolus-tracking technique. All the parameters remained unchanged, except the setting of automatic exposure control (DoseRight index 18 [average mAs of 101]). Images were reconstructed using a filtered back projection algorithm with a sharp convolution kernel (YA), with 1 mm section thickness and 1 mm interval. Radiation doses were estimated by using volumetric CT dose index (CTDIvol), size-specific dose estimates (SSDEs), and effective dose. SSDEs were calculated using the method described in the American Association of Physicists in Medicine task group report 204 (15), based on the effective diameter of each patient at the level of the tracheal bifurcation (16). We estimated the effective dose by using a conversion factor of 0.014 mSv/mGy·cm, as reported in Report 96 of the American Association of Physicists in Medicine (17).
Image Analysis
Five chest radiologists from four different institutions (with 20, 16, 8, 6, and 2 years of experience, respectively) participated in nodule classification. All axial CT images that contained nodules were provided along with the lung window settings (level, −600 HU; width, 1500 HU). The readers were instructed to categorize each nodule into solid or subsolid, and to further subcategorize the subsolid nodules into part-solid or non-solid. Classification was based on the definition by the Fleischner Society (1819) and no further discussion was made to refine these definitions. The readers were blinded to the original classification in the CT reports, the number of nodules in each category, and the findings of the other radiologists. If needed, the readers were allowed to adjust the window settings and magnification.
Each reader reviewed the CT scans of each nodule twice, once with low-dose unenhanced CT and once with standard-dose enhanced chest CT during two reading sessions: each session included 80 low-dose unenhanced and 80 standard-dose enhanced images, randomly mixed, and repetition of any nodule in a single session was avoided. The maximal number of review cases was limited to 40 per day. There was at least a 6-week time interval between the first and second sessions to reduce the potential for recall bias.
Statistical Analysis
Inter-protocol and inter-reader agreement were measured for nodule classification into two (solid versus subsolid) and three (solid, part-solid, versus non-solid) categories. Inter-protocol agreement was calculated by pooling each reader's agreement between low-dose unenhanced CT and standard-dose enhanced CT, using the proportion of agreement and Cohen's kappa (κ) statistics (20). Inter-reader agreement on low-dose unenhanced and on standard-dose enhanced images was calculated using the proportion of agreement and Fleiss' kappa (21). Subgroup analysis was performed by dividing the nodules into three subgroups according to size and location, with logistic regression using the generalized estimating equation method.
The interchangeability between low-dose unenhanced and standard-dose enhanced CT images for classification into solid and subsolid nodules was tested using the method of Obuchowski (1012). The equivalence limit was pre-defined as 8%, which was the median value of the intra-reader disagreement among experienced thoracic radiologists for nodule classification in a previous study (11). The individual equivalence index (IEC) was calculated by subtracting “the probability of agreement between the low-dose unenhanced and standard-dose enhanced CT” from “the probability of agreement between the readers with standard-dose chest CT.” If the upper bound of the 95% confidence interval (CI) of the IEC was less than or equal to the equivalence limit, low-dose unenhanced chest CT would be considered to be interchangeable to standard-dose enhanced chest CT. To consider the clustered nature of the data, the 95% CI for the IEC was constructed using 10000 bootstrap samples from nodule-level data (1012).
All statistical analyses were performed using commercially available software (SAS version 9.4, SAS Institute Inc., Cary, NC, USA; R version 3.3.2, R Foundation for Statistical Computing, Vienna, Austria).
RESULTS
Nodule Characteristics and Radiation Doses
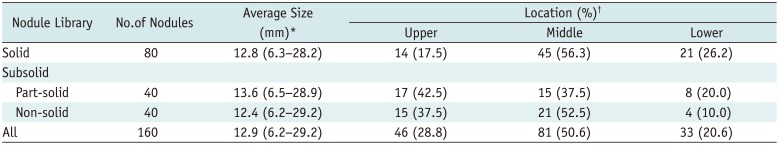
The 160 nodules included in our study had an average size of 12.9 mm along the long diameter (range, 6.2–29.2 mm), and were located in the upper (28.8%), middle (50.6%), and lower (20.6%) lungs. The sizes and locations of 80 solid, 40 part-solid, and 40 non-solid nodules are summarized in Table 1. The average size of the solid components in part-solid nodules was 7.3 mm (range, 2.1–17.0 mm).
In this study, the median CTDIvol and SSDEs were 1.32 mGy (IQR, 1.17–1.47 mGy) and 1.7 mGy (IQR, 1.6–1.8 mGy) for low-dose unenhanced CT, and were 7.30 mGy (IQR, 6.50–8.06 mGy) and 9.55 mGy (IQR, 8.83–10.19 mGy) for standard-dose enhanced CT, respectively. The median effective radiation dose was 0.57 mSv (IQR, 0.47–0.65 mSv) for low-dose unenhanced CT and 4.73 mSv (IQR, 3.97–5.35 mSv) for standard-dose enhanced CT.
Inter-Protocol Agreement
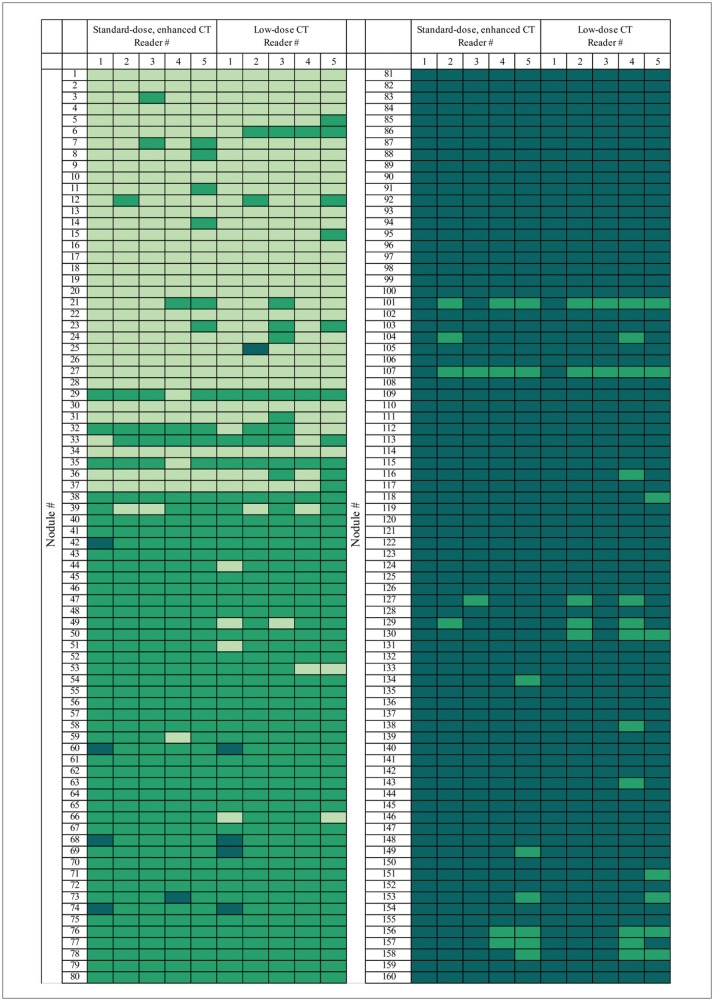
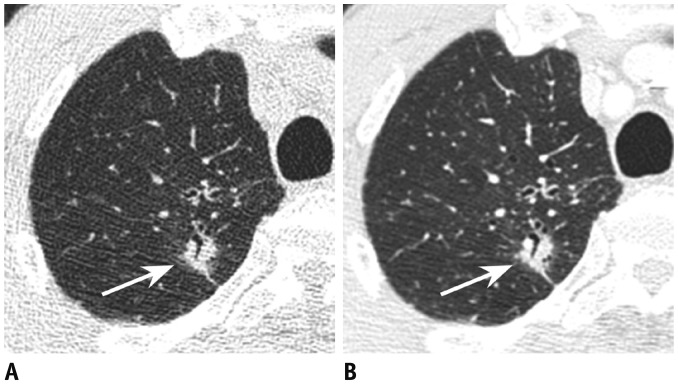
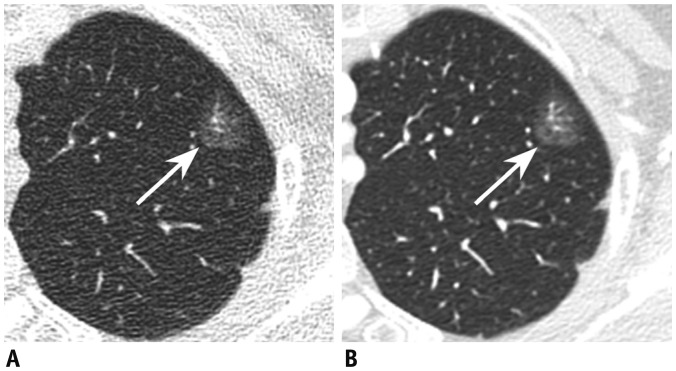
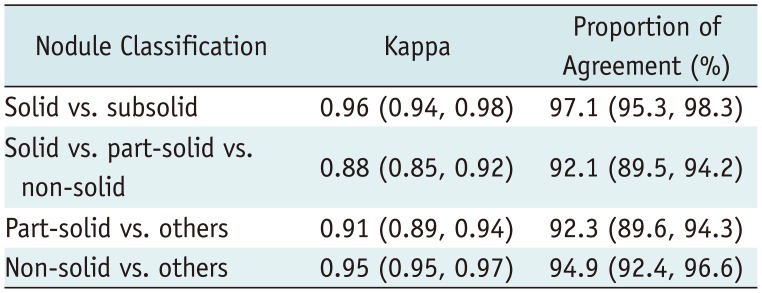
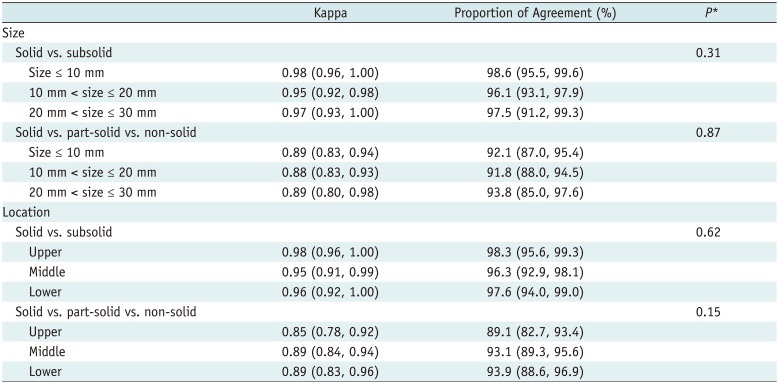
To provide a visual representation of the five readers' responses, a heat map was constructed (Fig. 2) (22). Representative examples of nodule classification are shown in Figures 3 and 4. Inter-protocol agreement for the classification between solid and subsolid nodules (κ, 0.96 [95% CI, 0.94–0.98]) and that for the classification between solid, part-solid, and non-solid nodules (κ, 0.88 [95% CI, 0.85–0.92]) was considerably high. Inter-protocol agreement in classification between part-solid versus others and non-solid versus others is also shown in Table 2. Inter-protocol agreement was not associated with the size or location of the nodules (p > 0.05) (Table 3).
Inter-Reader Agreement
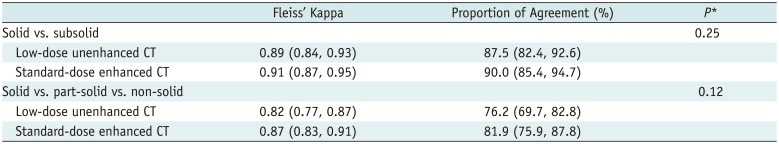
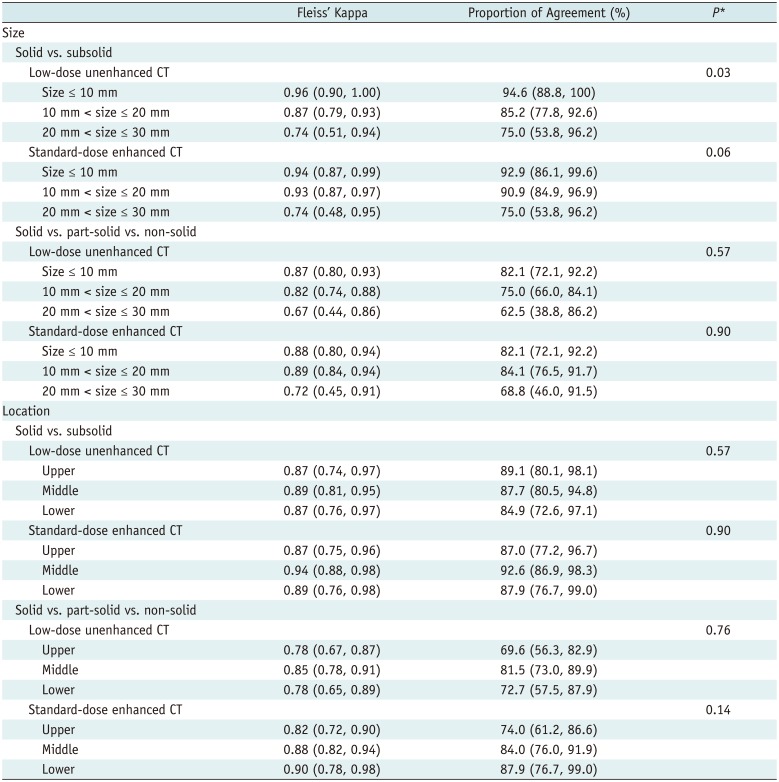
Inter-reader agreement for the classification of solid and subsolid nodules on low-dose unenhanced (κ, 0.89 [95% CI, 0.84–0.93]) and standard-dose enhanced images (κ, 0.91 [95% CI, 0.87–0.95]) was considerably high (Table 4). Agreement for the classification of solid, part-solid, and non-solid nodules on low-dose unenhanced (κ, 0.82 [95% CI, 0.77–0.87]) and standard-dose enhanced images (κ, 0.87 [95% CI, 0.83–0.91]) was also markedly high. There was no significant difference in inter-reader agreement between low-dose unenhanced and standard-dose enhanced images.
Inter-reader agreement was not associated with nodule size or location (Table 5), with the exception of the inter-reader agreement for classification between solid and subsolid nodules, which tended to decrease slightly in larger-sized nodules on low-dose unenhanced CT images (p = 0.03) and standard-dose enhanced CT (p = 0.06). In nodules larger than 20 mm, the Fleiss' kappa values for the classification between solid and subsolid nodules were 0.74 (95% CI, 0.51–0.94) and 0.74 (95% CI, 0.48–0.95) on low-dose unenhanced CT and standard-dose enhanced CT, respectively.
Interchangeability Test
The probability of agreement between readers on standard-dose enhanced CT was 95.6% (95% CI, 94.5–96.6%), and the probability of agreement between the low-dose unenhanced and standard-dose enhanced CT was 95.4% (95% CI, 94.7–96.0%). The difference between the two proportions, the IEC, was 0.25% (95% CI, −0.85–1.5%). As the upper bound of CI of the IEC was markedly below the pre-defined equivalence limit of 8%, the interchangeability between low-dose unenhanced and standard-dose enhanced CT was accepted.
DISCUSSION
There has been a marked increase in the use of low-dose CT for lung cancer screening and routine practice. To determine whether nodule classification on low-dose unenhanced CT can be made reliably as that on standard-dose enhanced chest CT, we investigated inter-protocol agreement for nodule classification and analyzed interchangeability between low-dose unenhanced CT and standard-dose enhanced CT. Our findings strongly suggest that low-dose unenhanced CT (0.5-mSv) can be used interchangeably with standard-dose enhanced CT (4.5-mSv) in patient management based on classification between solid and subsolid nodules. Switching between low-dose unenhanced and standard-dose enhanced CT only leads to a negligible change in agreement regarding nodule classification (within the range of a 0.85% decrease and 1.5% increase), from that using standard-dose enhanced CT alone.
The agreement for nodule classification in the present study tended to be higher than those reported in previous studies, wherein the inter-reader agreement (κ) was 0.51–0.81 and intra-reader agreement (κ) was 0.57–0.79 (4511). This discrepancy could be explained by several differences among the studies. First, the proportions of solid and subsolid nodules were different. The proportion of subsolid nodules was higher in the previous studies (67% in the study by Jacobs et al. (4) and 75% in the study by van Riel et al. (5) than that in our study (50%). Since disagreement on the size and presence of a solid component in subsolid nodules was the main cause of discrepancies in nodule classification (5), higher proportions of subsolid nodules in the previous studies might have resulted in lower levels of agreement (45). In the study by Ridge et al. (11), the proportion of subsolid nodules was the same as in our study. However, one single CT image was provided per nodule, which may have decreased diagnostic performance in their study. In our study, all involved CT sections containing nodules were provided to reflect the clinical practice. Second, the study by van Riel et al. (5) classified nodules into four categories. In the present study, we did not incorporate the subcategories based on size measurement, as each guideline (2192324) applies different size criteria for the subcategories. Third, the nodules characteristics, such as the margin and attenuation, may be different because the nodules in our study were detected in clinical studies while the nodules in previous studies (45) were detected in screening studies. Fourth, chest radiologists in the present study might have been more familiar with differentiating between solid and subsolid nodules, since subsolid nodules are more frequently found in Asian patients (25). Indeed, Lee et al. (26) reported high inter-reader agreement (κ, 0.86) for classification of part-solid and non-solid nodules, consistent with the present study. Finally, because there was no exclusion criterion for CT images with motion artifact, there is a possibility that some CT images with motion artifact were included in previous studies (45), which may have decreased the degree of agreement.
In the present study, we examined the interchangeability between low-dose unenhanced and standard-dose enhanced CT for nodule classification into the two categories of solid and subsolid. Although the interchangeability test was not performed for the classification of nodules into the three categories of solid, part-solid and non-solid, nodule classification on low-dose unenhanced CT into the three categories indicated considerable agreement with that on standard-dose enhanced CT, as well as with the classification into the two categories.
The classification of pulmonary nodules depends on visual assessment, which may be affected by the nodule characteristics and lung lesion conspicuity (27). In the subgroup analysis, inter-reader agreement for the classification between solid and subsolid nodules tended to decrease slightly in nodules with larger sizes. When a minimal degree of ground-glass opacities was found to be surrounding the nodules, the classification of these nodules as solid or subsolid varied among readers, particularly for nodules > 20 mm. Iterative reconstruction is one of the important factors influencing lesion conspicuity. Without the aid of iterative reconstruction, our results showed that low-dose unenhanced chest CT with filtered back projection algorithms was sufficiently interchangeable for nodule classification with standard-dose enhanced CT. Even though the effect of iterative reconstruction on nodule classification may not be substantial, it may be useful in improving image quality and enhancing nodule detection as demonstrated by previous studies (2829).
The present study had certain limitations which should be discussed. First, the natural prevalence of solid and subsolid nodules in actual clinical practice may differ from that in the present study. In this study, the ratio of solid to subsolid nodules was selected as 1:1, since the equivalence limit was determined based on the results from a previous study (11) wherein the prevalence of both solid and subsolid nodules was 50%. Second, our study was potentially susceptible to recall bias. To minimize this risk, we maintained at least a 6-week time interval between the first and second reading sessions. Third, the effect of contrast enhancement and radiation dose on nodule classification has not been analyzed separately. However, standard-dose enhanced chest CT was selected as a reference test in our study because it is one of the most commonly used CT protocols in clinical practice for various indications. Fourth, the effect of iterative reconstruction on nodule classification was not evaluated in this study. Fifth, since we primarily focused on interchangeability between low-dose unenhanced and standard-dose enhanced CT for nodule classification, the interchangeability of two protocols for patient management according to the Fleischner guidelines should be evaluated in future studies. Finally, a sample size calculation was not performed in the present study due to the lack of methods available which would allow us to appropriately determine the sample size for an interchangeability test (10). Hence, the sample size in this study was determined empirically, based on the previous related studies (511). Nevertheless, the narrow CIs of the estimated individual equivalence indicate that the interchangeability between low-dose unenhanced CT and standard-dose enhanced CT for nodule classification can be robustly accepted.
In conclusion, inter-protocol agreement for nodule classification was considerably high. Low-dose unenhanced CT can be used interchangeably with standard-dose enhanced CT for nodule classification.
 XML Download