Abstract
Objective
To determine if measurement of the diameter of the solid component in subsolid nodules (SSNs) on low-dose unenhanced chest computed tomography (CT) is as accurate as on standard-dose enhanced CT in prediction of pathological size of invasive component of lung adenocarcinoma.
Materials and Methods
From February 2012 to October 2015, 114 SSNs were identified in 105 patients that underwent low-dose unenhanced and standard-dose enhanced CT pre-operatively. Three radiologists independently measured the largest diameter of the solid component. Intraclass correlation coefficients (ICCs) were used to assess inter-reader agreement. We estimated measurement differences between the size of solid component and that of invasive component. We measured diagnostic accuracy of the prediction of invasive adenocarcinoma using a size criterion of a solid component ≥ 6 mm, and compared them using a generalized linear mixed model.
Results
Inter-reader agreement was excellent (ICC, 0.84.0.89). The mean ± standard deviation of absolute measurement differences between the solid component and invasive component was 4 ± 4 mm in low-dose unenhanced CT and 5 ± 4 mm in standard-dose enhanced CT. Diagnostic accuracy was 81.3% (95% confidence interval, 76.7.85.3%) in low-dose unenhanced CT and 76.6% (71.8.81.0%) in standard-dose enhanced CT, with no statistically significant difference (p = 0.130).
In the evaluation of subsolid nodules (SSNs) on computed tomography (CT), size measurement of the solid component is critical, as it represents the pathologically invasive component of lung adenocarcinoma, and reflects the patient's prognosis (12345). Among several diagnostic criteria, a size criterion of a solid component diameter ≥ 6 mm is commonly used for differentiating between invasive adenocarcinomas and minimally or preinvasive adenocarcinomas on CT (467891011). A SSN with a solid component ≥ 6 mm in size is highly suspicious according to the Fleischner Society guidelines, due to the high probability of invasive adenocarcinoma (12). In contrast, for a SSN with a solid component < 6 mm, yearly surveillance CT is recommended as it is highly likely to be minimally invasive or pre-invasive adenocarcinoma (12).
Recently, the role of low-dose chest CT in managing patients with SSNs has become increasingly crucial, with implementation of lung cancer CT screening (131415). The Lung CT Screening Reporting and Data System (Lung-RADS) suggests a different patient management guideline based on classification and size measurement of SSNs on low-dose chest CT (16). Low-dose chest CT is used for determination of initial patient management as well as for follow-up of incidentally detected SSNs to evaluate their persistence and size according to the Fleischner Society guidelines (12). Radiation dose reduction using low-dose chest CT is necessary for patients with SSNs, because they may undergo repeated CT scans to assess interval growth of nodules and their solid components. However, despite increased use of low-dose chest CT for assessing SSNs instead of standard-dose CT, it is yet to be determined if measurement of the solid component on low-dose chest CT predicts size of the pathologically invasive component as reliably as standard-dose contrast-enhanced CT.
Hence, the purpose of this study was to determine if measurement of the diameter of the solid component in SSNs on low-dose unenhanced chest CT is as accurate as on standard-dose enhanced CT in prediction of pathological size of invasive component of lung adenocarcinoma.
This retrospective study was approved by the Institutional Review Board of Seoul National University Bundang Hospital (a tertiary referral center), which waived the requirement for informed consent (B-1610-367-103).
We searched medical records of our institution from February 2012 to October 2015, as storage of thin-section imaging data began since February 2012. Our search identified 882 patients that had undergone surgery for lung adenocarcinoma, and 273 of them had tumors manifesting as SSNs. Among them, 105 patients (46 men, mean age: 65.9 years, age range: 44–83 years; 59 women, mean age: 63.7 years, age range: 39–82 years) that underwent preoperative contrast-enhanced chest CT consisting of 2
For patients with multiple SSNs, only nodules with pathological confirmation were eligible. Eligible nodules were identified by a second-year radiology resident after reviewing surgical records and CT images, and were confirmed by a chest radiologist with 20 years of experience. Mean time ± standard deviation between CT examination and surgery was 17.3 ± 13.1 days. Surgical procedures included 66 lobectomies, 37 sublobar resections, and 4 combinations of lobectomy and sublobar resection in different lobes. A total of 98 patients had single SSNs, while 5 patients had 2 SSNs, and 2 patients had 3 SSNs, resulting in a total of 114 SSNs for analysis.
CT images were obtained using 64- and 256-slice multidetector CT scanners (Brilliance 64 and iCT; Philips Medical Systems, Cleveland, OH, USA). Protocol consisted of 2 phases: 1) a low-dose unenhanced CT, with tube voltage of 120 kVp and automatic exposure control (DoseRight index 4 [average mAs of 21]) and 2) a standard-dose enhanced CT, with tube voltage of 120 kVp and automatic exposure control (DoseRight index 18 [average mAs of 101]). Contrast-enhanced phase was obtained by infusion of 80 mL of non-ionic contrast medium at a rate of 2 mL/s, followed by infusion of 20 mL of normal saline at the same rate. Trigger point was defined as the time when the attenuation coefficient within ascending aorta exceeded 150 Hounsfield unit (HU). Data acquisition was set to begin 28 seconds after the trigger point. All CT scans were conducted with a pitch of 0.984 and gantry rotation time of 0.5 seconds. All CT images were reconstructed using a filtered backprojection algorithm with a sharp convolution kernel (YA).
Radiation dose estimate was calculated with volumetric CT dose index (CTDIvol), size-specific dose estimate (SSDE), and effective dose. SSDE was calculated using the method described in the American Association of Physicists in Medicine task group report 204 (17), based on effective diameter of each patient at the level of tracheal bifurcation (18). We estimated effective dose by using a conversion factor of 0.014 mSv/mGy·cm, as reported in Report 96 of the American Association of Physicists in Medicine (19).
All CT slices containing each nodule were reconstructed in the axial plane by a resident, with a slice thickness ≤ 2 mm and an interval of 1 mm. Low-dose unenhanced and standard-dose enhanced images were reconstructed with the same slice thickness; 1 mm in 16 patients and 2 mm in 89 patients.
Independent measurements were conducted by 3 chest radiologists (Reader 1, 2, and 3 with 5, 2, and 2 years of experience after board certification, respectively). Readers measured the largest diameters of the whole nodule and solid component on representative images in which each component exhibited the largest diameter, respectively, in the axial plane with lung-window settings (center of −600 HU and width of 1500 HU). When a nodule contained multiple solid components, readers measured the size of the single largest solid component. Measurements were obtained using an electronic caliper on a PACS workstation (Infinitt PACS; Infinitt Healthcare, Seoul, Korea), and results were rounded off to the nearest millimeter.
Each reader reviewed the CT scans of each nodule twice, once with low-dose unenhanced CT and once with standard-dose enhanced chest CT, during 2 reading sessions: each session included randomly mixed low-dose unenhanced and standard-dose enhanced images, and repetition of any nodule in a same session was avoided. There was at least a 4-week time-interval between the first and second session to reduce the potential for recall bias. Readers were blinded to radiology and pathology reports, and the reading order was randomized for each reader and session.
After they had been inflated and fixed using 10% buffered formalin, resected specimens were continuously cut at 3-mm interval along the longest tumor dimension, embedded in paraffin, and stained with hematoxylin and eosin. All sections containing the tumor were microscopically examined. Diagnoses were based on the 2015 WHO classification criteria (20). Three-dimensional sizes of the whole tumor as well as the invasive components were recorded as a part of routine clinical practice by a pulmonary pathologist with 19 years of experience.
Intraclass correlation coefficients (ICCs) were used to assess inter-reader agreement as well as correlation between CT and pathological measurements. The largest diameter of the whole nodule on CT was compared with that of the whole tumor on pathology. The largest diameter of the solid component on CT was compared with that of the invasive component on pathology. Correlation was interpreted as follows: ICC 0–0.20, poor; ICC 0.21–0.40, fair; ICC 0.41–0.60, moderate; ICC 0.61–0.80, good; and ICC 0.81–1.00, excellent.
Mean ± standard deviation of absolute and relative differences between the CT and pathological measurement on low-dose unenhanced and standard-dose enhanced CT scans were calculated. In addition, measurement differences were calculated by dividing nodules into the two subgroups: nodules with a solid component ≤ 8 mm and nodules with a solid component > 8 mm (21). Diagnostic accuracy, sensitivity, and specificity of low-dose unenhanced and standard-dose enhanced CT in prediction of invasive adenocarcinomas using size criterion of solid component ≥ 6 mm were calculated respectively, and compared using a generalized linear mixed model considering the clustered nature of data. Slice thickness entered this model as a covariate.
Data were analyzed using SPSS 20.0 (IBM Corp., Armonk, NY, USA) and MedCalc 14.8.1 (MedCalc Software, Mariakerke, Belgium). A difference with a p value of less than 0.05 was statistically significant.
The average size of the whole nodule was 20 mm in the long diameter (range, 7–39 mm) and that of the solid component was 10 mm (range, 0–27 mm). They were located as follows: 41 in the right upper lobe (36.0%), 12 in the right middle lobe (10.5%), 19 in the right lower lobe (16.7%), 20 in the left upper lobe (17.5%), and 22 (19.3%) in the left lower lobe. Pathologically, 89 of 114 SSNs were invasive adenocarcinomas, 17 were minimally invasive adenocarcinomas, and 8 were preinvasive lesions (4 adenocarcinomas in situ and 4 atypical adenomatous hyperplasias).
Median CTDIvol and SSDEs were 1.34 mGy (interquartile range [IQR], 1.11–1.58 mGy) and 1.66 mGy (IQR, 1.51–1.90 mGy) in low-dose unenhanced CT, and 7.55 mGy (IQR, 6.32–9.12 mGy) and 9.27 mGy (IQR, 8.39–11.03 mGy) in standard-dose enhanced CT, respectively. Median effective radiation doses were 0.59 mSv (IQR, 0.50–0.72 mSV) in low-dose unenhanced CT and 4.55 mSv (IQR, 3.85–5.50 mSv) in standard-dose enhanced CT.
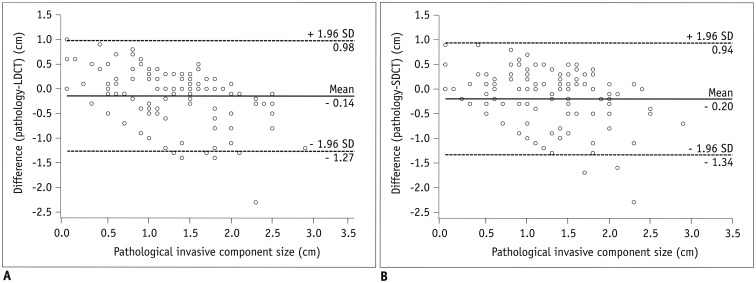
Inter-reader agreement was excellent for size measurement of the whole nodule (ICC range: 0.90–0.91) and the solid component (ICC range: 0.84–0.89), in lowdose unenhanced and standard-dose enhanced CT scans (Table 1). Bland-Altman plots with 95% confidence intervals (CIs) of the difference between the size of the pathologically invasive component and the diameter of the solid component on CT are shown in Figure 1.
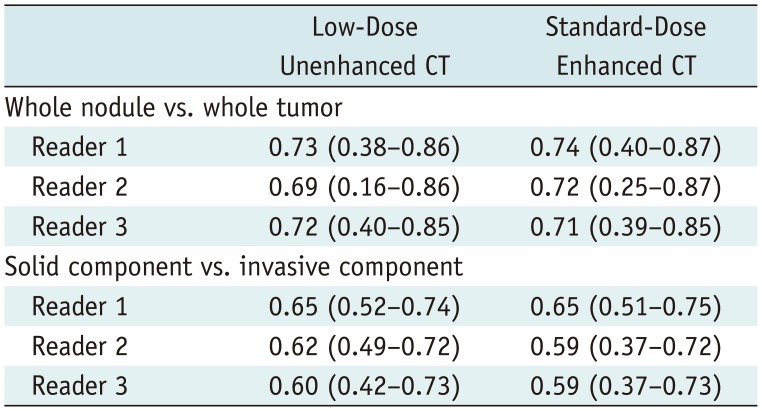
Correlation between CT measurement of the whole nodule and the pathological measurement of the whole tumor was good in low-dose unenhanced CT (ICC range, 0.69–0.73) and standard-dose enhanced CT (ICC range, 0.71–0.74). Correlation between CT measurement of the solid component and pathological measurement of the invasive component was good in low-dose unenhanced CT (ICC range, 0.60–0.65), and fair-to-good in standard-dose enhanced CT (ICC range, 0.59–0.65) (Table 2). Representative images of CT and pathological measurements are shown in Figure 2.
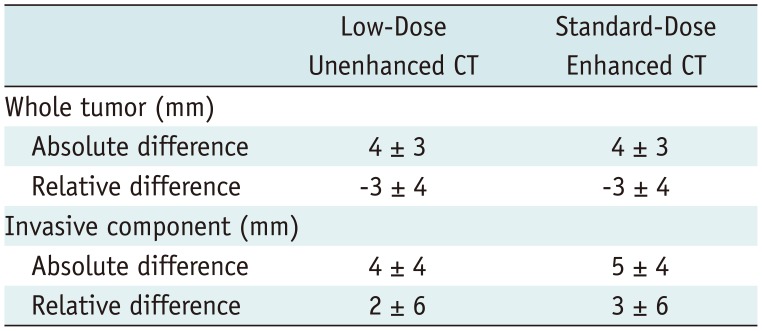
Mean ± standard deviation of absolute differences between the CT and pathologic measurement of the whole tumor was 4 ± 3 mm in low-dose unenhanced CT and 4 ± 3 mm in standard-dose enhanced CT. Mean ± standard deviation of absolute differences between the CT and pathologic measurement of the invasive component was 4 ± 4 mm in low-dose unenhanced CT and 5 ± 4 mm in standard-dose enhanced CT (Table 3).
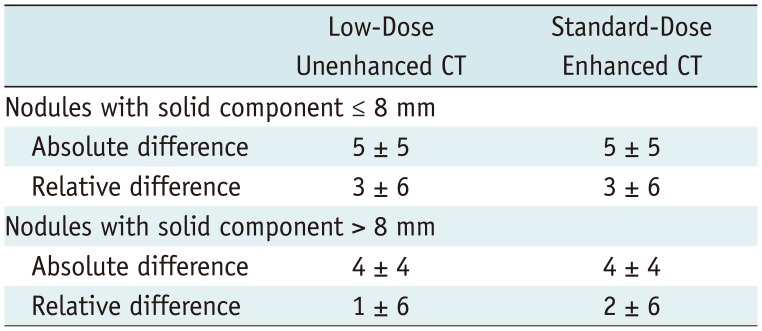
In subgroup analysis, mean ± standard deviation of absolute differences between the solid component on CT and invasive component on pathology was 5 ± 5 mm in low-dose unenhanced CT and 5 ± 5 mm in standard-dose enhanced CT for SSNs with a solid component ≤ 8 mm (Table 4). In SSNs with a solid component > 8 mm, those were 4 ± 4 mm in low-dose unenhanced CT and 4 ± 4 mm in standard-dose enhanced CT.
Based on size criterion of the solid component ≥ 6 mm, diagnostic accuracy of prediction of invasive adenocarcinomas was 81.3% (278/342; 95% CI, 76.7–85.3%) in low-dose unenhanced CT and 76.6% (262/342; 95% CI, 71.8–81.0%) in standard-dose enhanced CT (Table 5). There was no statistically significant difference (p = 0.130) between these values. The effect of slice thickness on diagnostic accuracies in predicting invasive adenocarcinomas was statistically insignificant (p = 0.386). Sensitivity and specificity in the low-dose unenhanced CT were 84.3% (225/267; 95% CI, 79.3–88.4%) and 70.7% (53/75; 95% CI, 59.0–80.6%), respectively, and those in the standard-dose enhanced CT were 76.4% (204/267; 95% CI; 70.8–81.4%) and 77.3% (58/75; 95% CI, 66.2–86.2%), respectively.
Considering the increasing role of low-dose chest CT in managing patients with SSNs, we investigated if measurement on low-dose chest CT are as reliable as that on standard-dose enhanced CT. Differences between CT and pathological measurement, as well as diagnostic accuracies in differentiating invasive adenocarcinomas from minimally or pre-invasive adenocarcinomas on low-dose unenhanced chest CT, were comparable to those on standard-dose enhanced chest CT. Inter-reader agreement on measurement of solid and ground-glass components within SSNs was excellent on low-dose unenhanced CT and standard-dose enhanced CT.
Reduction of radiation dose increases image noise, introduces artifacts, and may affect a radiologist's subjective perception and diagnostic performance (222324). Owing to the complex consequences of radiation dose reduction and lack of contrast enhancement, the impact of low-dose unenhanced chest CT on many diagnostic tasks is being defined. Many previous studies have revealed that there was no significant difference between measurement of solid nodules on low-dose and standard-dose CT (25262728). However, measuring the solid component within a SSN is more challenging than measuring solid nodules, because there is a smaller difference in the attenuation coefficient with its boundary, and it could be more susceptible to increased image noise. Although previous studies have revealed that SSNs could be reliably measured with low-dose unenhanced CT using a chest phantom (1629), there has been no study that has investigated accuracy of low-dose unenhanced CT in measuring the size of the solid component of SSNs in vivo. Therefore, we compared measurement accuracy in diagnosing invasive adenocarcinomas between low-dose unenhanced CT and standard-dose enhanced CT, and revealed that there was no clinically significant difference between these protocols. Results corroborate the Fleischner Society guideline, that recommends follow-up CT with reduced radiation dose in evaluating SSNs, and support the Lung-RADS, that recommends different patient management based on size of the solid component on low-dose CT.
In our study, overall diagnostic accuracy between low-dose unenhanced CT and standard-dose enhanced CT for diagnosing invasive lung adenocarcinomas revealed a similar result. However, specificity on low-dose unenhanced CT was slightly lower than that on standard-dose enhanced CT, although there was no statistically significant difference. We speculate that increased image noise on low-dose unenhanced CT may have led our readers to measure the solid component in a slightly larger diameter than that on standard-dose enhanced CT in patients with minimally or pre-invasive lung adenocarcinomas.
Interestingly, the size of the invasive component on pathology was slightly larger than that of the solid component on CT in this study, whereas the size of the whole tumor on pathology was smaller than that of the whole nodule on CT. There may be several reasons why diameter measurement of the solid component underestimated the size of the invasive component, in contrast to measurement of the whole nodule. First, the solid portion/non-lepidic component less shrinks during formalin fixation, whereas ground-glass portion/lepidic component shrinks significantly during formalin fixation (30). Second, although the pathological invasive component well correlates with a solid component within an SSN, it may manifest as ground-glass attenuation on CT (313233). Specifically, when there is papillary tumor growth or multifocal scattered malignant cells within otherwise normal alveolar space, the invasive component can be observed as only as ground-glass attenuation on CT, but not as solid component. Third, CT measurement was conducted only on the axial plane, whereas pathological measurement was conducted in a three-dimensional manner.
In the previous study by de Jong et al. (21), measured nodule volume on low-dose unenhanced CT was smaller than that on standard-dose enhanced CT in nodules ≤ 8 mm, while nodule volume was similar between the two protocols in nodules > 8 mm. However, in our subgroup analysis of SSNs with a solid component ≤ 8 mm and those with a solid component > 8 mm, the diameter measurement of the solid component demonstrated only sub-millimeter differences between the two CT protocols regardless of size, that is unlikely to cause significant clinical difference.
As low-dose unenhanced CT and standard-dose enhanced CT were compared, the effect of contrast enhancement and radiation dose on measurement of a solid component has not been investigated separately. Standard-dose enhanced CT was selected as the reference study, because it has been widely used for evaluating malignant nodules. Scant information is available for the effect of contrast enhancement on measurement of SSNs. In a study with an inhomogeneous collection of pulmonary nodules in 2006, Goodman et al. (34). found that measurement variability of contrast-enhanced pulmonary nodules lies within confidence limits of all included nodules. However, only 8 enhanced nodules were included in their study. Using semiautomated measurement, Cohen et al. (35) revealed that sizes of the whole nodule and the solid component of SSNs measured significantly larger (by 2 mm and 3 mm on average, respectively) when enhanced. However, CT measurement was not compared with size of the pathologically invasive component and clinical significance remains uncertain, because measurement difference between unenhanced and enhanced images was very small. Recently, Kim et al. (36) revealed variability of 1–2 mm and 2–4 mm in measurements of the whole nodule and solid components, respectively, when they assessed SSNs on 2 consecutive unenhanced CT scans, with a 10-minute interval. Considering this measurement variability and our results, the effect of contrast enhancement on measurement of the solid component may be of minimal clinical significance.
Our study has certain limitations. First, selection bias may exist, because we only included patients that underwent pre-operative contrast-enhanced CT before surgical resection. Second, the effect of contrast enhancement and radiation dose reduction was not evaluated separately. Third, both CT images with a slice thickness of 1 mm and 2 mm were included, due to the heterogeneity in slice thickness of stored CT images. However, low-dose unenhanced and standard-dose enhanced CT images were reconstructed with the same slice thickness in each patient and the effect of slice thickness on diagnostic accuracies in predicting invasive adenocarcinomas was insignificant. Fourth, the effect of iterative reconstruction was not analyzed in this study as the pre-contrast low-dose CT images have been reconstructed with iterative reconstruction in our institution as of November 2015, after the study inclusion period. However, low-dose unenhanced CT images with filtered back projection algorithms revealed comparable diagnostic accuracy with standard-dose enhanced CT, without the aid of iterative reconstruction. Fifth, measurement was conducted only on the axial plane. Measurement using the axial plane was selected based on the result of our separate study, in which multi-planar reconstruction did not reveal significant improvement in the prediction of pathological T-stage (37). We speculate that the design of our study fulfills its purpose, which was to compare low-dose unenhanced CT and standard-dose enhanced CT in prediction of the size of invasive component, considering that both protocols were analyzed only on axial plane. Finally, intra-reader agreement on low-dose unenhanced CT and standard-dose enhanced CT was not evaluated in this study. However, intra-reader agreement is likely to be excellent considering that intra-reader agreement is higher than inter-reader agreement.
In conclusion, measurement of the diameter of the solid component in SSNs on low-dose unenhanced chest CT was as accurate as that on standard-dose enhanced CT for the prediction of the pathologically invasive component of lung adenocarcinoma. Thus, low-dose unenhanced CT can be used safely in evaluation of patients with SSNs.
References
1. Goo JM, Park CM, Lee HJ. Ground-glass nodules on chest CT as imaging biomarkers in the management of lung adenocarcinoma. AJR Am J Roentgenol. 2011; 196:533–543. PMID: 21343494.
2. Rami-Porta R, Bolejack V, Crowley J, Ball D, Kim J, Lyons G, et al. The IASLC lung cancer staging project: proposals for the revisions of the T descriptors in the forthcoming eighth edition of the TNM classification for lung cancer. J Thorac Oncol. 2015; 10:990–1003. PMID: 26134221.
3. Travis WD, Asamura H, Bankier AA, Beasley MB, Detterbeck F, Flieder DB, et al. The IASLC lung cancer staging project: proposals for coding T categories for subsolid nodules and assessment of tumor size in part-solid tumors in the forthcoming eighth edition of the TNM classification of lung cancer. J Thorac Oncol. 2016; 11:1204–1223. PMID: 27107787.
4. Lee HY, Choi YL, Lee KS, Han J, Zo JI, Shim YM, et al. Pure ground-glass opacity neoplastic lung nodules: histopathology, imaging, and management. AJR Am J Roentgenol. 2014; 202:W224–W233. PMID: 24555618.
5. Hwang EJ, Park CM, Ryu Y, Lee SM, Kim YT, Kim YW, et al. Pulmonary adenocarcinomas appearing as part-solid ground-glass nodules: is measuring solid component size a better prognostic indicator? Eur Radiol. 2015; 25:558–567. PMID: 25274618.
6. Zhang Y, Qiang JW, Ye JD, Ye XD, Zhang J. High resolution CT in differentiating minimally invasive component in early lung adenocarcinoma. Lung Cancer. 2014; 84:236–241. PMID: 24679953.
7. Austin JH, Garg K, Aberle D, Yankelevitz D, Kuriyama K, Lee HJ, et al. Radiologic implications of the 2011 classification of adenocarcinoma of the lung. Radiology. 2013; 266:62–71. PMID: 23070271.
8. Cohen JG, Reymond E, Lederlin M, Medici M, Lantuejoul S, Laurent F, et al. Differentiating pre- and minimally invasive from invasive adenocarcinoma using CT-features in persistent pulmonary part-solid nodules in Caucasian patients. Eur J Radiol. 2015; 84:738–744. PMID: 25623825.
9. Chae HD, Park CM, Park SJ, Lee SM, Kim KG, Goo JM. Computerized texture analysis of persistent part-solid ground-glass nodules: differentiation of preinvasive lesions from invasive pulmonary adenocarcinomas. Radiology. 2014; 273:285–293. PMID: 25102296.
10. Lee SM, Park CM, Goo JM, Lee HJ, Wi JY, Kang CH. Invasive pulmonary adenocarcinomas versus preinvasive lesions appearing as ground-glass nodules: differentiation by using CT features. Radiology. 2013; 268:265–273. PMID: 23468575.
11. Lee KH, Goo JM, Park SJ, Wi JY, Chung DH, Go H, et al. Correlation between the size of the solid component on thin-section CT and the invasive component on pathology in small lung adenocarcinomas manifesting as ground-glass nodules. J Thorac Oncol. 2014; 9:74–82. PMID: 24346095.
12. MacMahon H, Naidich DP, Goo JM, Lee KS, Leung ANC, Mayo JR, et al. Guidelines for management of incidental pulmonary nodules detected on CT images: from the Fleischner Society 2017. Radiology. 2017; 284:228–243. PMID: 28240562.
13. Henschke CI, Yankelevitz DF, Mirtcheva R, McGuinness G, McCauley D, Miettinen OS. CT screening for lung cancer: frequency and significance of part-solid and nonsolid nodules. AJR Am J Roentgenol. 2002; 178:1053–1057. PMID: 11959700.
14. Kim H, Park CM, Koh JM, Lee SM, Goo JM. Pulmonary subsolid nodules: what radiologists need to know about the imaging features and management strategy. Diagn Interv Radiol. 2014; 20:47–57. PMID: 24100062.
15. Scholten ET, Jacobs C, van Ginneken B, van Riel S, Vliegenthart R, Oudkerk M, et al. Detection and quantification of the solid component in pulmonary subsolid nodules by semiautomatic segmentation. Eur Radiol. 2015; 25:488–496. PMID: 25287262.
16. Kim H, Park CM, Chae HD, Lee SM, Goo JM. Impact of radiation dose and iterative reconstruction on pulmonary nodule measurements at chest CT: a phantom study. Diagn Interv Radiol. 2015; 21:459–465. PMID: 26359871.
17. Li B, Behrman RH. Comment on the “report of AAPM TG 204: size-specific dose estimates (SSDE) in pediatric and adult body CT examinations” [report of AAPM TG 204, 2011]. Med Phys. 2012; 39:4613–4614. author reply 4615-4616. PMID: 22830792.
18. Brady SL, Kaufman RA. Investigation of American Association of Physicists in Medicine report 204 size-specific dose estimates for pediatric CT implementation. Radiology. 2012; 265:832–840. PMID: 23093679.
19. McCollough C, Cody D, Edyvean S, Geise R, Gould B, Keat N, et al. The measurement, reporting, and management of radiation dose in CT. Virginia: American Association of Physicists in Medicine;2008. p. 1–34.
20. Travis WD, Brambilla E, Nicholson AG, Yatabe Y, Austin JHM, Beasley MB, et al. The 2015 world health organization classification of lung tumors: impact of genetic, clinical and radiologic advances since the 2004 classification. J Thorac Oncol. 2015; 10:1243–1260. PMID: 26291008.
21. de Jong PA, Leiner T, Lammers JW, Gietema HA. Can low-dose unenhanced chest CT be used for follow-up of lung nodules? AJR Am J Roentgenol. 2012; 199:777–780. PMID: 22997367.
22. McCollough CH, Primak AN, Braun N, Kofler J, Yu L, Christner J. Strategies for reducing radiation dose in CT. Radiol Clin North Am. 2009; 47:27–40. PMID: 19195532.
23. Silverman JD, Paul NS, Siewerdsen JH. Investigation of lung nodule detectability in low-dose 320-slice computed tomography. Med Phys. 2009; 36:1700–1710. PMID: 19544787.
24. Yu L, Liu X, Leng S, Kofler JM, Ramirez-Giraldo JC, Qu M, et al. Radiation dose reduction in computed tomography: techniques and future perspective. Imaging Med. 2009; 1:65–84. PMID: 22308169.
25. Hein PA, Romano VC, Rogalla P, Klessen C, Lembcke A, Bornemann L, et al. Variability of semiautomated lung nodule volumetry on ultralow-dose CT: comparison with nodule volumetry on standard-dose CT. J Digit Imaging. 2010; 23:8–17. PMID: 18773240.
26. Sui X, Meinel FG, Song W, Xu X, Wang Z, Wang Y, et al. Detection and size measurements of pulmonary nodules in ultra-low-dose CT with iterative reconstruction compared to low dose CT. Eur J Radiol. 2016; 85:564–570. PMID: 26860668.
27. Christe A, Torrente JC, Lin M, Yen A, Hallett R, Roychoudhury K, et al. CT screening and follow-up of lung nodules: effects of tube current-time setting and nodule size and density on detectability and of tube current-time setting on apparent size. AJR Am J Roentgenol. 2011; 197:623–630. PMID: 21862804.
28. Hein PA, Romano VC, Rogalla P, Klessen C, Lembcke A, Dicken V, et al. Linear and volume measurements of pulmonary nodules at different CT dose levels - intrascan and interscan analysis. Rofo. 2009; 181:24–31. PMID: 19085687.
29. Siegelman JW, Supanich MP, Gavrielides MA. Pulmonary nodules with ground-glass opacity can be reliably measured with low-dose techniques regardless of iterative reconstruction: results of a phantom study. AJR Am J Roentgenol. 2015; 204:1242–1247. PMID: 26001234.
30. Park HS, Lee S, Haam S, Lee GD. Effect of formalin fixation and tumour size in small-sized non-small-cell lung cancer: a prospective, single-centre study. Histopathology. 2017; 71:437–445. PMID: 28407385.
31. Yoo RE, Goo JM, Hwang EJ, Yoon SH, Lee CH, Park CM, et al. Retrospective assessment of interobserver agreement and accuracy in classifications and measurements in subsolid nodules with solid components less than 8mm: which window setting is better? Eur Radiol. 2017; 27:1369–1376. PMID: 27456963.
32. Mao H, Labh K, Han F, Jiang S, Yang Y, Sun X. Diagnosis of the invasiveness of lung adenocarcinoma manifesting as ground glass opacities on high-resolution computed tomography. Thorac Cancer. 2016; 7:129–135. PMID: 26816547.
33. Collins J, Stern EJ. Ground-glass opacity at CT: the ABCs. AJR Am J Roentgenol. 1997; 169:355–367. PMID: 9242736.
34. Goodman LR, Gulsun M, Washington L, Nagy PG, Piacsek KL. Inherent variability of CT lung nodule measurements in vivo using semiautomated volumetric measurements. AJR Am J Roentgenol. 2006; 186:989–994. PMID: 16554568.
35. Cohen JG, Goo JM, Yoo RE, Park SB, van Ginneken B, Ferretti GR, et al. The effect of late-phase contrast enhancement on semi-automatic software measurements of CT attenuation and volume of part-solid nodules in lung adenocarcinomas. Eur J Radiol. 2016; 85:1174–1180. PMID: 27161068.
36. Kim H, Park CM, Song YS, Sunwoo L, Choi YR, Kim JI, et al. Measurement variability of persistent pulmonary subsolid nodules on same-day repeat CT: what is the threshold to determine true nodule growth during follow-up? PLoS One. 2016; 11:e0148853. PMID: 26859665.
37. Ahn H, Lee KW, Lee KH, Kim J, Kim K, Chung JH, et al. Effect of computed tomography window settings and reconstruction plane on 8th edition T-stage classification in patients with lung adenocarcinoma manifesting as a subsolid nodule. Eur J Radiol. 2018; 98:130–135. PMID: 29279151.
Table 1
Low-Dose Unenhanced CT | Standard-Dose Enhanced CT | |
---|---|---|
Whole nodule | 0.90 (0.86–0.93) | 0.91 (0.88–0.94) |
Solid component | 0.84 (0.79–0.88) | 0.89 (0.85–0.92) |