

 PDF
PDF ePub
ePub Citation
 Print
Print


INTRODUCTION
The blood-brain barrier (BBB) is a multicellular vascular structure made up of endothelium, pericytes, and astrocytes that separates the central nervous system from the peripheral blood circulation (1). It inhibits the transfer of substances from the blood to the brain and vice versa and thus maintains an environment that allows neurons to function correctly. Some of the main structures responsible for the properties of the BBB are the tight junctions (TJs), such as occluding (2). The TJs and their adaptor molecules (e.g., zonula occludens-1 [ZO-1]), which link the TJs to the cytoskeleton of endothelial cells and which are essential for the stability and function of the BBB (3), are often affected in the presence of acute and chronic diseases of the brain (4). If one part of the barrier malfunctions, the BBB is disrupted, and this may lead to extravasation and further devastating consequences, such as neuronal damage. Previous studies have found that BBB leakage in the brain can be induced by spontaneous hypertension (56).
The production of beta-amyloid (Aβ)−an Alzheimer's disease biomarker−results from the amyloidogenic processing of the amyloid precursor protein (APP) (78), which is a ubiquitously expressed transmembrane glycoprotein (910). Physiologically, Aβ is released continuously in soluble globular form as a product of whole body cellular metabolism, and it circulates in the bloodstream (11). The Aβ generated in the brain can be eliminated from the brain by the BBB through receptor-mediated transport and perivascular drainage via the vascular basement membrane (1213). Plasma-derived Aβ can also be transferred into the brain through a specific receptor or carrier-mediated mechanisms. The transport of Aβ across the BBB largely determines the concentration of Aβ in the brain (14). Therefore, BBB dysfunction may lead to Aβ accumulation in the brain. Previous studies have demonstrated that hypertension is one of the most common cardiovascular risk factors for Alzheimer's disease (1516). The possible mechanism for this may be that hypertension induces Aβ accumulation in the brain via the following routes: 1) increasing APP expression (17); 2) enhancing APP cleavage (18); 3) enhancing receptor-based Aβ influx processing (15); and 4) impairing Aβ clearance (17). However, the exact mechanism is still unclear, and it is unknown whether Aβ can pass through the disrupted BBB to deposit itself in the brain of an individual with hypertension. We hypothesize that BBB disruption is associated with Aβ influx and accumulation in the brain of aged rats with chronic spontaneous hypertension.
In the present study, we intended to investigate BBB permeability changes in the hippocampus and cortex of aged spontaneously hypertensive rats (SHRs) in vivo using volume transfer constant (Ktrans) obtained from dynamic contrast-enhanced magnetic resonance imaging (DCE-MRI) (19202122). In addition, we sought to evaluate the presence of the BBB tight junction proteins (i.e., occludin and ZO-1), immunoglobulin G (IgG), Aβ, and APP in the hippocampus and cortex with immunohistochemistry.
MATERIALS AND METHODS
Animals
Male SHRs that were 17 months old (male, n = 5) and age-matched male Wistar-Kyoto (WKY) rats (n = 5) were purchased from Dashuo Laboratory Animal Co., Ltd., Chengdu, China. The rats were housed in the Animal Resources Center at West China Hospital, Sichuan University, and they had free access to food and water. They were kept in conditions that mimicked normal daily light and dark cycles. All of the experimental procedures were approved by the local animal committee of West China Hospital, Sichuan University, Chengdu, China.
Dynamic Contrast-Enhanced Magnetic Resonance Imaging Methods and Data Analysis
All the MRI experiments were performed using a 7T MR scanner (Bruker BioSpec 70/30; Bruker Biospin Ettlingen, Germany). Rats were anesthetized with a 2% isoflurane/oxygen mixture throughout the MRI examinations. The rats' body temperatures were kept constant at 37℃ using a heating blanket and monitored with a rectal temperature probe.
All the rats underwent T2-weighted imaging using a T2 spin-echo sequence (repetition time/echo time = 4000/33 ms). The field of view was 35 × 35 mm, number of excitation was 2, and the matrix was 256 × 256 mm. Twenty-five 1.0-mm-thick coronal slices were acquired from each animal. DCE-MRI and data analysis were performed as previously described (21). A bolus of contrast agent (Magnevist [gadopentetate dimeglumine], 0.2 mmol/kg, 10 seconds duration; BeiLu Pharmaceutical Co., Ltd., Beijing, China) was manually injected through each rat's caudal vein after 10 precontrast images were acquired. A series of 120 dynamic T1 spin-echo images were acquired, with the following parameters: repetition time/echo time, 200/10.5 ms; field of view, 30 × 30 mm; number of excitation, 3; flip angle, 178.5 degrees; slice thickness, 2 mm; and in-plane resolution, 234 × 234 µm/pixel.
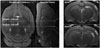
The Ktrans value was calculated with the use of DCE@urLAB 1.0 software for Microsoft Windows 7 (Microsoft, Redmond, WA, USA; http://www.die.upm.es/im/archives/DCEurLAB/). All data processing was performed as previously described (21). The data analysis was performed by two independent observers, who had five-year experience in MRI diagnosis and were blinded to each animal's status. Four regions of interest (ROIs) of the right hippocampus (ROI 1 and 3) and the cortex (ROI 2 and 4) were manually drawn on slice 1 (bregma, -3.60 mm) and slice 2 (bregma, -5.60 mm) of each animal in accordance with the standard rat brain atlas (23), as shown in Figure 1. Both the right and left hippocampus and the cortex were analyzed, and the ROIs of the left hippocampus and the cortex were manually drawn as the ROIs of the right hippocampus and the cortex. Twenty total slices were included for the Ktrans value analysis. For each rat, the Ktrans value of the complete hippocampus or cortex was calculated as the average of the Ktrans values of four ROIs of two slices. We chose the extended Tofts model to calculate the Ktrans value because this model includes the parameter of the plasma volume (24).
Immunohistochemistry
The brain sections were harvested, fixed in 4% formaldehyde, and embedded in paraffin. The sections that contained the hippocampus and cortex in bregma -3.60 mm was cut into 5-µm-thick slices with a sliding microtome (CM 3000; Leica, Bensheim, Germany). Double-labeling immunostaining was performed for occludin and glial fibrillary acidic protein (GFAP), ZO-1 and GFAP, IgG and GFAP, and Aβ and GFAP, respectively. Single-labeling immunostaining was performed for APP. Details of the primary antibodies used are given in Table 1, and details of the immunostaining method have been described previously (25). The slides were incubated with blocking solution (5% normal goat serum in 0.1 M phosphate-buffered saline) for 1 hour at room temperature and then incubated overnight at 4℃ with the primary antibodies. The sections were then incubated with secondary antibodies for 1 hour at room temperature. The secondary antibodies used in this experiment were Alexa Fluor 488 goat anti-chicken IgY H&L (1:200; Abcam), Alexa Fluor 594 goat anti-chicken IgY H&L (1:200; Abcam), and DyLight 594 goat anti-rabbit IgG H&L (1:200; Abcam). The nuclei were counterstained with 4′,6-diamidino-2-phenylindole. The images were acquired via a Leica AF6000 cell station (Leica, Solms, Germany). IgG, Aβ, and APP in the right hippocampus and cortex were evaluated by measuring selectively green or red fluorescence intensity, which was corrected for background fluorescence and expressed as arbitrary fluorescence units (FAU) (26). All images were taken during the first 30 seconds of light exposure when no fluorescence decay was detected in preliminary studies. The data analysis was performed by two experienced laboratory technicians, who were blinded to each animal's status.
Statistical Analysis
Statistical analysis was performed with the use of SPSS for Windows, Version 20 (IBM Corp., Armonk, NY, USA). Quantitative data were tested for normal distribution by using the Kolmogorov-Smirnov test. Normally distributed data were expressed as a mean ± standard deviation. Two-tailed independent-sample t tests were used for animal age, body weight, blood pressure, Ktrans value, and histological data comparison between the two groups. P < 0.05 indicated a significant difference in all the statistical procedures.
RESULTS
Characteristics of Aged Spontaneously Hypertensive Rats and Age-Matched Wistar-Kyoto Rats
The attributes of aged SHRs and age-matched WKY rats are displayed in Table 2. As compared with age-matched WKY rats, aged SHRs had obviously higher levels of systolic blood pressure, diastolic blood pressure, and mean blood pressure. The body weights of the aged SHRs were lower than those of the age-matched WKY rats.
Blood-Brain Barrier Permeability Increase in the Hippocampus and Cortex of Aged Spontaneously Hypertensive Rats
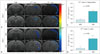
Dynamic contrast-enhanced-MRI was used to evaluate BBB permeability in the hippocampus of aged SHRs and age-matched WKY rats in vivo. The Ktrans maps and the values of the right hippocampus and cortex of aged SHRs and age-matched WKY rats are shown in Figure 2. Low BBB permeability was detected in the right hippocampus and cortex of age-matched WKY rats (Fig. 2A, B, upper rows). By contrast, dramatically high BBB permeability was detected in the right hippocampus and cortex of aged SHRs (Fig. 2A, B, lower rows). The aged SHRs had significantly higher Ktrans values in the hippocampus (0.316 ± 0.027 min−1 vs. 0.084 ± 0.017 min−1, p < 0.001) and cortex (0.302 ± 0.072 min−1 vs. 0.052 ± 0.047 min−1, p < 0.001) as compared with agematched WKY rats.
Blood-Brain Barrier Disruption in the Hippocampus and Cortex of Aged Spontaneously Hypertensive Rats
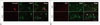
The primary structures responsible for the properties of the BBB are the TJs (e.g., occludin) (2). The adaptor molecules (e.g., ZO-1) that link the TJs to the cytoskeletons of the endothelial cells are essential for the stability and function of the BBB (3). Therefore, occludin and ZO-1 were used to detect the integrity of the BBB in the hippocampus and cortex. Astrocytes extend foot processes that encircle the abluminal side of the vessel almost completely (1). Thus, the astrocytic process around the blood vessel was also visualized by GFAP. In age-matched WKY rats, occludin immunoreactivity formed a continuous and sharply defined pattern of single or double lines marking the paracellular clefts of adjacent endothelial cells in the hippocampus and the cortex, as indicated by white asterisks in Figures 3A and 4A. However, in aged SHRs, occludin immunoreactivity in the BBB in the hippocampus and cortex disappeared, as indicated by white arrows in Figures 3A and 4A. The astrocytic process surrounding the blood vessels remained continuously immunoreactive to GFAP.
The pattern of ZO-1 immunoreactivity in the hippocampus and cortex of age-matched WKY rats was like that seen for occludin expression and involved a continuous and sharply defined staining along the paracellular clefts, as indicated by white asterisks in Figures 3B and 4B. As described previously for occludin immunoreactivity, there were significant changes in ZO-1 expression in the hippocampus and cortex of aged SHRs. The continuous pattern of the paracellular expression of ZO-1 immunoreactivity in age-matched WKY rats disappeared in aged SHRs, as indicated by white arrows in Figures 3B and 4B.
Immunoglobulin Leakage and Beta-Amyloid Accumulation in the Hippocampus and Cortex of Aged Spontaneously Hypertensive Rats
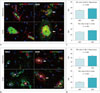
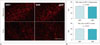
Blood-brain barrier disruption was indicated by the IgG positivity of the small vessel walls (17). GFAP was used to visualize the astrocyte process surrounding the blood vessels (1). The IgG immunoreactivity in the hippocampus and cortex of age-matched WKY rats was detected only within the cerebrovascular lumen, as indicated by black asterisks in Figure 5A. By contrast, aged SHRs showed dramatic IgG leakage and accumulation in the hippocampus and cortex (Fig. 5A). In addition, IgG immunoreactivity was particularly prevalent on the cerebral vessel walls and in the surrounding tissues, as indicated by white arrows in Figure 5A. The FAU values of Aβ in the hippocampus and cortex of aged SHRs were higher than those of age-matched WKY rats (36.644 ± 2.789 vs. 30.754 ± 1.183, p = 0.002 for hippocampus; 35.992 ± 2.230 vs. 30.583 ± 1.646, p 0.002 for cortex), as shown in Figure 5C.
Aβ1-42 was used to detect the Aβ immunoreactivity in the hippocampus and cortex (7). The Aβ immunoreactivity in the hippocampus and cortex of age-matched WKY rats was detected only within the cerebrovascular lumen, as indicated by white asterisks in Figure 5B. By contrast, aged SHRs showed dramatic Aβ accumulation in the hippocampus and cortex (Fig. 5B). The Aβ immunoreactivity was particularly prevalent on the cerebral vessel walls and in the surrounding tissues, as indicated by white arrows in Figure 5B. The FAU values of Aβ in the hippocampus and cortex of aged SHRs were higher than those of age-matched WKY rats (26.355 ± 0.973 vs. 17.829 ± 2.116, p < 0.001 for hippocampus; 35.859 ± 8.584 vs. 20.440 ± 1.899, p = 0.004 for cortex), as shown in Figure 5D.
Amyloid Precursor Protein Expression in the Hippocampus and Cortex of Aged Spontaneously Hypertensive Rats and Age-Matched Wistar-Kyoto Rats
Amyloid precursor protein expression in the hippocampus was evaluated with immunohistochemistry. No significant difference in APP expression in the hippocampus and cortex of aged SHRs and age-matched WKY rats was detected. Representative immunofluorescent images of the pyramidal layer in the cornu ammonis 1 subfield of the hippocampus and the cortex were shown in Figure 6A. The FAU values of APP in the hippocampus and cortex of aged SHRs were like those of age-matched WKY rats (43.603 ± 3.540 vs. 44.860 ± 0.725, p = 0.459 for hippocampus; 39.402 ± 1.869 vs. 40.503 ± 0.931, p = 0.272 for cortex) (Fig. 6B).
DISCUSSION
This study demonstrates for the first time that BBB disruption is associated with Aβ influx and accumulation in the brain of aged rats with chronic spontaneous hypertension. We found that Aβ accumulation was limited to the area surrounding the BBB without extension to other parenchyma regions in the brain of aged SHRs, whereas APP expression in the brain showed no significant results as compared with that of age-matched WKY rats. Our results suggest a bloodstream origin of brain Aβ accumulation (rather than a neuronal source) for those with chronic spontaneous hypertension.
The disruption of the TJs in the brain because of spontaneous hypertension has been demonstrated previously (27). However, a study that evaluated the permeability of the BBB using a non-invasive method in subjects with hypertension was still missing. In the present study, we used the Ktrans values obtained from DCE-MRI to investigate BBB permeability changes in the brain of aged SHRs in vivo (192021). The aged SHRs had dramatically higher Ktrans values in the hippocampus and cortex as compared with age-matched WKY rats, which indicated increased BBB permeability in these animals. With the use of immunohistochemistry, we found a dramatic loss of occludin and ZO-1 in the hippocampus and cortex of aged SHRs. These results were consistent with those of a previous study (27) and confirmed the BBB disruption in the hippocampus and cortex of aged SHRs that had been detected by DCE-MRI. Furthermore, dramatic IgG exudation and accumulation were also identified, which directly demonstrated BBB disruption in the hippocampus and cortex of aged SHRs. Thus, based on these findings, we propose that DCE-MRI can be used to perform a noninvasive longitudinal assessment of an impaired BBB, which may provide a promising diagnostic and therapeutic index for doctors.
The Aβ generated in the brain can be eliminated from the brain by the BBB through receptor-mediated transport and perivascular drainage along the vascular basement membrane (1213). Plasma-derived Aβ can also be transferred into the brain through a specific receptor or carrier-mediated mechanisms. The transport of Aβ across the BBB largely determines the concentration of Aβ in the brain (14). Therefore, BBB dysfunction may lead to Aβ accumulation in the brain. In the present study, we found dramatic Aβ accumulation in the hippocampus and cortex of aged SHRs. The Aβ accumulation was limited to the area surrounding the BBB, without extension to other parenchyma regions, which suggest a bloodstream origin of brain Aβ accumulation (rather than a neuronal source) for those with chronic spontaneous hypertension. Aβ accumulation on microvessel walls with concomitant BBB leakage in the hippocampus and cortex has been found previously in subjects with chronic hypertension induced by transverse aortic coarctation or angiotensin II infusion (26); however, the integrity of the TJs in the BBB in the hippocampus was not investigated. More recently, it has been demonstrated that non-transgenic spontaneous hypertension caused visible Aβ accumulation with BBB leakage in the hippocampus of rats (1728). However, in those studies, Aβ was not limited to blood vessels, which indicated that the accumulated Aβ was not derived from plasma. Those studies also demonstrated that stroke-prone SHRs developed cerebral small vessel disease pathology, which may result in a failure to clear Aβ. These results were inconsistent with those of the present study, probably because of the differences in the hypertension model used and the duration of hypertension.
Amyloid precursor protein is an integral membrane protein that is abundantly expressed in the neuronal synapses (29). In patients with Alzheimer's disease, its proteolysis generates Aβ, which is the main component of amyloid plaques. It has been reported that chronic hypertension could increase APP expression in the brain (17), and increased APP expression was found in 20-week-old stroke-prone SHRs. Surprisingly, we did not find any significant differences in APP expression in the hippocampus and cortex of aged SHRs and age-matched WKY rats. This was in line with the study that demonstrated hypertension induced by the chronic infusion of angiotensin II into C57BL/6 mice failed to increase APP expression in the brain (29). Different models and durations of hypertension may help to explain this inconsistency. Overall, the unchanged APP expression-together with the direct evidence of Aβ accumulation surrounding the BBB-indicated that Aβ accumulation in the hippocampus and cortex of aged SHRs was derived from plasma than from the brain.
A further study with a larger number of subjects is warranted to confirm our findings in the future. In addition, there may have been other complications such as diabetes which we did not exclude but may have also led to BBB disruption.
In the present study, we found obvious BBB disruption with dramatic Aβ accumulation in the hippocampus and cortex of aged SHRs. The Aβ accumulation was limited to the area surrounding the BBB, without extension to other parenchyma regions. Alternatively, APP expression in the hippocampus and cortex was not significance as compared with that of WKY rats. Our results suggest a bloodstream origin of brain Aβ accumulation rather than a neuronal source. These results support that BBB disruption is associated with Aβ influx and accumulation in the hippocampus and cortex of aged SHRs. DCE-MRI can be used as an effective method to investigate BBB damage.


 XML Download