

 PDF
PDF ePub
ePub Citation
 Print
Print


INTRODUCTION
Multiple myeloma (MM) is a major primary bone neoplasm in adults characterized by malignant proliferation of plasma cells in bone marrow (BM), which results in a wide range of bone abnormalities (1). Bone lesions and related symptoms or signs are major clinical features of MM (123), suggesting that evaluation of the whole-body skeleton is essential for the diagnosis, staging, and assessment of treatment response in MM patients (14). Plain radiography is universally available and relatively inexpensive, and therefore, used as a conventional imaging modality for skeletal survey in patients with MM (4).
Over the past few decades, magnetic resonance imaging (MRI) and 18F-fluorodeoxyglucose positron emission tomography/computed tomography (18F-FDG PET/CT) have emerged as useful diagnostic imaging and treatment modalities for MM (56). These modalities are superior to plain radiography in evaluating skeletal and extra-skeletal disease status (789). Although plain radiography facilitates the detection of cortical bone lesions, it can only detect abnormal morphological findings (56). However, 18F-FDG PET/CT and MRI are sensitive tools for the detection of medullary and extra-medullary lesions (7891011).
In addition to superior diagnostic and staging ability in MM, 18F-FDG PET/CT has the potential to improve prediction of disease outcomes (12131415). The findings and parameters of 18F-FDG PET/CT can indicate disease aggressiveness and prognosis (1216), and exceed morphological findings based on conventional imaging. Tumor metabolism evaluated by 18F-FDG PET/CT is an accepted pathophysiological property related to disease aggressiveness as well as other disease characteristics (1216). Recent prospective studies demonstrated that the number of 18F-FDG-avid focal lesions or the intensity of 18F-FDG uptake are useful surrogate markers in predicting prognosis of MM patient (121314). Reliable prognostic markers likely affect treatment decisions, and therefore, investigation of the prognostic predictive value of imaging modalities for diagnosis has significant clinical implications. However, the 18F-FDG PET/CT findings and parameters as prognostic indicators have not been fully investigated, especially in the Korean population.
Thus, we conducted this retrospective multicenter cohort study to investigate the prognostic value of 18F-FDG PET/CT in Korean patients with MM.
Go to : 
MATERIALS AND METHODS
Study Population
Subjects included 82 patients with newly diagnosed MM and pretreated with 18F-FDG PET/CT at four hospitals (Samsung Medical Center, 23 patients; Seoul St. Mary's Hospital: 25 patients; Seoul National University Hospital, 12 patients; and Kyungpook National University Hospital, 22 patients) from January 2008 to December 2014. Of these 82 patients, 4 showed a second malignancy during staging, 1 had a history of prior treatment, and 1 did not undergo treatment. A total of 76 patients were finally included in the study. All the enrolled patients had normal blood sugar levels or controlled diabetes mellitus (< 200 mg/dL). All the clinical data of the enrolled patients were collected via review of electronic medical records. The Institutional Review Boards of the four participating hospitals approved this retrospective multicenter cohort study, and the requirement to obtain informed consent was waived.
PET/CT Imaging
All the patients fasted for at least 6 hours, and blood glucose was < 200 mg/dL at the time of 18F-FDG injection. PET/CT without intravenous or oral contrast was performed with dedicated PET/CT scanners (Discovery LS or Discovery STE, GE Healthcare [Chicago, IL, USA] at Samsung Medical Center; Biograph DUO or Biograph Truepoint, Siemens Healthcare [Erlangen, Germany] at Seoul St. Mary's Hospital; Biograph TruePoint 40 or mCT 40, Siemens Healthcare at Seoul National University Hospital; Reveal RT-HiREZ 6-slice CT, CTI Molecular Imaging or Discovery STE, GE Healthcare at Kyungpook National University Hospital). At 60 minutes after injecting 225–550 MBq 18F-FDG, CT images were obtained from the skull base to the proximal thigh or the whole body using helical CTs (120–140 kVp, 25–170 mAs), adjusted for body thickness. PET followed immediately over the same body region at 1–4 minutes per frame in two-dimensional or three-dimensional mode. Attenuation-corrected PET images were reconstructed using CT data and an iterative method (2 or 4 iterations).
Image Analysis and Definitions
PET/CT images were reviewed by consensus of two nuclear medicine physicians, blinded to patient clinical information. The focal areas of detectable 18F-FDG uptake more intense than mediastinal activity within bones were considered to be 18F-FDG-avid bone lesions, with or without an underlying lesion identified by CT scan. In the absence of an underlying lytic lesion on CT images, the focal area was considered to be positive if visually detected in two or more slices regardless of the 18F-FDG uptake to avoid misinterpretation of mild inhomogeneous 18F-FDG uptake in the BM. Furthermore, the 18F-FDG uptake on the articular processes was designated as an active joint problem and excluded. The 18F-FDG-avid lesions arising external to the bone were designated as extramedullary disease. The number of 18F-FDG-avid lesions and involved sites were counted and used for further analysis.
Clinical characteristics and laboratory findings were evaluated including the International Staging System, the Durie-Salmon criteria, anemia (hemoglobin < 10 g/dL), azotemia (creatinine > 2 mg/dL), hypercalcemia (calcium > 10 mg/dL), and high-risk cytogenetic abnormalities (Del [17p], t [14;16], t [14;20]) (17). Overall survival (OS) was defined as the time starting with the first-line treatment until death due to any cause, with censoring of surviving patients at the date of final follow-up. Progression-free survival (PFS) was defined as the time from the date of first-line treatment until the date of disease progression, with censoring at the date of final follow-up if the patient had not progressed. The International Uniform Response Criteria were used to evaluate disease progression at all the enrolled hospitals.
Statistical Analysis
Statistical analyses were performed using commercial software (PASW Statistics 18; SPSS Inc., Chicago, IL, USA). The prognostic significance of PET parameters and other clinical variables was assessed by univariate and multivariate analyses using a Cox proportional hazards regression model. The optimal cut-off values that divided study subjects into two subgroups with poor or good prognosis for each parameter were determined by receiver operating characteristic (ROC) curve analysis. Trends for the proportions of poor prognosis according to the developed scale were tested with the Cochran-Armitage test. The PFS and the OS according to the scale were estimated using the Kaplan-Meier method and compared using the log-rank test.
Comparisons of values between groups were performed using the independent samples t test for continuous variables and the chi-square test for dichotomous variables. All tests were two-tailed, and p values less than 0.05 were considered statistically significant.
Go to :
RESULTS
Patient Characteristics
Clinical characteristics of the enrolled patients are summarized in Table 1. Patients were clinically followed up for a median of 27.6 months (range, 1.2–98.4 months). Of the 76 patients enrolled in this study, 26 patients (34.2%) died during the follow-up period and 35 patients (46.1%) had disease progression, with a median PFS of 17.9 months. Twelve patients (15.8%) were lost to follow-up after treatment with a median follow-up duration of 26.4 months (range, 4.8–98.4 months). Study patients underwent treatments included chemotherapy only (53 patients, 69.7%), radiotherapy combined with chemotherapy (21 patients, 27.6%), surgery combined with chemotherapy (1 patients, 1.3%), and one patient (1.3%) received conservative management due to pneumonia and died before chemotherapy. This patient was excluded from the survival analysis for disease progression. The overall principles and trends in chemotherapy regimens were similar among the participating hospitals. In elderly patients (≥ 60 or 65), melphalan and prednisone-based therapy with or without bortezomib were administered. Thalidomide and dexamethasone-based treatment was performed in the other patients.
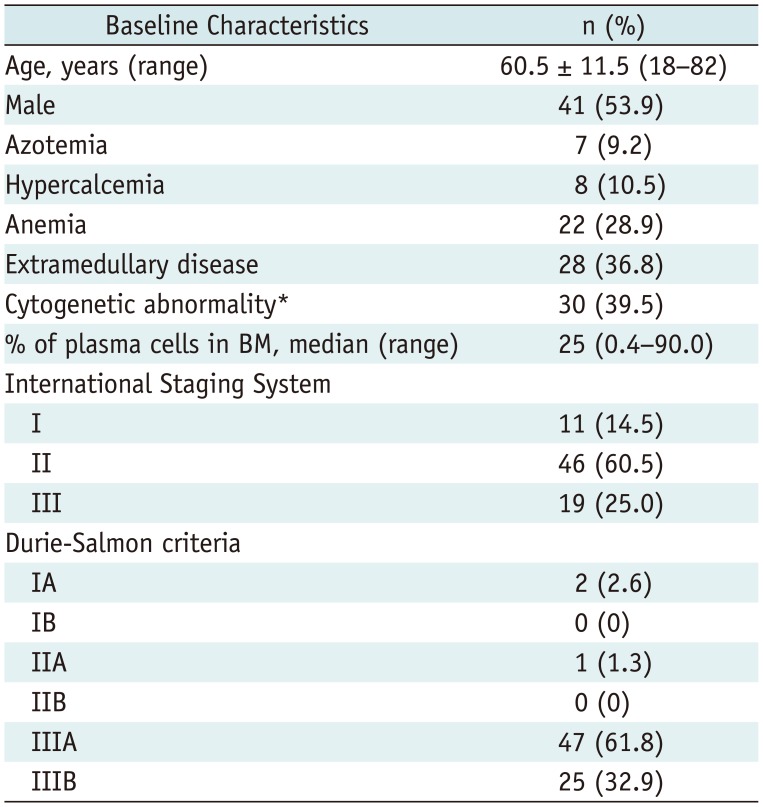
Table 1
Study Patient Characteristics (n = 76)
![]()
Twenty-eight patients (28/76; 36.8%) had extramedullary disease on baseline PET/CT scans. Fifteen of the 28 patients (15/28; 53.6%) showed direct extension from skeletal tumors and 13 (13/28; 46.4%) had involvement at extra-skeletal sites. Extra-skeletal involvement included stomach, muscle, pelvis, brain, skin, orbit and sinus, and lymph nodes. Seven of the 13 cases with extramedullary diseases arising at an extra-skeletal site (4 lymph nodes, 1 stomach, 1 pelvis, and 1 brain) were biopsy-proven and another 6 cases were diagnosed based on contrast-enhanced CT, or MRI findings. Eight patients (8/76; 10.5%) had no 18F-FDG-avid bone lesions, whereas 66 (66/76; 89.5%) had 18F-FDG-avid bone lesions on baseline PET/CT scan. Among the 76 patients, 26 (26/76; 34.2%) had < 3 18F-FDG-avid bone lesions, 14 (14/76; 18.4%) had 3–9 lesions, and 36 (36/76; 47.4%) had ≥ 10 lesions.
Identification of Prognostic Indicators
Three 18F-FDG-avid bone lesions were determined as the cut-off value to divide the patients into two subgroups with poor or good OS by ROC curve analysis, and were used for further analysis.
Univariate analysis with a Cox proportional hazards models demonstrated that 18F-FDG-avid focal lesions (≥ 3), hypercalcemia, and the presence of extramedullary disease were significant predictors of PFS (Table 2). 18F-FDG-avid focal lesions (≥ 3) and extramedullary disease revealed significant associations with poor OS, compared with other variables and clinical characteristics (Table 3).
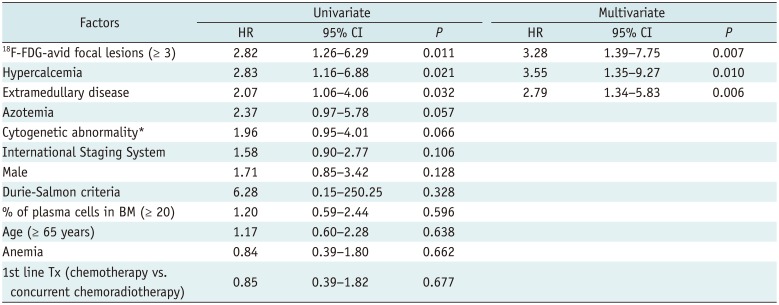
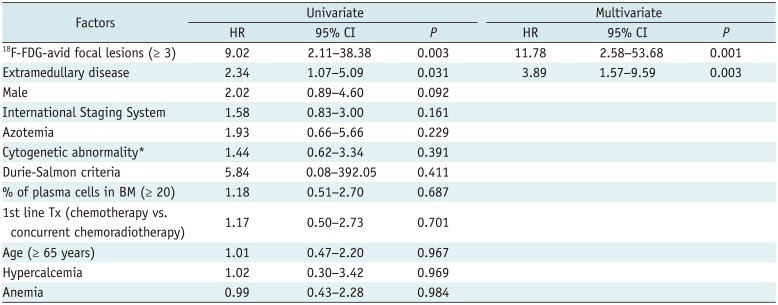
Table 2
Cox Regression Analysis for Risk Factors Associated with Progression-Free Survival
![]()
Table 3
Cox Regression Analysis for Risk Factors Associated with Overall Survival
![]()
Multivariate analysis using the significant univariate factors mentioned above revealed that 18F-FDG-avid focal lesions (≥ 3) and the presence of extramedullary disease were independent predictors of poor PFS and OS (Tables 2, 3). In addition, hypercalcemia was a significant predictor of poor PFS (Table 2).
Comparison of Characteristics according to FDG-Avid Bone Lesions
Clinical characteristics according to subgroup, categorized by the number of 18F-FDG-avid bone lesions, are presented in the Table 4. Comparison of clinical characteristics between the ≥ 3 and < 3 groups revealed significant differences in several variables.
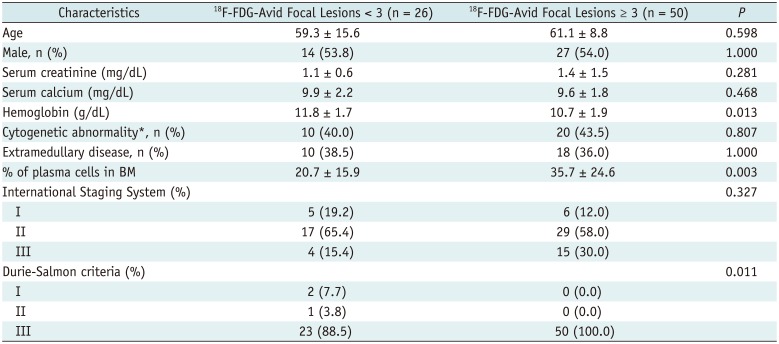
Table 4
Comparison of Clinical Characteristics according to 18F-FDG-Avid Bone Lesions
![]()
Hemoglobin levels in the ≥ 3 groups were significantly decreased compared with those of the < 3 groups. In addition, the percentage of plasma cells in BM was also significantly different between the two groups. The group with ≥ 3 lesions showed a substantially increased percentage of plasma cells in BM.
There was no significant difference in the proportion of patients among the groups classified by the international staging system. Conversely, the proportion of patients with stage III disease classified by Durie-Salmon criteria was significantly higher in the group with ≥ 3 lesions compared with the group with < 3 lesions. Other clinical and laboratory findings were not significantly different between the groups.
Development of the Prediction Scale
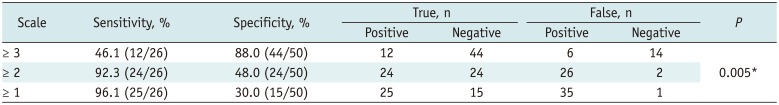
18F-FDG-avid focal lesions (≥ 3) and the presence of extramedullary disease were included in the clinical prediction scale. Each indicator was allotted points based on its hazard ratio to develop the scale (2 for ≥ 3 18F-FDG-avid focal lesions and 1 for the presence of extramedullary disease). An increase in score on the scale corresponded to a significantly increased risk of death (p = 0.005) (Table 5). The performance of the scale in predicting death during follow-up is summarized in Table 5. At a cut-off score of 2, the scale had a sensitivity of 92.3% and a specificity of 48.0% (Table 5).
In addition, the Kaplan-Meier analysis demonstrated that OS significantly differed according to the scale value (Fig. 1A). Patients with a score of 2 showed better OS compared with patients with score 3, while they showed poor OS compared with patients scoring 1 or less (p < 0.001). PFS also varied according to the scale (p = 0.001) (Fig. 1B). Representative images of cases with good and poor prognosis are presented in Figure 2.
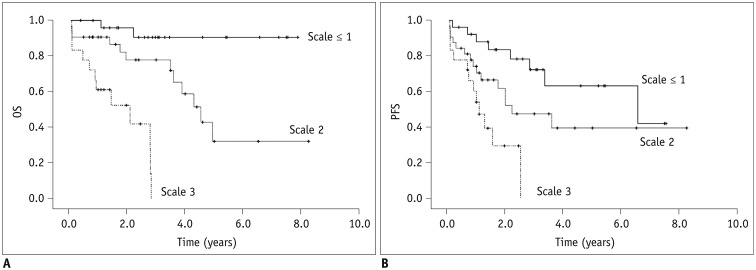 | Fig. 1Kaplan-Meier analysis shows OS and progression-free survival.
A. OS according to developed PET-based scale (mean OS: 1.7 years; [95% CI, 1.2–2.3] in patients with scale score 3; 4.8 years, [95% CI, 3.5–6.1] in patients with score 2; and 7.3 years, [95% CI, 6.5–8.1] in patients with score ≤ 1; pp < 0.001). B. PFS according to developed PET-based scale (mean PFS: 1.3 years, [95% CI, 0.8–1.8] in patients with score 3; 4.1 years, [95% CI, 2.7–5.5] in atients with score 2; and 5.3 years, [95% CI, 4.1–6.5] in patients with score ≤ 1; p = 0.001). CI = confidence interval, OS = overall survival, PFS = progression-free survival
|
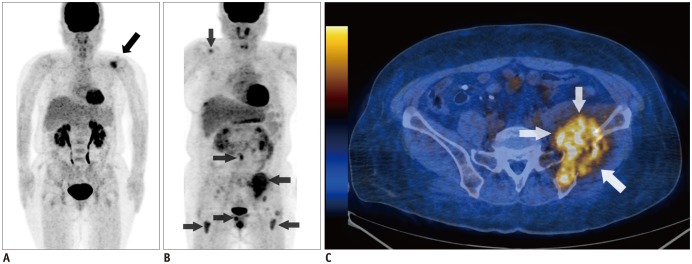 | Fig. 2Representative images of patients with scores 0 and 3.
A. 56-year-old female patient had 4 osteolytic lesions in left scapula, T-spines, and sacrum. Among these lesions, left scapular was only PET positive (black arrow). This patient had score of 0 and has been alive for 7.8 years. B. 50-year-old female patient had multiple PET positive lesions in right scapula, lumbar spine, right pubic bone, left ilium, and both femurs (black arrows). C. Left iliac bone lesion showed direct extension to adjacent muscles (white arrows). This patient had score of 3 and died 4.8 months after treatment.
|
Go to :
DISCUSSION
Our study showed that the presence of three or more 18F-FDG-avid focal bone lesions and extramedullary disease were independent parameters associated with poor prognosis in patients with MM. Patients with three or more 18F-FDG-avid lesions and extramedullary disease on PET scan showed significantly shorter OS. In addition, the prognostic scale using these two imaging findings showed significant potential for predicting OS. These findings suggest that the presence of three or more 18F-FDG-avid bone lesions and extramedullary disease may be useful prognostic parameters for identifying high-risk patients.
The prognostic value of 18F-FDG PET/CT has been demonstrated in previous studies (12131415). The number of 18F-FDG-avid bone lesions (1213) or the intensity of tumor metabolism (131415), presented as standardized uptake values (SUV), showed significant associations with survival duration in enrolled patients. The study finding indicating that three or more 18F-FDG-avid bone lesions at baseline scan were associated with poor prognosis is consistent with previous studies (1213). Bartel et al. (12) reported that both overall and event-free survival durations were significantly shorter in patients with more than three focal lesions on baseline PET in a study including 239 patients who received 18F-FDG PET/CT scans at baseline. In a prospective study of 192 patients by Zamagni et al. (13), the presence of at least three focal lesions at baseline scan was adversely associated with 4-year estimates of PFS. The results from our and previous studies support that the number of 18F-FDG-avid bone lesions is a useful marker to distinguish between favorable outcome and poor survival in MM patients. The optimal cut-off number of 18F-FDG-avid bone lesions has not been established. However, the cut-off value in our study was identical or close to that of previous studies, which supports the validity of the selected value.
Our study also showed that presence of extramedullary disease at baseline PET/CT scan had a significant association with poor prognosis. This result was consistent with previous studies that reported MM patients with extramedullary disease had poor prognosis (1819). Meanwhile, there was an apparent discrepancy in detecting extramedullary disease between the present study and previous studies. We found that 38% of patients (35/92) had extramedullary disease at the time of initial diagnosis, while researchers in previous studies reported the presence of extramedullary disease in approximately 4–16% (20). The finding might be attributed to the availability of more sensitive imaging techniques than those in the previous studies (21).
Standardized uptake values is an important marker of PET/CT, also known for having prognostic and predictive value in patients (131415). Zamagni et al. (13), reported that maximum SUV (SUVmax) greater than 4.2 of focal hypermetabolic bone lesion at baseline scan and persistence of 18F-FDG uptake after auto-transplantation were independent factors for poor PFS in a multivariate analysis. Dimitrakopoulou-Strauss et al. (14) also showed that patients with baseline SUVmax greater than 4.0 had shorter PFS after chemotherapy. Additionally, in a study with 61 patients, SUVmax of BM showed significant correlations with other clinical variables including β2-microglobulin, albumin, creatinine, percentage of BM plasma cells, International Staging System score, and Durie-Salmon criteria (15).
Although both number and SUVmax of 18F-FDG-avid bone lesions allow prediction of prognosis in patients with MM, we used the number of 18F-FDG-avid bone lesions only as a prognostic marker of 18F-FDG PET/CT in our study. This is a methodological issue worth discussing. Identifying and counting 18F-FDG-avid bone lesions are simple, and easily accessible imaging analysis ensures consistent results between investigators regardless of scanners and study protocols, and facilitates a multicenter study. SUVmax is the most widely used 18F-FDG PET parameter, allowing quantitative measurement of tumor metabolism. The parameter enables measurement of tumor burden more precisely than simple visual analysis. However, SUVmax is affected by various factors including patient condition, noise, reconstruction algorithm, smoothing, and even the voxel size along with the model of the PET/CT scanner (2223). Consequently, in a retrospective multicenter study with variable scanners and imaging protocols, SUVmax cannot guarantee consistent results between the hospitals.
Limitations of this study are its retrospective design and heterogeneous distribution of treatment procedures. Over the last decade, the treatment options for MM have significantly changed with the introduction of novel therapeutic agents that are covered by insurance policies (242526). Consequently, the study patients underwent various treatment regimens. Additionally, the relatively small number of study patients is another limitation, which can be partly explained by the fact that only a few MM patients received 18F-FDG PET/CT scans based on physician discretion. The imaging modality was not accepted as a standardized imaging tool under insurance policies until 2014 in Korea. In addition, the diversity of PET machines and acquisition protocols might contribute to the differences in sensitivity for detection of myeloma. Despite these limitations, the presence of three or more 18F-FDG-avid focal bone lesions and extramedullary disease at baseline PET/CT scan are consistent with previous studies, and the fact that these 18F-FDG PET/CT findings exhibited significant capacity for predicting survival outcome is quite reliable.
In conclusion, three or more 18F-FDG-avid bone lesions and extramedullary disease at baseline 18F-FDG PET/CT scan were independent predictors of poor OS in patients with MM. Further, the scale developed based on these predictors showed promising results for predicting clinical outcomes. These results suggest that imaging findings obtained from 18F-FDG PET/CT may be useful parameters in predicting prognosis, and in identifying high-risk patients. Given that treatment options and intensity can be tailored to each patient's risk, these PET parameters may be helpful in selecting candidates who might benefit from intensive therapy in this refractory disease (25). Additional well-designed prospective studies are needed to corroborate the study findings and implications for clinical practice.
Go to :
 XML Download