

 PDF
PDF ePub
ePub Citation
 Print
Print


INTRODUCTION
Destructive thyroiditis is one of the causes of thyrotoxicosis and features destruction of thyroid glands and release of thyroid hormones into the bloodstream (12). The pathophysiological diagnosis of destructive thyroiditis includes subacute thyroiditis, painless thyroiditis (post-partum or sporadic), and acute suppurative thyroiditis. Inflammation of the thyroid glands triggered by viral infection (subacute thyroiditis) (34), auto-immune reaction (painless thyroiditis) (56), or bacterial infection (acute suppurative thyroiditis) (78) is a common feature of destructive thyroiditis. Acute suppurative thyroiditis is relatively rare and has the distinct feature of thyroid abscess. Thus, it does not pose difficulty for diagnosis. Differential diagnosis of destructive thyroiditis from hyperthyroidism (i.e., Graves' disease) is an important clinical challenge in patients with thyrotoxicosis, but the specific type of destructive thyroiditis often does not receive attention, because the disease course is similar and the therapeutic approach does not differ significantly between the subacute thyroiditis and the painless thyroiditis (129).
Even though radioactive iodine-uptake measurement is the standard test used for assessment of thyroid function, Tc-99m pertechnetate uptake/scintigraphy has been widely used for differential diagnosis of destructive thyroiditis from Graves' disease, mainly because of its simplicity and availability (41011). The degree of Tc-99m pertechnetate uptake had been quantified using a two-dimensional thyroid uptake system or planar scintigraphy. However, the accuracy of Tc-99m pertechnetate uptake was not acceptable until quantitative single-photon emission computed tomography/computed tomography (SPECT/CT) emerged as a novel gamma camera imaging technology (1213). Due to technical advancements of radioactivity correction algorithms, such as attenuation correction, scatter correction, and collimator-detector response correction (resolution recovery), SPECT/CT now equals the level of positron-emission tomography (PET) in terms of the accuracy of measurement of quantitative parameters that include %uptake or standardized uptake value (SUV) (1415). Our group applied Tc-99m pertechnetate quantitative SPECT/CT to a variety of functional thyroid diseases and observed the robustness of the quantitative parameters in the diagnosis of the thyroid diseases (16). Furthermore, we found that the disease course of the Graves' disease could be predicted using SPECT/CT-derived Tc-99m pertechnetate %uptake (17), which had not been reported previously. Therefore, quantitative SPECT/CT may be useful for risk stratification of functional thyroid diseases.
We intended to assess the quantitative parameters of Tc-99m pertechnetate SPECT/CT in patients with destructive thyroiditis, in an attempt to prove that more precise disease characterization would be possible in this condition by using these novel quantitative parameters.
MATERIALS AND METHODS
Patients
This study was approved by the Institutional Review Committee and the need for obtaining informed consent from patients was waived by the committee.
The study was approved by an Institutional Review Board (IRB) and has been performed in accordance with the ethical standards laid down in the 1964 Declaration of Helsinki and its later amendments. The need for informed consents was waived by the IRB.
Patients were identified via the Clinical Data Warehouse tool of Seoul National University Bundang Hospital. From June 2015 to February 2016, 196 consecutive patients underwent Tc-99m pertechnetate SPECT/CT to reveal the cause of thyrotoxicosis in our institute. Thyrotoxicosis was suspected in those patients because typical thyrotoxic symptoms were self-reported and/or thyroid function test results revealed thyrotoxicity (elevated free T4/T3 and suppressed thyroid-stimulating hormone [TSH]). The final diagnosis was Graves' disease (n = 110), toxic adenoma (n = 16), toxic multinodular goiter (n = 12), drug-induced thyrotoxicosis (n = 6), and destructive thyroiditis (n = 52). For the latter 52 patients, those with a short follow-up period (< 1 month, n = 8), no follow-up thyroid function test results (n = 4), and prior management at different hospitals (n = 5) were excluded. Consequently, 35 destructive thyroiditis patients were included in the analysis (26 subacute thyroiditis, 6 painless thyroiditis, and 3 post-partum thyroiditis cases). The final diagnosis was made considering the clinical context, thyroid hormone levels, thyroid auto-antibody levels, ultrasonography, and thyroid scintigraphy findings by expert endocrinologists. No patients were taking amiodarone, lithium, cytokines, tyrosine kinase inhibitors, or thyroxine. The patients showed mild thyrotoxic features in terms of thyroid hormone and thyroid auto-antibody levels at the time of initial presentation (Table 1). The mean free T4 levels were above the reference range, but the mean T3 levels were within the reference range. The mean TSH levels were lower than the reference range. In 20 cases where the value of TSH was below the detection limit (i.e., < 0.05 µIU/mL), the detection limit value of 0.05 µIU/mL was employed for statistical analyses.
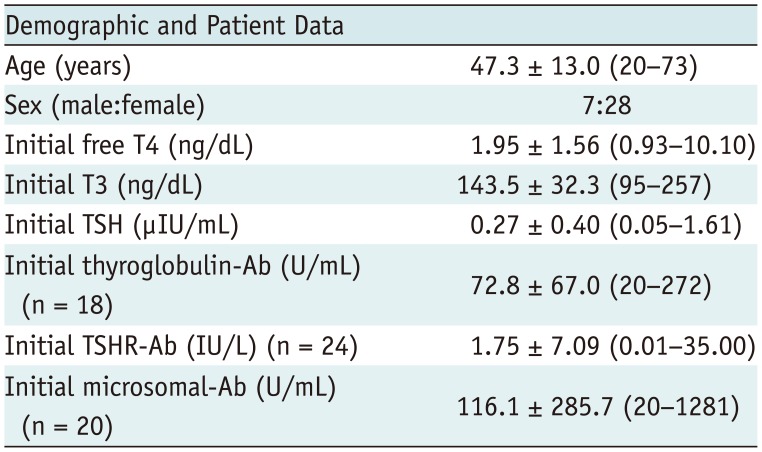
Table 1
Characteristics of Destructive Thyroiditis Patients (n = 35)
Data are mean ± standard deviation (range). Reference ranges: free T4 (0.89 – 1.79 ng/dL), T3 (79 – 200 ng/dL), TSH (0.3 – 4.0 µIU/ mL), thyroglobulin-Ab (0 – 60 U/mL), TSHR-Ab (0 – 1.0 IU/L), and microsomal-Ab (0 – 60 U/mL). TSH = thyroid-stimulating hormone, TSHR = thyroid-stimulating hormone receptor
![]()
Of the 35 destructive thyroiditis patients, 13 were prescribed beta-blocker (propranolol) alone (n = 11) or beta-blocker and prednisolone (n = 2) at the time of initial diagnosis. Thyroid hormone levels (free T4, T3, and TSH) were re-assessed every 1−2 months thereafter.
We also included 20 euthyroid patients (6 males and 14 females; mean age, 45.0 ± 14.8 years) as a control group.
Quantitative Thyroid SPECT/CT
The quantitative SPECT/CT protocol has been described in detail in the literature (16). First, the SPECT/CT scanner (NM/CT 670, GE Healthcare, Pittsburgh, PA, USA) equipped with low-energy high-resolution collimator was calibrated to the dose calibrator (CRC-15R, CAPINTEC, Ramsey, NJ, USA) that was used for measurement of the injected dose of Tc-99m pertechnetate. The calibration factor (the system sensitivity of the SPECT/CT scanner) was determined to be 10176 counts/sec/mCi for Tc-99m (15). Second, using the calibrated scanner, SPECT/CT was performed over the neck area 20 minutes after injection of Tc-99m pertechnetate (dose 5 mCi) (16). A planar anterior image was obtained for 1 minute before the SPECT/CT acquisition. SPECT images were acquired with a counter-clockwise rotation of the detectors in a continuous mode for 1 minute, peak energy of 140 KeV with 20% window (126−154 KeV), scatter energy of 120 KeV with 10% window (115−125 KeV), and zoom factor of 1.5. The SPECT images were reconstructed using the following parameters (Volumetrix MI, GE Healthcare): iterative ordered-subset expectation maximization algorithm (2 iterations and 10 subsets) with triple corrections (CT-based attenuation correction, dual-energy-window scatter correction, and resolution recovery), Butterworth post-reconstruction filter (frequency of 0.48 and order of 10), matrix size of 128 × 128, and slice thickness of 2.95 mm. CT was obtained immediately after SPECT acquisition. The CT parameters were tube voltage of 120 KVp, tube current of 180 mA, helical thickness of 2.5 mm, detector collimation of 20 mm (16 × 1.25 mm), table speed of 37 mm/sec, table feed per rotation of 18.75 mm/rot, tube rotation time of 0.5 second, and pitch of 0.938:1. CT images were reconstructed using an adaptive statistical iterative reconstruction algorithm (ASiR, GE Healthcare) into a 512 × 512 matrix size and trans-axial slice thickness of 2.5 mm. The effective dose from the current SPECT/CT protocol was estimated as 3.34 mSv (2.22 mSv from 5 mCi of Tc-99m pertechnetate plus 1.12 mSv from CT) (16).
Quantitative Parameters from the SPECT/CT
The %uptake, SUVmean, and SUVmax of thyroid were directly obtained from the vendor-provided software (Q.Metrix, GE Healthcare). The required information for the calculation of the parameters was the pre-injection radioactivity (-5 mCi) and the measurement time, postinjection residual radioactivity and measurement time, time of injection, time of image acquisition, body weight, and system sensitivity of the SPECT/CT scanner (10176 counts/sec/mCi for Tc-99m). The equations used for the respective parameters were:


The voxel volume was 3.2 × 10⁻³ mL in the current study protocol.
Thyroid/Background Ratio from the Planar Scan
Using the planar anterior images, a square region-of-interest was drawn over the anterior neck for thyroid and left lower neck for background (Supplementary Fig. 1A in the online-only Data Supplement). The thyroid/background (T/B) ratio was then calculated.
Thyroid Hormones and Auto-Antibodies
Radioimmunoassay (RIA) or immunoradiometric assay (IRMA) kits were used in all the patients. For free T4, an RIA kit (IMMUNOTECH, Prague, Czech Republic) was used with a reference range of 0.89−1.79 ng/dL. For T3, another RIA kit (BRAHMS, Hennigsdorf, Germany) was employed with a reference range of 79−200 ng/dL. For TSH, an IRMA kit (DiaSorin, Saluggia, Italy) was used with a reference range of 0.3−4.0 µIU/mL. Microsomal antibody was measured using another RIA kit (BRAHMS, Hennigsdorf, Germany) with a reference range of 0−60 U/mL. TSH receptor antibody was measured using a radio receptor assay kit (BRAHMS) with a reference range of 0−1.0 IU/L. Lastly, thyroglobulin antibody was measured using an RIA kit (BRAHMS) with a reference range of 0−60 U/mL.
Prognosis Prediction of Destructive Thyroiditis
The occurrence of hypothyroidism, defined as an elevated TSH level exceeding the upper limit of normal (> 4.0 µIU/mL), was set as the outcome measure, because the treatment strategy might be changed from symptomatic treatment to thyroxine replacement treatment (20). The time from the SPECT/CT to the occurrence of hypothyroidism was checked for prognosis prediction analysis.
Statistical Analyses
Student's t test was used for the group comparison, when assumption of equal variance was not rejected by the F-test. Otherwise, the non-parametric Mann-Whitney test was employed. Receiver-operating-characteristics analysis was performed to identify the cut-off vale for differentiation between the destructive thyroiditis and euthyroid. Pearson's correlation coefficient (r) was calculated. Cox's regression analysis was performed for the identification of prognosis predictors. Statistical software (version 12.4.0.0; MedCalc Software, bvba, Mariakerke, Belgium) was used throughout the study. A p value < 0.05 was considered statistically significant.
RESULTS
SPECT/CT Findings of Destructive Thyroiditis
In patients with destructive thyroiditis, reduced uptake of Tc-99m pertechnetate was always observed on SPECT/CT (Fig. 1). Using planar images, it was difficult to determine the contour of the thyroid. However, with the corresponding CT images from the SPECT/CT, the thyroid was well-demarcated and quantitative parameters were obtained through the CT-based thyroid segmentation process (Fig. 1) (16).
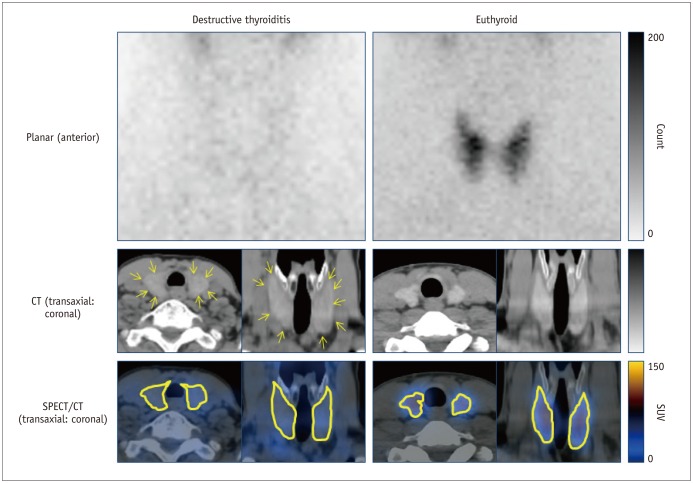
Fig. 1
SPECT/CT findings in patient with destructive thyroiditis (65-year-old female) compared with findings in euthyroid patient (32-year-old male).
Reduced uptake of Tc-99m pertechnetate was typical scintigraphic finding and thyroid contour was barely identifiable on planar scintigraphy in destructive thyroiditis patient. However, thyroid was readily visualized in corresponding CT (yellow arrows), enabling accurate segmentation for quantitative parameters. Upper row, planar anterior images; middle row, CT images of SPECT/CT (left, transaxial; right, coronal); and bottom row, SPECT/CT fusion images with thyroid contour being highlighted (left, transaxial; right, coronal). CT = computed tomography, SPECT/CT = single-photon emission computed tomography/CT, SUV = standardized uptake value
![]()
Quantitative Parameters of SPECT/CT
The quantitative parameters of the 35 destructive thyroiditis patients were compared with those of 20 euthyroid patients using the same scanner and protocol (16). Destructive thyroiditis patients had significantly lower %uptake (0.28 ± 0.19% vs. 0.78 ± 0.50%, p < 0.001) (Fig. 2A), SUVmean (6.67 ± 5.58 g/mL vs. 33.51 ± 23.54 g/mL, p < 0.001) (Fig. 2B), SUVmax (15.62 ± 14.86 g/mL vs. 45.56 ± 30.74 g/mL, p < 0.001) (Fig. 2C), and functional thyroid mass (163.78 ± 117.27 g vs. 692.00 ± 491.94 g, p < 0.001) (Fig. 2D) than the euthyroid patients. However, the thyroid volume was not significantly different between the thyroiditis (26.59 ± 10.31 mL) and euthyroid patients (21.71 ± 8.40 mL, p = 0.077).
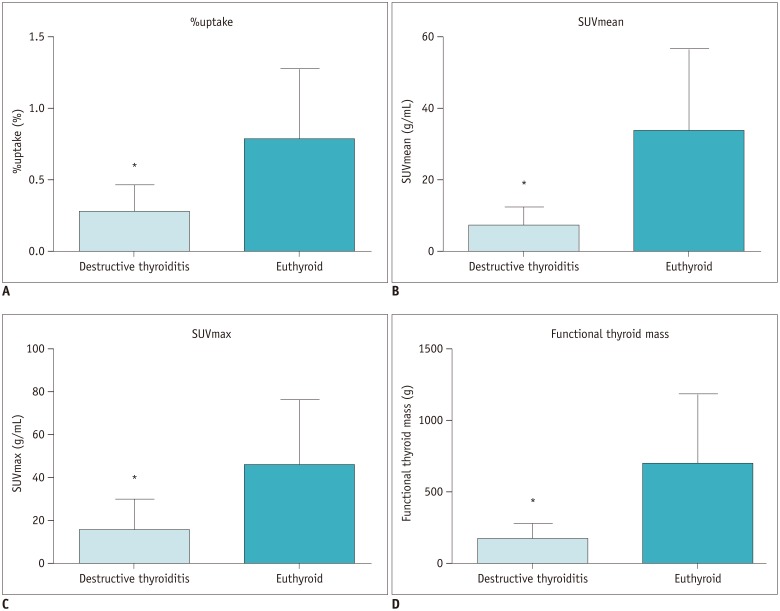
Fig. 2
Comparison of quantitative parameters between destructive thyroiditis (n = 35) and euthyroid patients (n = 20).
Patients with destructive thyroiditis had significantly lower %uptake (mean ± standard deviation: 0.28 ± 0.19%, range: 0.06 – 0.85%) (A), SUVmean (6.67 ± 5.58 g/mL, 0.97 – 27.41 g/mL) (B), SUVmax (15.62 ± 14.86 g/mL, 4.57 – 78.50 g/mL) (C), and functional thyroid mass (163.78 ± 117.27 g, 33.56 – 520.07 g) (D) than euthyroid patients (%uptake: 0.78 ± 0.50%, 0.22 – 1.87%; SUVmean: 33.51 ± 23.54 g/mL, 8.61 – 89.08 g/mL; SUVmax: 45.56 ± 30.74 g/mL, 13.55 – 115.80 g/mL; and functional thyroid mass: 692.00 ± 491.94 g, 149.97 – 1780.70 g). *p < 0.001.
![]()
The cut-off values for optimal differentiation between the thyroiditis and euthyroid patients were 0.54% for %uptake with sensitivity 94.3% and specificity 60.0%, 14.00 for SUVmean with sensitivity 91.4% and specificity 90.0%, 19.70 for SUVmax with sensitivity 77.1% and specificity 90.0%, and 294.24 for functional thyroid mass with sensitivity 91.4% and specificity 85.0%, respectively.
The area-under-the-curve (AUC) for each parameter was 0.846 for %uptake with 95% confidence interval (CI) of 0.724−0.929, 0.954 for SUVmean with 95% CI of 0.861−0.992, 0.867 for SUVmax with 95% CI of 0.748−0.944, and 0.931 for functional thyroid mass with 95% CI of 0.830−0.982 (Fig. 3). Therefore, the SUVmean cut-off of ≤ 14.00 was the most optimal cut-off value for identification of destructive thyroiditis with the sensitivity of 91.4% and specificity of 90.0%.
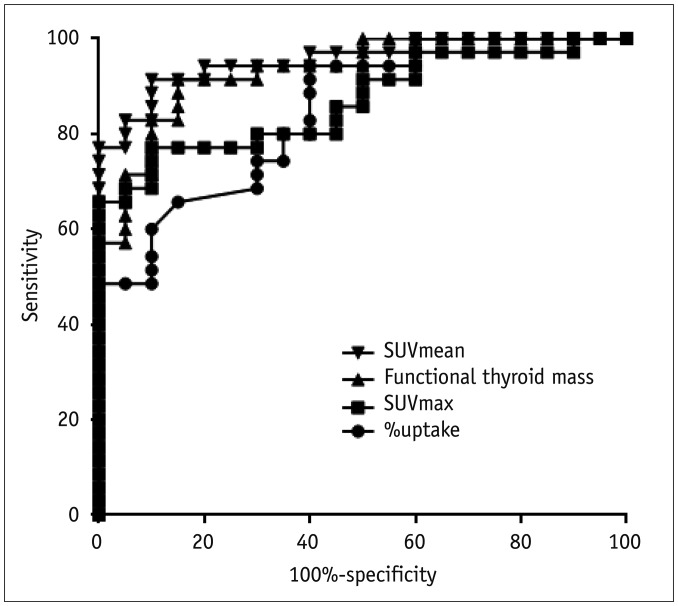
Fig. 3
Receiver-operating-characteristic curve analyses for differentiation of destructive thyroiditis patients from euthyroid patients
SUVmean had highest area-under-curve (0.954 with 95% CI of 0.861 – 0.992) compared to functional thyroid mass (0.931 with 95% CI of 0.830 – 0.982), SUVmax (0.867 with 95% CI of 0.748 – 0.944) and %uptake (0.846 with 95% CI of 0.724 – 0.929). CI = confidence interval
![]()
Thyroid/Background Ratio
The T/B ratio was significantly different between the destructive thyroiditis (1.83 ± 0.44) and euthyroidism (3.39 ± 1.41) (p < 0.001) (Supplementary Fig. 1B in the online-only Data Supplement). However, the ratio was not superior to the SUVmean in terms of identification of the destructive thyroiditis (AUC for SUVmean 0.954 with 95% CI of 0.861–0.992 vs. AUC for T/B ratio 0.924 with 95% CI of 0.820–0.978, p = 0.450) (Supplementary Fig. 1C in the online-only Data Supplement).
Correlations of Quantitative Parameters with Thyroid Hormone Levels
SPECT/CT parameters were compared with thyroid hormone levels for the possible correlations. T3 and free T4 did not correlate with any SPECT/CT parameters (Table 2). Only TSH was positively correlated with %uptake (p = 0.004), SUVmean (p < 0.001), SUVmax (p = 0.002), and functional thyroid mass (p < 0.001) (Table 2, Fig. 4).
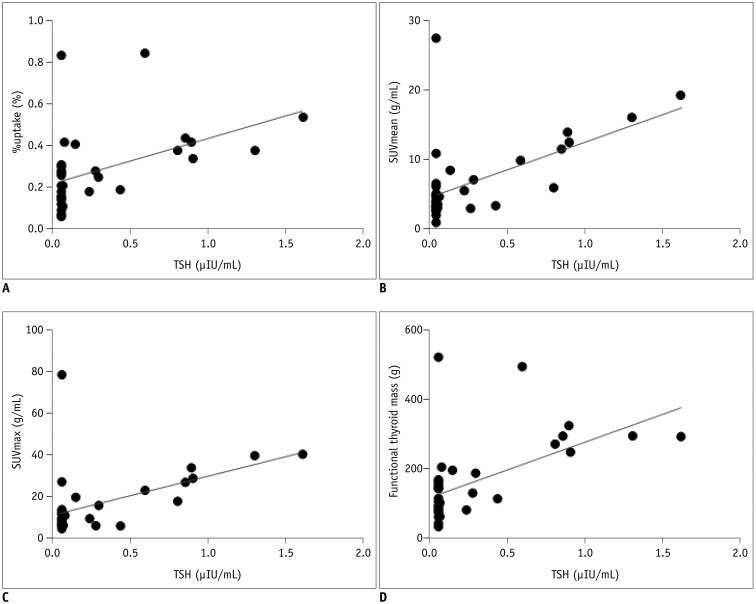
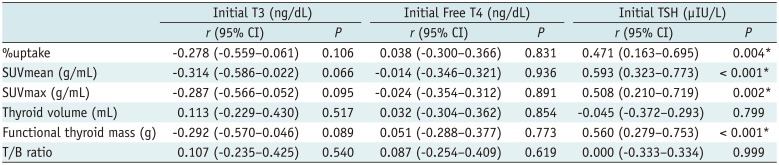
Fig. 4
Correlations between TSH level and SPECT/CT parameters.
TSH correlated with %uptake (p = 0.004) (A), SUVmean (p < 0.001) (B), SUVmax (p = 0.002) (C), and functional thyroid mass (p < 0.001) (D). In 20 cases with undetectable TSH (levels under detection limit of 0.05 µIU/mL), lower detection limit value of 0.05 µIU/mL was used for analyses. TSH = thyroid-stimulating hormone
![]()
Table 2
Correlation Analyses between SPECT/CT Parameters and Thyroid Hormone Levels
![]()
Prediction of Hypothyroidism
The mean follow-up period of the total 35 patients was 124.7 ± 89.1 days (range: 32−478 days) from the SPECT/CT. Of the 35 patients, 16 experienced hypothyroidism, with a follow-up period of 88.6 ± 46.4 days (range: 46−238 days), whereas 19 patients achieved euthyroidism, but did not progress to hypothyroidism during the follow-up period of 155.1 ± 105.2 days (range: 32−478 days). Of the 16 patients in which hypothyroidism occurred later, 14 were hypothyroid without an interim euthyroid state having been noted, and 2 were initially found to be euthyroid followed by progression to hypothyroidism. The thyroid hormone levels at the time of censoring (hypothyroidism occurrence in 16 patients vs. euthyroidism maintenance until the last follow-up in 19 patients) were significantly different between the 2 groups: free T4 (0.97 ± 0.31 vs. 1.26 ± 0.17, p = 0.002), T3 (116.3 ± 12.3 vs. 133.4 ± 16.8, p = 0.002), and TSH (18.24 ± 30.43 vs. 1.72 ± 0.89, p < 0.001) for hypothyroidism and euthyroidism, respectively. Of the 16 hypothyroid patients, 10 commenced to receive thyroxine replacement treatments after hypothyroidism was noted.
There were more females among the 16 hypothyroid patients (p = 0.022). They were initially more thyrotoxic (significantly higher free T4, p = 0.004, and T3, p = 0.006, and marginally significantly lower TSH, p = 0.063) (Table 3). On the other hand, all the auto-antibodies and SPECT/CT quantitative parameters were not significantly different between progression-to-hypothyroidism patients and remained-in-euthyroid patients (Table 3).
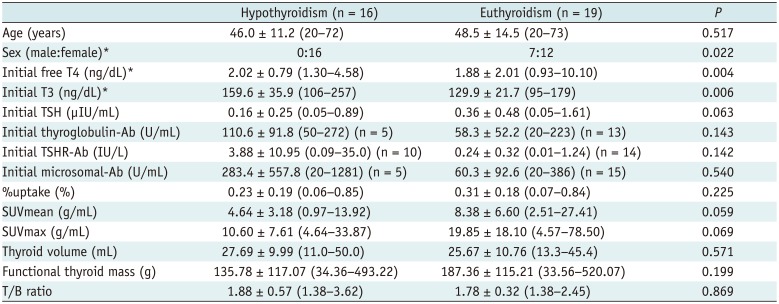
Table 3
Characteristics of Patients Who Progressed to Hypothyroidism Versus Patients Who Remained Euthyroidism
![]()
Cox's regression analyses were performed to identify significant predictors of prognosis (progression to hypothyroidism) of destructive thyroiditis. The initial T3 level was determined to be the sole significant predictor of prognosis in both univariate and multivariate analyses (p = 0.002, exp(β) = 1.022, 95% CI: 1.008−1.035) (Table 4). A higher initial T3 level was associated with the greater likelihood of progression to hypothyroidism during the follow-up period.
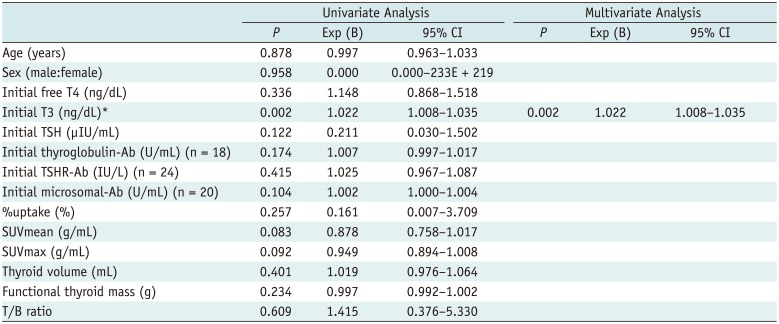
Table 4
Cox's Regression Analysis for Progression to Hypothyroidism
![]()
DISCUSSION
The traditional concept that PET alone, but not SPECT, is quantitative is changing. The hybrid SPECT/CT scanner has emerged as a truly quantitative imaging tool (1213). To date, Tc-99m labeled phosphonates (1415) and Tc-99m pertechnetate (1617) have been tested for the calculation of the %uptake or SUV using the quantitative SPECT/CT approach. The results were a surprising acknowledgement of the quantitative capacity of SPECT/CT (151617). Presently, destructive thyroiditis was clearly discriminated from a euthyroid state by means of quantitative SPECT/CT (Figs. 1, 2). Previously, Tc-99m pertechnetate uptake had only been employed to differentiate destructive thyroiditis from Graves' disease, but not from a euthyroid state (41011). In fact, the distinction of thyroiditis from Graves' disease is not a difficult task, because of the extreme natures of these 2 functional thyroid diseases (i.e., suppressed function due to glandular destruction versus exaggerated function due to enhanced hormonal production). Furthermore, the reference range of the SPECT/CT parameter in euthyroid patients (i.e., 0.78 ± 0.50% for %uptake) was markedly lower and narrower than in other reports (1−7%) using a traditional thyroid uptake system (11). The additional uptake of Tc-99m pertechnetate in salivary glands and oral cavity saliva was attributed to the overestimated %uptake using the thyroid uptake system (16). In the current study, destructive thyroiditis patients were differentiated from euthyroid patients using such a strict reference range for the quantitative parameter. Therefore, this study clearly demonstrates that hyper- and hypofunction of the thyroid can be readily identified in an objective manner, due to the robustness of quantitative SPECT/CT.
The correlations between the parameters of quantitative SPECT/CT and TSH may be explained by the TSH-dependent expression of sodium-iodide symporter (NIS). Tc-99m pertechnetate enters into thyroid cells via NIS (212223). Suppressed TSH levels can indicate thyroid hormone excess in the circulation and reduced expression of NIS in the thyroid (112425). Therefore, the quantitative parameters of Tc-99m pertechnetate SPECT/CT may be useful for assessment of TSH activity on NIS in destructive thyroiditis patients.
Destructive thyroiditis progresses, in a typical scenario, from initial thyrotoxicosis to interim hypothyroidism, and then to final recovery (12). However, up to 30% of destructive thyroiditis patients ultimately deteriorate to chronic hypothyroidism, requiring long-term thyroxine replacement treatment (12). The degree of thyroid gland destruction will undoubtedly affect the outcome of destructive thyroiditis. However, no indicator has proven to be useful for the prediction of prognosis of destructive thyroiditis. Presently, the T3 level at the time of initial presentation was strongly associated with later occurrence of hypothyroidism, defined as an elevated level of TSH. No other biochemical parameters or novel SPECT/CT parameters were related with the development of the hypothyroidism during the follow-up period. Even within the normal reference range, the initial T3 level seemed to be a prognostic indicator of destructive thyroiditis. T3 is the main player of thyroid hormonal homeostasis and has a stronger potency than T4 (26). In the normal state, the major source of T3 in the blood is peripheral de-iodination of T4, while a minor source is the thyroid itself (2728). In destructive thyroiditis, the elevated T4 levels usually decline to a normal range within 1 month, whereas the relatively elevated T3 levels are maintained for several months (29). Accordingly, it can be assumed that persistent release of T3 from the thyroid contributes to the blood T3 level in case of destructive thyroiditis, reflecting the degree of thyroid destruction and subsequently the prognosis. During the thyroid destruction process, the excessively released T4 would inhibit peripheral conversion of T4 to T3 (peripheral autoregulation) (30). The T3/T4 ratio is usually lower in destructive thyroiditis than in Graves' disease, because of the autoregulation mechanism (31), which was recapitulated in the current destructive thyroiditis patients: the free T4 level was increased above the upper normal limit, but T3 was within the normal reference range at initial presentation. The fact that the T3 was within the normal range may reflect the balance between the decreased input from the peripheral de-iodination inhibition and the sustained input from the thyroid that is being destroyed. It remains unclear why elevated free T4 was not a competent predictor of hypothyroidism occurrence. However, it is of note that we measured the small fraction of the total T4 (-5%) that is unbound to serum protein, i.e., free T4. Even though the free T4 reflects the metabolically active proportion of total T4, the degree of thyroid gland destruction may be more efficiently represented by the total T4 rather than by free T4. This requires further investigation.
The fact that SPECT/CT parameters were not associated with the prognosis of destructive thyroiditis can be explained by the absence of correlation of these parameters with T3, but the presence of correlation only with TSH. Actually, in destructive thyroiditis, the degree of thyroid hormone release may not be linearly reflected by the TSH level, because TSH is too sensitive to small changes in thyroid hormones (3233). It has been reported that TSH responsiveness to thyrotropin-releasing hormone (TRH) stimulation may be a better indicator of thyroid dysfunction in destructive thyroiditis than the absolute level of TSH. An exaggerated TSH response after TRH administration may indicate impaired thyroid function reserve, leading to the permanent hypothyroidism of destructive thyroiditis (29).
Another reason for the poor ability of the quantitative parameters to predict the prognosis of destructive thyroiditis may lie in the heterogeneous disease stages of the patients at the time of presentation to the clinicians, and subsequently to the SPECT/CT studies. The time span of thyroid gland destruction and recovery during destructive thyroiditis is only several months from the disease onset (12). Not all patients might visit the clinicians at the peak stage of thyroid gland destruction, and the time of SPECT/CT acquisition might also miss the critical time point.
The occurrence of the first hypothyroidism may not be the optimal outcome measure for assessing the prognosis of destructive thyroiditis. Permanent hypothyroidism requiring longer-term treatment with thyroxine would be an adequate end-point. However, it is difficult to define how long duration of thyroxine application is crucial for the permanent hypothyroidism. Furthermore, the natural course of destructive thyroiditis, free from the thyroxine replacement, is difficult to determine once the TSH level has increased and thyroxine treatment had started. In this regard, the first occurrence of hypothyroidism may be useful as an outcome measure in this type of retrospective study.
In conclusion, quantitative SPECT/CT using Tc-99m pertechnetate is useful for disease characterization of destructive thyroiditis, because the quantitative parameters can differentiate destructive thyroiditis from euthyroid patients. However, the disease progression of destructive thyroiditis into hypothyroidism could not be predicted using these quantitative parameters, due to the strong correlation of the parameters with TSH, but not with T3, which is the sole prognosis predictor of destructive thyroiditis.
 XML Download