

 PDF
PDF ePub
ePub Citation
 Print
Print


INTRODUCTION
MATERIALS AND METHODS
Participants
Table 1
Demographic, Neuropsychological and Clinical Data
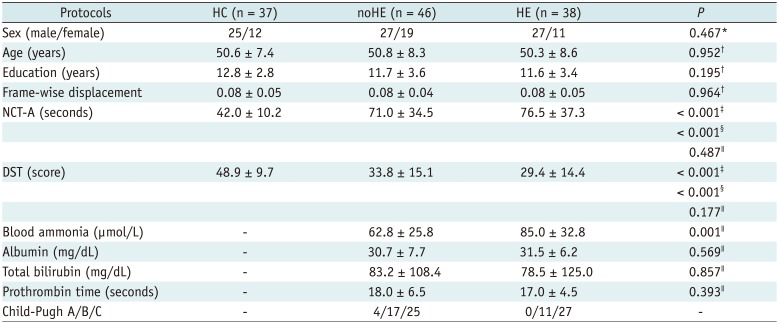
Data are presented as mean ± standard deviation. *Pearson χ2 test of three groups (two-tailed), †One-way analysis of variance test among three groups (two-tailed), ‡Two-sample t test between noHE and HC groups (two-tailed), §Two-sample t test between HE and HC groups (two-tailed), ∥Two-sample t test between HE and noHE groups (two-tailed). DST = digit-symbol test, HC = healthy control, HE = cirrhotic patients with clinical hepatic encephalopathy, NCT-A = number connection test of type A, noHE = cirrhotic patients without clinical hepatic encephalopathy
![]()
MRI Data Collection
Data Preprocessing
Individual and Group ReHo Analysis in Separate Frequency Bands
Associations of Frequency-Specific ReHo Abnormality with Neuropsychological Performance and Blood Ammonia Level
Multi-Voxel Pattern Classification Analysis Based on Frequency-Specific ReHo Features
RESULTS
Frequency-Specific Group ReHo Differences
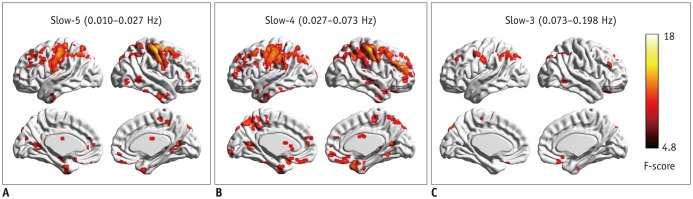 | Fig. 1Regional homogeneity change pattern across frequency bands.
A. One-way ANCOVA result in slow-5 frequency band. B. One-way ANCOVA result in slow-4 frequency band. C. One-way ANCOVA result in slow-3 frequency band. ANCOVA = analysis of covariance
|
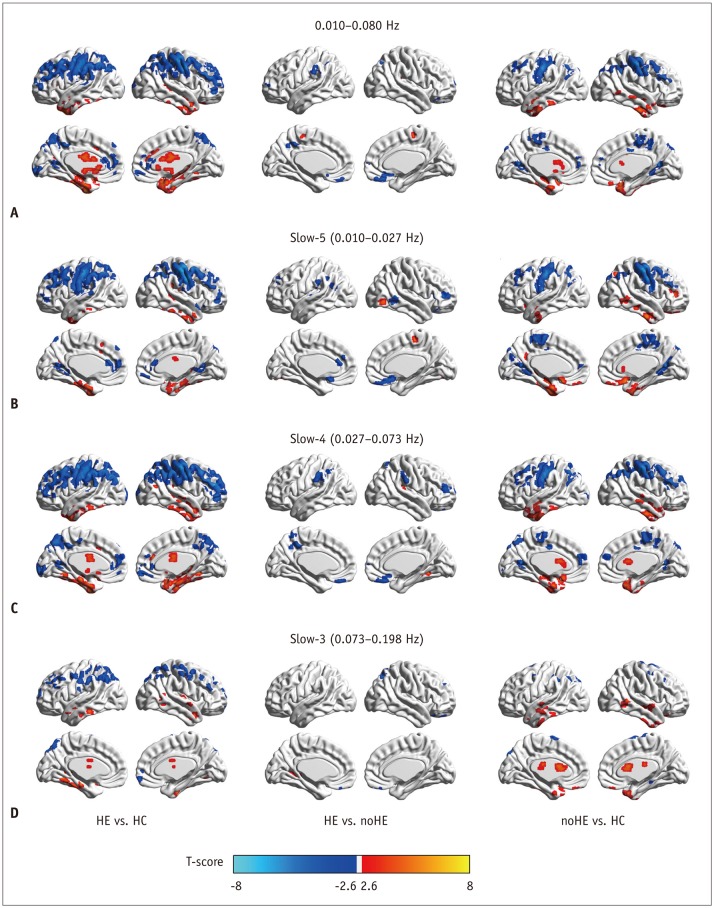 | Fig. 2Between-group regional homogeneity differences in routine analysis and in sub-frequency band analysis.
A. Two-sample t test result in 0.010−0.080 Hz. B. Two-sample t test result in slow-5 frequency band. C. Two-sample t test result in slow-4 frequency band. D. Two-sample t test result in slow-3 frequency band. HC = healthy control, HE = cirrhotic patients with clinical hepatic encephalopathy, noHE = cirrhotic patients without clinical hepatic encephalopathy
|
Table 2
Regions Showing Significant Group Changes in Regional Homogeneity in Slow-5, Slow-4, and Slow-3 Frequency Bands (AlphaSim Corrected, Overall p < 0.05)
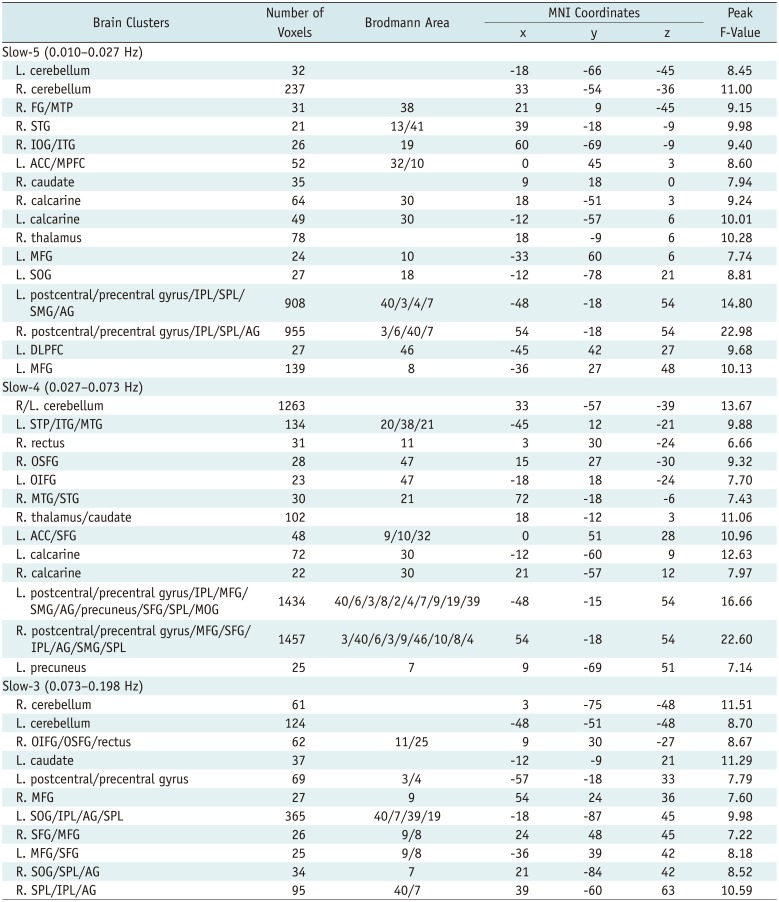
ACC = anterior cingulate cortex, AG = angular gyrus, DLPFC = dorsal lateral prefrontal gyrus, FG = fusiform gyrus, IOG = inferior occipital gyrus, IPL = inferior parietal lobe, ITG = inferior temporal gyrus, L = left side, MFG = middle frontal gyrus, MNI = Montreal Neurological Institute, MOG = middle occipital gyrus, MPFC = medial prefrontal cortex, MTG = middle temporal gyrus, MTP = middle temporal pole, OIFG = orbital inferior frontal gyrus, OSFG = orbital superior frontal gyrus, R = right side, SFG = superior frontal gyrus, SMG = supramarginal gyrus, SOG = superior occipital gyrus, SPL = superior parietal lobe, STG = superior temporal gyrus, STP = superior temporal pole
![]()
Correlation Results of Frequency-Specific ReHo Abnormality with Neuropsychological Performance and Ammonia Level
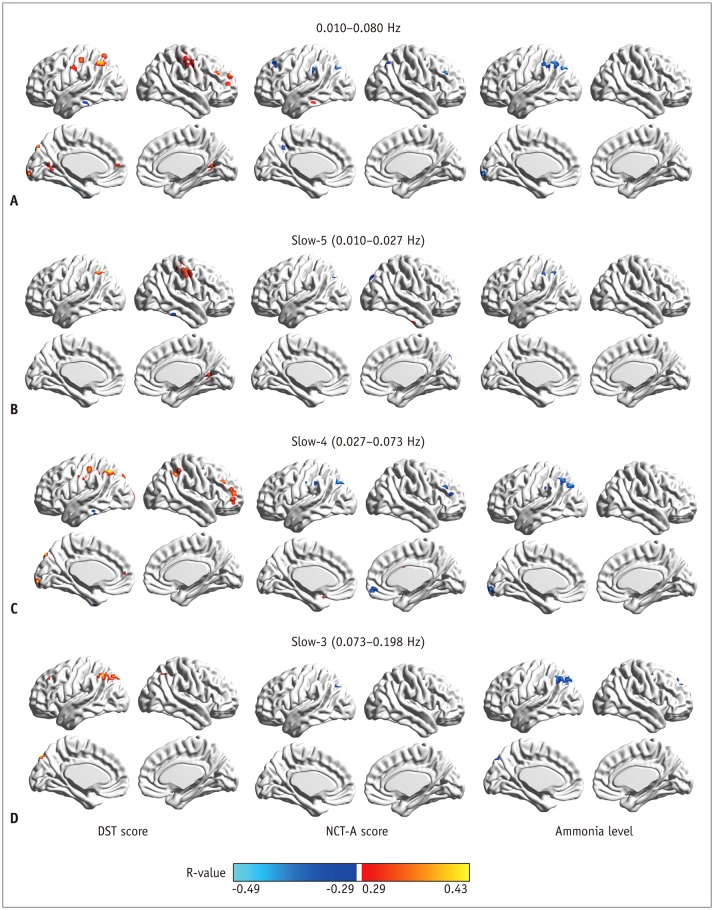 | Fig. 3Correlation of regional homogeneity values in group-difference regions with DST, NCT-A scores, and blood ammonia level.
A. Correlation map in 0.010−0.080 Hz. B. Correlation map in slow-5 band. C. Correlation map in slow-4 band. D. Correlation map in slow-3 band. DST = digit-symbol test, NCT-A = number connection test of type A
|
Pattern Classification Results Based on Frequency-Specific ReHo Features
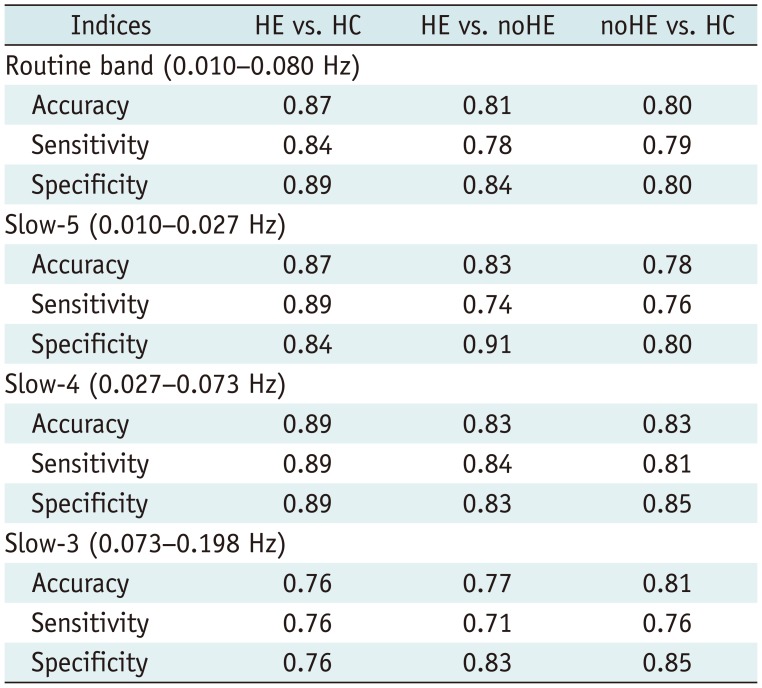
Table 3
Accuracy, Sensitivity, and Specificity of Pattern Classification Analysis Using between-Group Regional Homogeneity Difference Features in Different Frequency Bands
![]()
 XML Download