

 PDF
PDF ePub
ePub Citation
 Print
Print


INTRODUCTION
Subacromial impingement is categorized as variable forms ranging from inflammation to degeneration of the bursa and rotator cuff (RC) tendon tears in the subacromial space (1). Neer (2) suggested that the mechanism of RC pathology involves extrinsic compression of the RC tendon and narrowing of the subacromial space. The subacromial space is the interval between the superior portion of the humeral head, coracoacromial arch, and the under surface of the anterior acromion and contains the supraspinatus tendon, subacromial bursa, long head of biceps brachii tendon, and the capsule of the shoulder joint (3). The acromiohumeral distance (AHD) has been studied to quantify the subacromial space using various modalities. Several studies have suggested that a decreased AHD is associated with a RC tear and a poor outcome after repair (45). Furthermore, an AHD of less than 7 mm measured on an anterior-posterior (AP) plain radiograph indicates cuff arthropathy and is a predictor of poor surgical outcomes (67).
Tomosynthesis is a new diagnostic tool that acquires a series of projection images over a limited angular range and allows the reconstruction of an arbitrary number of two-dimensional image slices through a three-dimensional volume. Compared with conventional plain radiography, tomosynthesis has been shown to have a higher sensitivity for lesion detection in a large number of studies, especially in chest and breast imaging (8910). Several studies have demonstrated the potential benefits of tomosynthesis for musculoskeletal applications, including, in the detection of bone erosion of the hands and feet in rheumatoid arthritis, detection of small fractures, and metallic implant imaging (1112131415). To our knowledge, the potential role of tomosynthesis for shoulder joint imaging and the benefit of tomosynthesis for evaluating the AHD in subacromial impingement have not been investigated.
In plain radiography, various structures are overlapped; whereas tomosynthesis obtains three-dimensional volume images to separate bony structures. Therefore, we hypothesized that tomosynthesis better correlates with RC pathology more than other modalities.
The study was designed to compare the AHD values derived from plain radiography, tomosynthesis, and computed tomography (CT) or magnetic resonance (MR) arthrography in order to examine the correlation between the tomosynthetic AHD and RC tears and to estimate the diagnostic reproducibility of tomosynthesis for evaluating subacromial impingement. In addition, we evaluated the associations between various anatomical indices and AHD.
Go to : 
MATERIALS AND METHODS
Patients
This retrospective study was approved by our Institutional Review Board, which waived the requirement for informed consent due to this study's retrospective nature. We searched the medical records of a tertiary hospital for clinically suspected subacromial impingement between November 2012 and May 2013; of those patients, 125 were enrolled in the study. Sixty-three patients (31 men, 32 women) were diagnosed with subacromial impingement on the basis of the following inclusion criteria: arthroscopic RC repair and preoperative plain radiography, tomosynthesis, and CT or MR arthrography of the most symptomatic shoulder within 1 month. The left shoulder was affected in 28 patients. Subacromial impingement was clinically diagnosed by an orthopedic specialist and was defined as pain that persisted for more than 6 months without response to conservative treatment. The physical examination of subacromial impingement was positive in the entire study population.
Of the 62 excluded patients, four had a history of inflammatory joint disease. Twenty-five had a clinical history of shoulder surgery. Two patients had primary adhesive capsulitis which was characterized by the functional restriction of active and passive shoulder motion without evidence of osteopenia or calcific tendinitis on plain radiographs (16). Seventeen patients had a primary diagnosis of shoulder instability. Five had localized pain with direct compression of the acromio-clavicular joint that was suggestive of acromio-clavicular joint degeneration (17181920). Nine were excluded because of the absence of CT or MR arthrography (n = 8) or postoperative re-tear (n = 1). We reviewed each patient's electronic medical record for demographic data, including height and weight.
Plain Radiography
A digital radiographic (DR) examination (Discovery XR656; GE Healthcare, Milwaukee, WI, USA) that included anteroposterior (AP) and scapular Y views of the shoulder was performed separately for each patient while in a supine position. A DR system was used for indirect conversion with a flat-panel detector (cesium iodide). The maximum detector size was 40.4 × 40.4 cm; the active matrix was 2022 × 2022 pixels and the pixel pitch was 200 microns. A standard AP view was obtained while the patient was standing with the posterior part of the shoulder touching the X-ray film cassette and the patient's arms were along the trunk in an external rotation with the palms facing upwards (21). This system can be used for both conventional radiographic imaging and tomosynthesis imaging. The scout image was a shoulder AP projection image, which was collected using automatic exposure control (AEC). The tube voltage was 70 kV, and a total filtration of 2.7 mm Al was used. All radiographs were collected using AEC and an antiscatter grid (grid ratio 10:1, strip density 70 lines/cm). The tube current-exposure time product was 25 mAs, and the mean total dose at the skin was 0.42 mGy per patient. This skin dose was estimated from the dose calculated by the device using a mathematic method reported by Okkalides and Fotakis (22).
Tomosynthesis
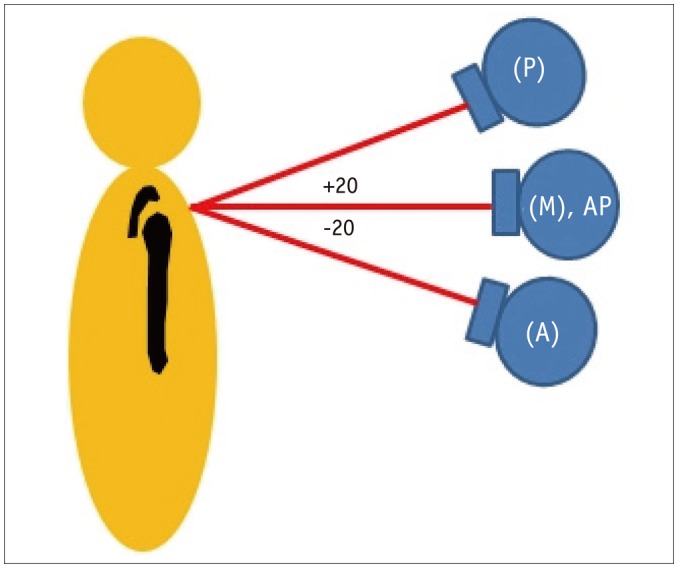
The present study was based on shoulder tomosynthesis examinations performed in an X-ray room that had equipment for tomosynthesis (Discovery XR656 with VolumeRAD option; GE Healthcare). The tomosynthesis examination was performed with the patient standing against the wall stand, and the source-to-image distance was 150 cm for the central projection. Tomosynthesis was obtained in the same position that was used in plain radiography. The examinations were performed using a tube voltage of 70 kV, a total filtration of 2.7 mm Al, and an antiscatter grid (grid ratio 10:1, strip density 70 lines/cm). The dose ratio was 5:1. The low-dose projection images were collected with a minimum of 1.6 mAs per projection. During the AP shoulder tomosynthesis examination, the X-ray tube was moved in a continuous sweeping motion along a straight line in the caudo-cranial direction. With an angular movement between −20° to +20°, a mean of 23.3 low-dose projection radiographs (range: 14–54 images depending on patient size) were acquired with a fixed detector position (23). The reconstructions were 2 mm thick. The effective doses from the shoulder examinations were calculated individually for each patient included in the study. The registered dose-area product, field size, and tube angle were obtained from the Digital Imaging and Communications in Medicine header of each projection radiograph. These data, together with information on the individual patient's height and weight, were used in the Monte Carlo program PCXMC 2.0 (STUK-Radiation and Nuclear Safety Authority, Helsinki, Finland) (2425) to calculate the effective dose for each projection radiography. The mean total effective dose for the entire examination (including scout and tomosynthesis acquisition for shoulder) was 0.32 mSv per patient.
CT and MR Arthrography
A CT arthrography was performed in 16 patients using a 16-MDCT scanner (Sensation 16; Siemens, Erlangen, Germany). All patients underwent CT arthrography after an injection of approximately 12 mL (range, 10–15 mL) of contrast mixture (13 mL iopromide [Ultravist 370; Bayer AG, Berlin, Germany] and 7 mL normal saline). The patient was positioned supine with the thumb pointing upward. The conditions were a kilovoltage setting of 120 kV, an effective tube current-time product of 150 mAs, CT dose index volume of 11.61 ± 4.58 mGy, and dose-length product of 163.16 ± 86.00 mGy·cm which were automatically produced by the CT vendor as the dose report.
A MR arthrography was performed in 47 patients using a 3T system with a dedicated shoulder coil (Achieva TX; Philips Healthcare, Best, The Netherlands). All patients underwent MR arthrography after an injection of approximately 12 mL (range, 10–15 mL) of gadobutrol (Gadovist; Bayer AG) solution at a concentration of 2 mmol/L. The patients were examined in the supine position with their arm at the side, palm facing up, and hand under their hip to keep the shoulder motionless. The following sequences were acquired: T1-weighted spin-echo images in the coronal oblique plane with fat suppression (repetition time/echo time = 583/10 ms; slice thickness, 4 mm; field of view, 150 × 150 mm; matrix size, 340 × 265) and in the sagittal oblique plane (583/10; slice thickness 4 mm; field of view, 150 × 150 mm; matrix size, 340 × 265); T2-weighted spin-echo images in the coronal oblique plane (2668/80 ms; slice thickness 4 mm; field of view, 150 × 150 mm; matrix size, 340 × 258) and sagittal oblique plane (2668/80 ms; slice thickness, 4 mm; field of view, 150 × 150 mm; matrix size, 340 × 258). The intersection gaps were set at 0.4 mm, respectively.
Image Analyses
Two musculoskeletal radiologists independently evaluated the AHD on AP plain radiography, tomosynthesis, and CT or MR arthrography. Each reader measured the AHD three times at 3- to 4-week intervals to avoid recall bias. Both readers were blinded to the radiologic reports, clinical information, and surgical results. The AHD was measured as the shortest distance from the inferior surface of the acromion to the superior cortex of the humerus (26). The first line was drawn through the undersurface of the acromion, and the second line was drawn parallel to the first line and contacted the superior cortex of the humeral head. The distance between the two lines was recorded as the AHD. Three groups were stratified according to the AHD on AP plain radiographs as follows: group 1, 7 mm or less; group 2, 8–10 mm; and group 3, greater than 10 mm (4).
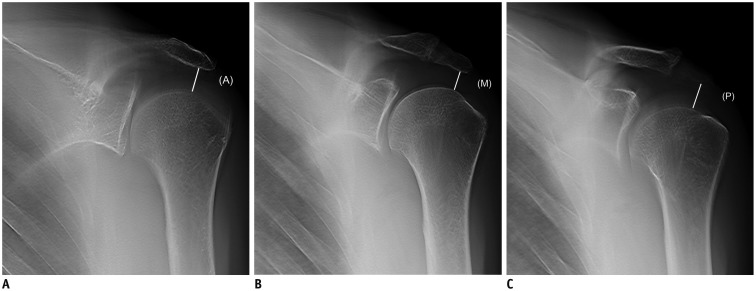
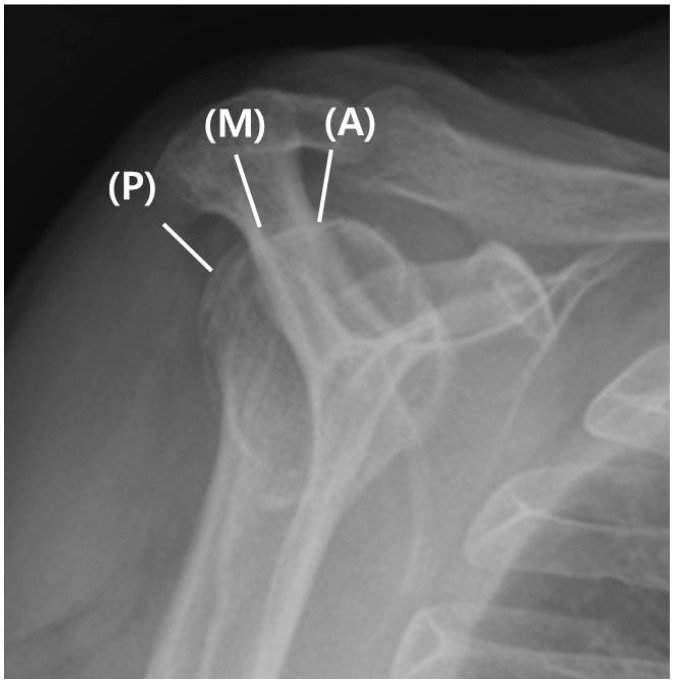
The tomosynthetic AHDs were divided into three compartments: anterior, middle, and posterior (Figs. 1, 2). The anterior AHD was defined as the first point with a clear margin of the inferior surface of the acromion. The middle AHD was measured on the acromio-clavicular joint level which displayed the clear margin of articulation with the shortest distance from the inferior surface of the acromion to the superior cortex of the humerus. The posterior AHD was defined as the last point with a clear margin of the inferior surface of the acromion. Figure 3 provides the X-ray tube position according to the plain radiography and tomosynthesis.
The CT or MR arthrographic AHDs were also divided into three compartments as with the tomosynthetic AHD. The reformatted oblique sagittal CT image or T2-weighted oblique sagittal image was chosen for the measurement. We measured the distances from the undersurface of the acromion at the point directly above the head of the humerus to the center and the top of the humeral head (4). On the MR images, the intermediate signal intensity cartilage of the humeral head was not included in the measurements (26).
To adjust for patient size, one reader measured the humeral head diameter, glenoid height, and glenoid width on the AP plain radiographs three times. The humeral head diameter was defined as the diameter of the humeral head at the level of the anatomical neck, which was used to estimate the anatomic index in the shoulder arthroplasty (27). The glenoid height was defined as the distance from the most superior to the most inferior point on the glenoid (27). The glenoid width was defined as the distance from the most anterior to the most posterior point on the glenoid (27).
For a reference standard, a single orthopedic surgeon with 11 years of experience reviewed each patient's arthroscopic operation record. The RC tears were divided into four groups according to the involved tendon location: isolated supraspinatus, supra-plus-infra-spinatus, supraspinatus-plus-subscapularis, or all RC tendons. The size of the RC tear was estimated during surgery and was given in square centimeters (sagittal × coronal extension). The type of RC tear was distinguished according to the Snyder classification (full-thickness tear; small, medium, large, and massive) (28) and the Ellman classification (partial-thickness tear; articular, bursal, and intratendinous) (29).
Statistical Analyses
An independent t test was used to compare the mean AHDs among the three modalities. Quantitative data were expressed as the mean ± standard deviation (SD). The Pearson correlation coefficient was used to test the association between the tear size and variable anatomic indices and the AHD on plain radiography, tomosynthesis, CT or MR arthrography obtained by two readers. A two-way ANOVA was used to determine whether there were significant differences in AHD according to group and size or type of RC tear. The relationships between the results of the AHD on plain radiography, tomosynthesis, and CT or MR arthrography were assessed by using Spearman correlation coefficients. The intraobserver and interobserver agreement for each imaging method was assessed using the intraclass correlation coefficient (ICC) and the lower limit of its 95% confidence interval. To assess the diagnostic efficacy of the imaging technique, the mean AHD value for the two readers on each modality was used.
Results were considered significant when a p value of less than 0.05 was obtained. All calculations were performed with the Statistical Package for the Social Sciences (SPSS) version 21.0 software (IBM Corp., Armonk, NY, USA).
Go to :
RESULTS
A total of 63 consecutive patients (31 men, 32 women) with a mean age of 60.0 ± 8.0 years (overall range: 40–72 years; male 58.6 ± 1.4 years [range: 40–72 years], female 61.5 ± 1.2 years [range: 42–72 years]) were included in the analyses. The majority of the AHD values determined by plain radiography and tomosynthesis were higher than the values determined by CT or MR arthrography. Table 1 displays the mean and SD of the AHD on AP plain radiographs in each group. The distribution of patients according to the AHD group on the plain radiographs was as follows: group 1 (n = 8), group 2 (n = 38), and group 3 (n = 17). The categorization of the patients according to RC pathology observed during arthroscopy was as follows: normal tendon (n = 6, 9.5%), articular side partial thickness tear (n = 4, 6.3%), bursal side partial thickness tear (n = 11, 17.5%), intratendinous partial thickness tear (n = 0), and full thickness tear (n = 42, 66.7%). The full thickness tear group consisted of small (n = 0), medium (n = 29), large (n = 5), and massive (n = 8) tears. Table 2 provides the descriptive data according to the plain radiographic AHD on the three modalities.
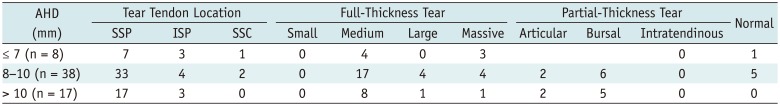
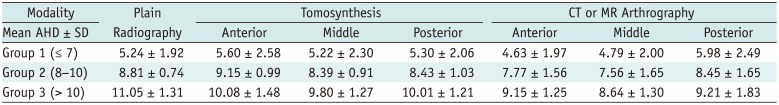
Table 1
Number of Patients according to Location, Size, and Types of Tears of Rotator Cuff in Each Group
![]()
Table 2
Descriptive Statistics according to AHD on Each Modality
![]()
Correlation between the Size of Rotator Cuff Tear and AHD
Table 3 provides the correlation between the tear size and AHD on the plain radiography, tomosynthesis, and CT or MR arthrography. A significant inverse correlation was observed between the tear size and posterior tomosynthetic AHD (Pearson correlation coefficient = -0.312, p = 0.047) and all AHDs on CT or MR arthrography (p < 0.001). No significant association was found between the tear size and plain radiographic AHD (p = 0.169).
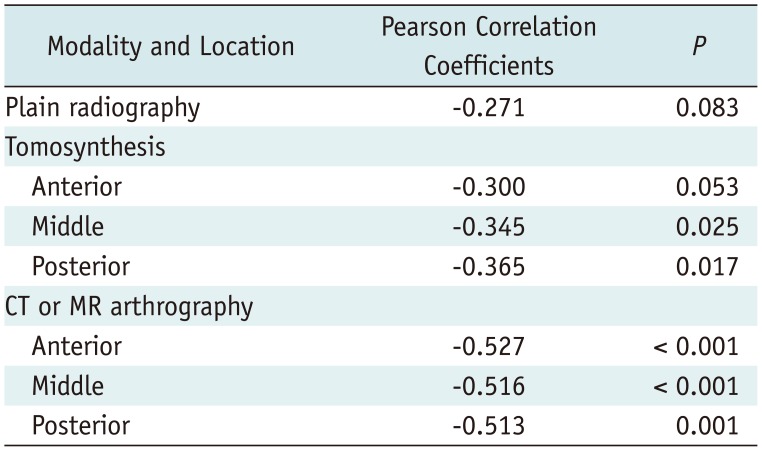
Table 3
Statistical Significance between Tear Size and AHD on Each Modality
![]()
Correlation between Type of Rotator Cuff Tear and AHD
There was no significant association between the tear type and plain radiographic AHD (p = 0.111) or tomosynthetic AHD (anterior, p = 0.187; middle, p = 0.161; posterior, p = 0.213) according to a Pearson correlation analysis.
The results of a linear regression analysis demonstrated a significant relationship between the tear type and middle tomosynthetic AHD (r = 0.345, p = 0.025) or posterior tomosynthetic AHD (r = 0.365, p = 0.017).
Correlation between Anatomical Indices and AHD
The humeral head diameter and glenoid height had a significant positive correlation with patient height and weight. No statistically significant correlation was observed between the humeral head diameter and the size or type of RC tear.
Inter-Modality Correlation between Three Modalities and AHD
A moderate correlation was found between the plain radiographic AHD and anterior tomosynthetic AHD (r = 0.433, p < 0.001). A strong correlation was found between the plain radiographic AHD and middle (r = 0.714, p < 0.001) and posterior tomosynthetic AHDs (r = 0.754, p < 0.001). A moderate correlation was found between the plain radiographic AHD and anterior (r = 0.591, p < 0.001), middle (r = 0.503, p < 0.001), and posterior (r = 0.401, p < 0.001) CT or MR arthrographic AHDs.
The interobserver and intraobserver agreement for the AHD was excellent on the radiography (ICC = 0.966–0.988, 0.935–0.976), tomosynthesis (ICC = 0.947–0.983, 0.975–0.987), and CT or MR arthrography (ICC = 0.896–0.928, 0.974–0.982). The comparisons of the interobserver and intraobserver variabilities for AHD are summarized in Tables 4 and 5.
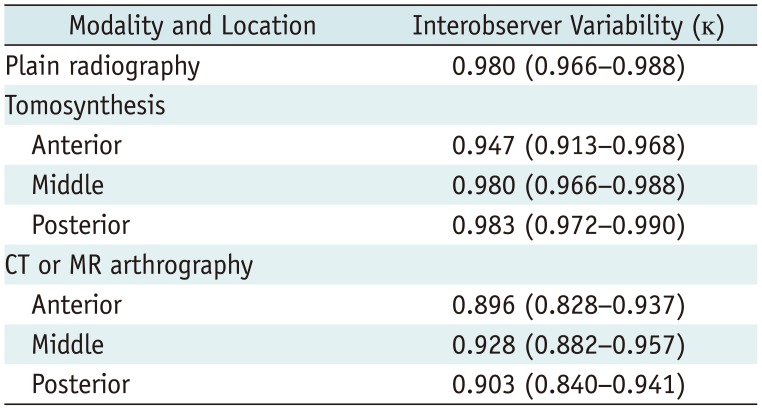
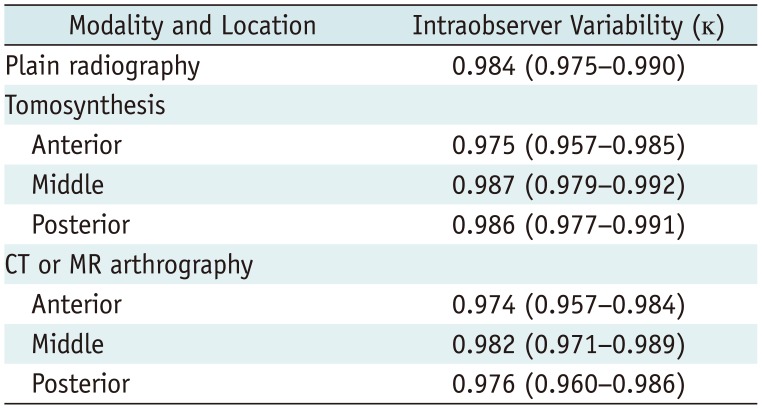
Table 4
Comparison of Interobserver Variability for AHD on Each Modality
![]()
Table 5
Comparison of Intraobserver Variability for AHD on Each Modality
![]()
Go to :
DISCUSSION
Radiographic features such as the subchondral bone change of greater tuberosity, shape of acromion, degeneration of acromioclavicular joint, and narrowing of the AHD have been reported in patients with subacromial impingement (4618203031).
Previous studies suggest that the narrowing of the AHD is associated with the proximal migration of the humeral head, which indicates fatty degeneration of the RC (732). Gruber et al. (21) demonstrated excellent intra- and interobserver reliabilities in the assessment of the AHD using standardized AP radiographs. Saupe et al. (4) evaluated 63 shoulders in the age- and sex-matched patient groups according to the AHD on plain radiographs using MR arthrography as the reference standard. They found that the size of the RC tear and degree of fatty degeneration of the infraspinatus muscle correlated well with a reduced AHD. However, Pearsall et al. (18) compared the radiographic findings and RC tears for 40 shoulders with a RC tear with 84 asymptomatic age-matched controls and found no relationship between the tear length and any of the degenerative conditions. In this study, the AHD on plain radiographs displayed no significant relationship with the size or type of RC tear, which is consistent with a previous study (18).
There are no previous studies on the diagnostic reproducibility of tomosynthesis in subacromial impingement. An important observation in this study was the inverse correlation between the middle and posterior tomosynthetic AHDs and the size of the RC tear, especially in cases involving a full thickness tear. A possible explanation for this finding is that the already narrowed anterior tomosynthetic AHD of our consecutive patient series led to a reduction in the middle and posterior tomosynthetic AHDs. However, geometric factors also may be responsible. In the AHD measurement methods, the anterior tomosynthetic AHD was defined as the first point to show a clear margin of acromion. This approach might be more subjective than the determination of the middle and posterior tomosynthetic AHDs, which used relatively clear anatomical landmarks. This subjectivity might have influenced the outcome.
CT and MRI were performed in a supine position; whereas tomosynthesis was performed in an upright position since tomosynthesis accounts for gravity and allows a better determination of the subacromial impingement. Hébert et al. (33) reported the AHD measurements using an open-configuration MRI system in patients with shoulder impingement syndrome and healthy subjects. They demonstrated that the AHD progressively decreased with arm elevation, and the reduction in the AHD was significantly greater in the shoulder with impingement than in the asymptomatic contralateral shoulder. Open MRI takes approximately 1 minute; in contrast, tomosynthesis requires less than 7 seconds and is easy to use in daily clinical practice. It also has the advantage of evaluating bony structures with thin-section reconstruction.
The present study demonstrated that the AHD measurement using tomosynthesis (0.32 mSv) was reproducible, with a 3.3 times lower radiation dose than CT arthrography (1.06 mSv). Data from only two published studies were available to calculate the effective dose for radiography of the extremities (2234). The effective dose for shoulder tomosynthesis is approximately 0.32 mSv by the Monte Carlo method, which is approximately 32 times higher than that used for radiographic examinations (34) but considerably lower than that used for CT arthrographic examinations (35). The discrepancy between the effective dose for the CT arthrographic examination in this study (1.06 mSv) and previously published articles (2.06 mSv) may be related to the progression of the technology for reducing radiation doses across vendors.
There were several limitations to this study. First, this was a retrospective study and lacked a control group; therefore, we did not suggest a cutoff value of the AHD. Although we included consecutive patients, a selection bias may still have been introduced. Second, the sample size was small. To determine the clinical relationships with the AHD, a further prospective study including an age- and sex-matched control group might be helpful. Third, two radiologists subjectively measured the anterior tomosynthetic AHD. However, the excellent intraobserver and interobserver agreement observed justifies the use of this simple AHD measurement method.
In conclusion, the tomosynthetic AHD measurement is reproducible. Furthermore, tomosynthesis requires a relatively lower radiation dose compared with CT arthrography. The anatomical indices correlated with the patient size rather than the AHD.
Go to :
 XML Download